. 2018 Nov 15;175(5):1185-1197.e22.
doi: 10.1016/j.cell.2018.10.027. Epub 2018 Nov 8.

Reconstructing the Deep Population History of Central and South America

Cosimo Posth  1 Nathan Nakatsuka  2 Iosif Lazaridis  3 Pontus Skoglund  4 Swapan Mallick  5 Thiseas C Lamnidis  6 Nadin Rohland  3 Kathrin Nägele  6 Nicole Adamski  7 Emilie Bertolini  8 Nasreen Broomandkhoshbacht  7 Alan Cooper  9 Brendan J Culleton  10 Tiago Ferraz  11 Matthew Ferry  7 Anja Furtwängler  12 Wolfgang Haak  6 Kelly Harkins  13 Thomas K Harper  14 Tábita Hünemeier  15 Ann Marie Lawson  7 Bastien Llamas  9 Megan Michel  7 Elizabeth Nelson  16 Jonas Oppenheimer  7 Nick Patterson  17 Stephan Schiffels  6 Jakob Sedig  3 Kristin Stewardson  7 Sahra Talamo  18 Chuan-Chao Wang  19 Jean-Jacques Hublin  18 Mark Hubbe  20 Katerina Harvati  21 Amalia Nuevo Delaunay  22 Judith Beier  23 Michael Francken  23 Peter Kaulicke  24 Hugo Reyes-Centeno  21 Kurt Rademaker  25 Willa R Trask  26 Mark Robinson  27 Said M Gutierrez  28 Keith M Prufer  29 Domingo C Salazar-García  30 Eliane N Chim  31 Lisiane Müller Plumm Gomes  15 Marcony L Alves  31 Andersen Liryo  32 Mariana Inglez  15 Rodrigo E Oliveira  33 Danilo V Bernardo  34 Alberto Barioni  35 Veronica Wesolowski  31 Nahuel A Scheifler  36 Mario A Rivera  37 Claudia R Plens  38 Pablo G Messineo  36 Levy Figuti  31 Daniel Corach  39 Clara Scabuzzo  40 Sabine Eggers  41 Paulo DeBlasis  31 Markus Reindel  42 César Méndez  22 Gustavo Politis  36 Elsa Tomasto-Cagigao  24 Douglas J Kennett  10 André Strauss  43 Lars Fehren-Schmitz  44 Johannes Krause  16 David Reich  45
Affiliations

Reconstructing the Deep Population History of Central and South America

Cosimo Posth et al. Cell. .

Abstract

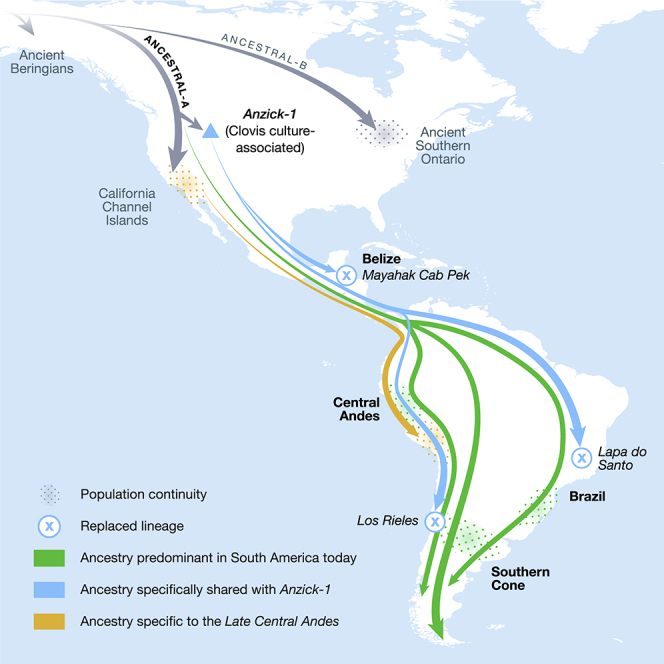
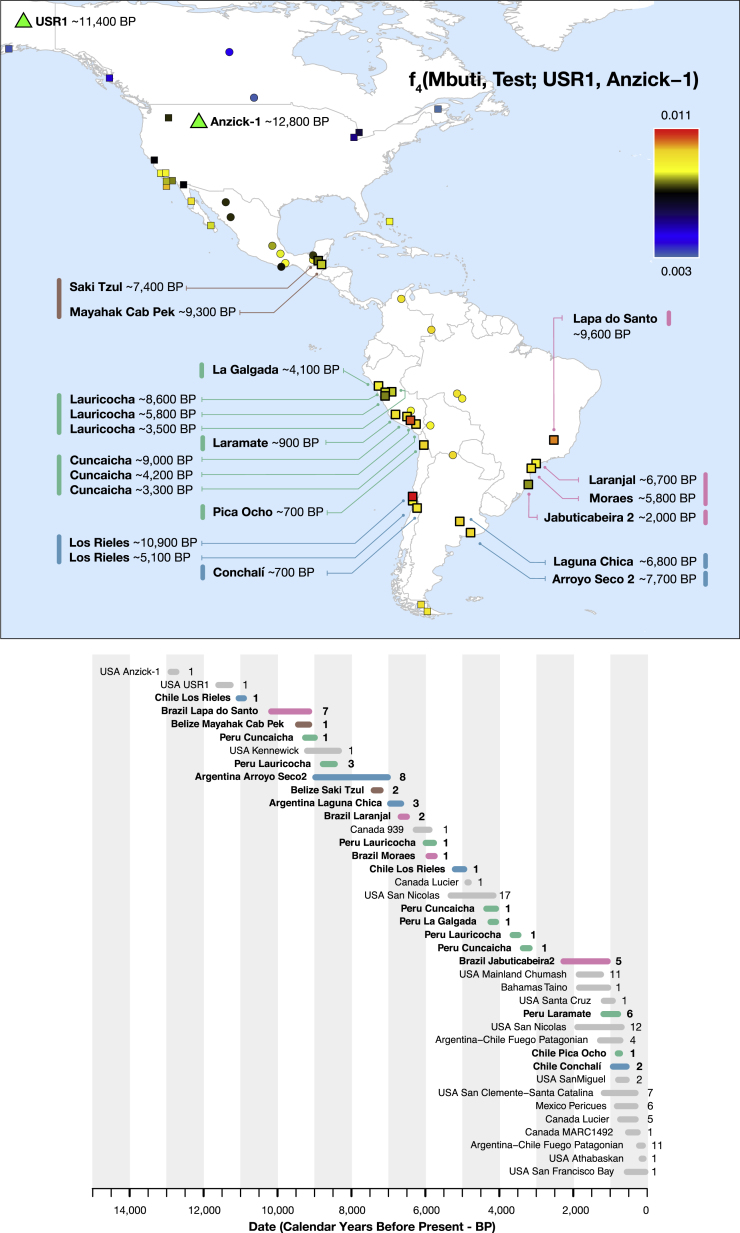
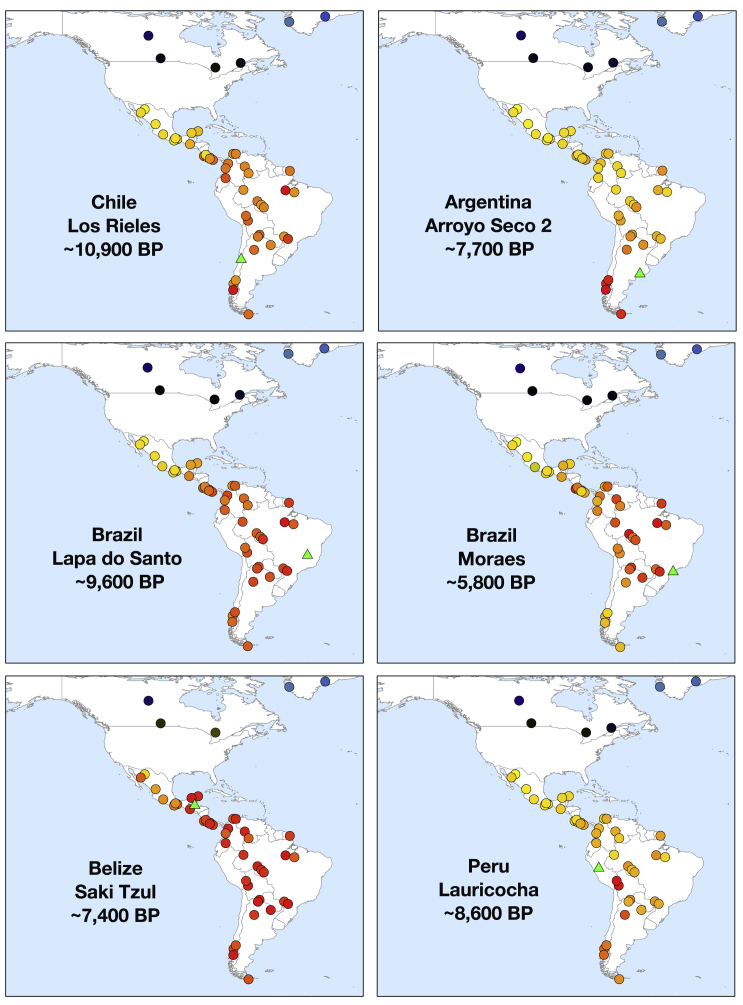
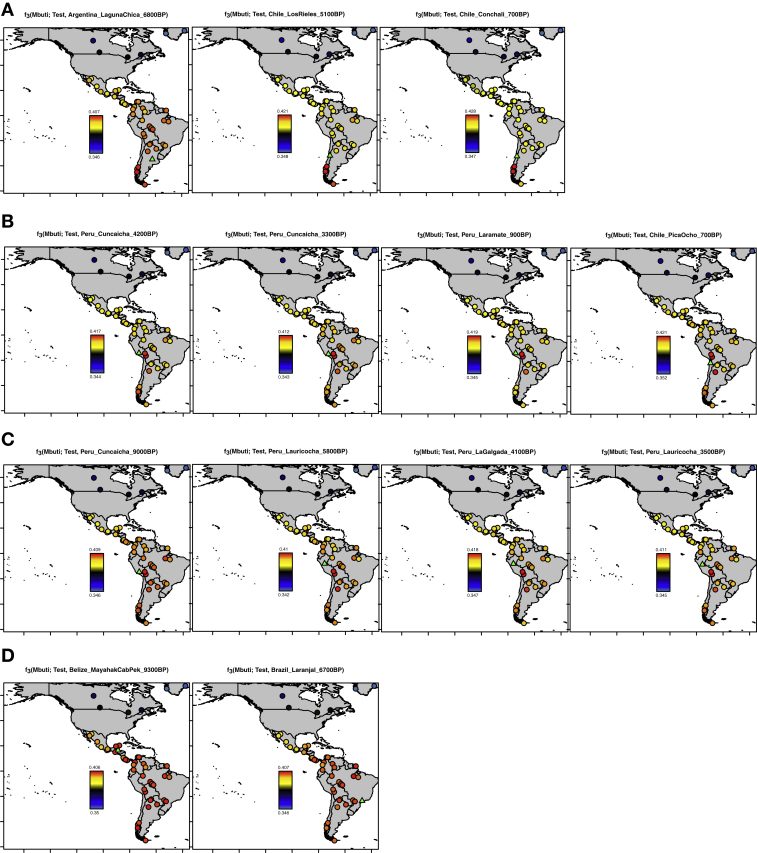
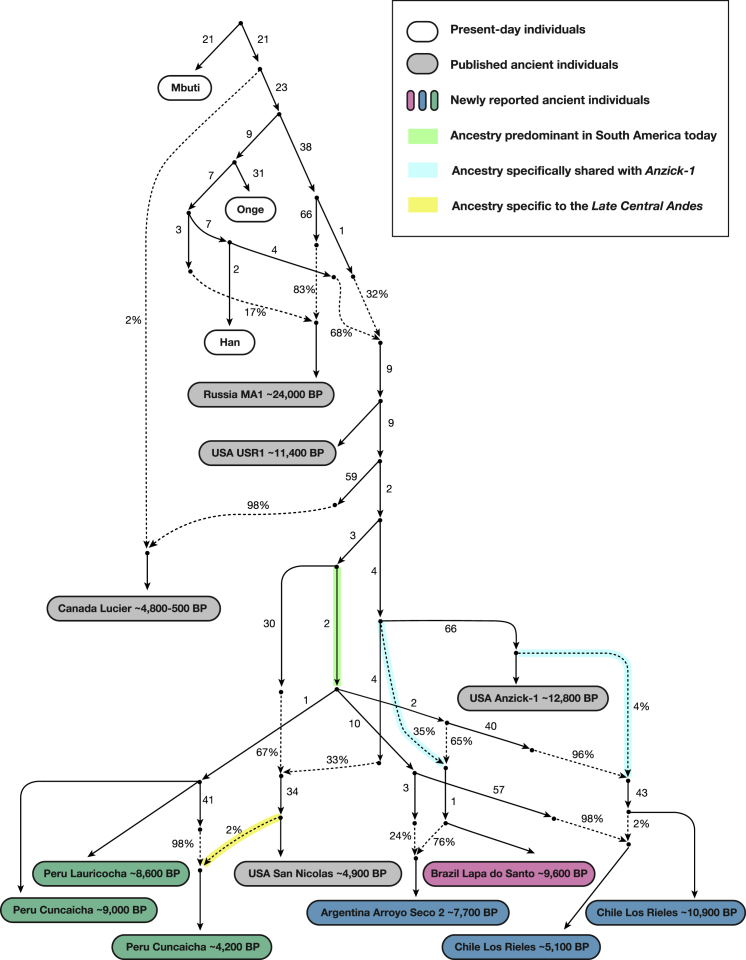
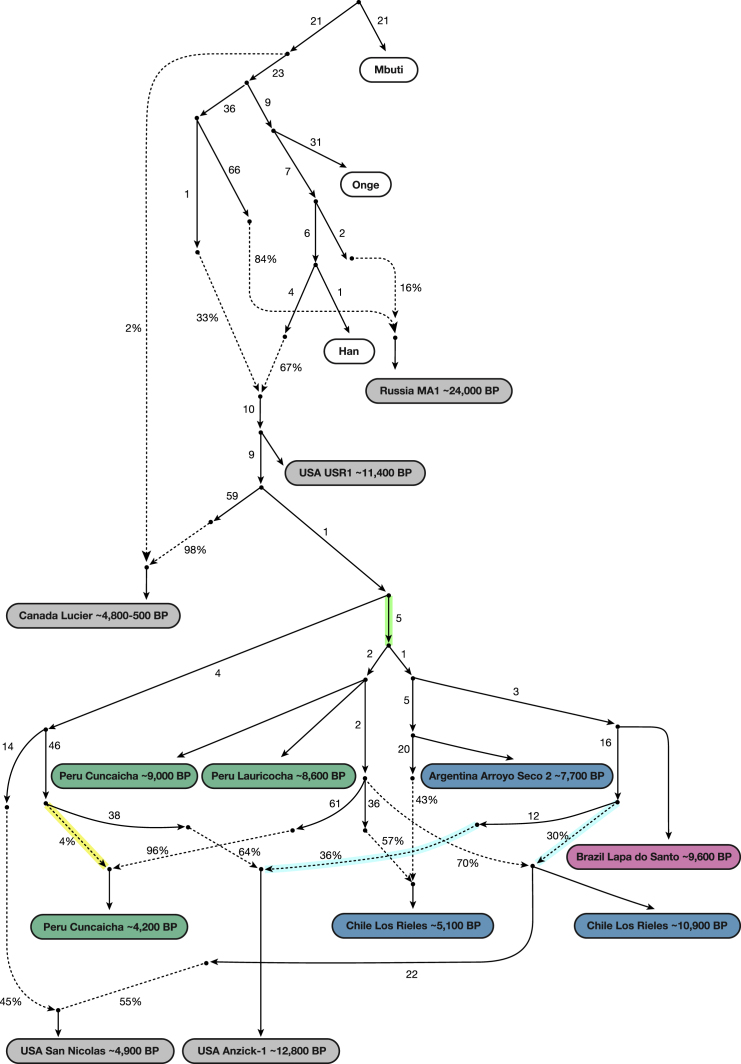
We report genome-wide ancient DNA from 49 individuals forming four parallel time transects in Belize, Brazil, the Central Andes, and the Southern Cone, each dating to at least ∼9,000 years ago. The common ancestral population radiated rapidly from just one of the two early branches that contributed to Native Americans today. We document two previously unappreciated streams of gene flow between North and South America. One affected the Central Andes by ∼4,200 years ago, while the other explains an affinity between the oldest North American genome associated with the Clovis culture and the oldest Central and South Americans from Chile, Brazil, and Belize. However, this was not the primary source for later South Americans, as the other ancient individuals derive from lineages without specific affinity to the Clovis-associated genome, suggesting a population replacement that began at least 9,000 years ago and was followed by substantial population continuity in multiple regions.

Keywords: Central America; South America; anthropology; archaeology; population genetics.


Figures

None
Graphical abstract
Figure 1
Figure 1
Geographic Locations and Time Ranges (Top) Color coding is based on the value of f4(Mbuti, Test; USR1, Anzick-1), which measures the degree of allele sharing of each Test population with Anzick-1 compared to the Ancient Beringian USR1 (the latter two plotted as green triangles). All values and standard errors are listed in Table S4. Present-day individuals are circles and ancient individuals are squares (the newly reported individuals are indicated with a thick black outline). (Bottom) We show previously published (gray) and newly reported ancient data. Magenta, Brazil; brown, Belize; green, Peru/northern Chile; blue, Southern Cone. The numbers give sample size in each grouping. See also Table S3.
Figure 2
Figure 2
Relatedness of Ancient to Present-Day People Allele sharing statistics of the form f3(Mbuti; Test, Ancient), where the “Ancient” individuals represented by a green triangle are Chile_LosRieles_10900BP, Argentina_ArroyoSeco2_7700BP, Brazil_LapaDoSanto_9600BP, Moraes_Brazil_5800BP, Belize_SakiTzul_7400BP, and Peru_Lauricocha_8600BP. The heatmap shows the degree of allele sharing, with red indicating most sharing; yellow, intermediate; and blue, least. See also Figures S2 and S3 and Table S1.
Figure S1
Figure S1
Relatedness of Ancient to Present-Day Individuals, Related to Figure 2 Outgroup f3-statistics of the form f3(Mbuti; Test, present day Native American), where Test is an ancient individual in Figure 2. (A) Southern Cone (Chile and Argentina) individuals. (B) Late Central Andes individuals. (C) Early Andes individuals. (D) Brazil and Belize individuals.
Figure S2
Figure S2
Correlation of Genetics and Geography, Related to Figures 2 and S1 Outgroup f3-statistics of the form f3(Mbuti; America1, America2) for both ancient and present-day Americ an groups for all individuals with over 100,000 SNPs of coverage. (A) Heatmap of the matrix of statistics. (B) Neighbor joining tree of the matrix of inverted statistics (distances = 1/outgroup f3-statistic). (C) MDS plot of the matrix of 1-outgroup f3-statistic. (D) PCA of ancient individuals projected onto present day variation. PCA built with the “unadmixed unmasked” version of the Illumina dataset (STAR Methods); newly reported ancient individuals are projected in black outline.
Figure S3
Figure S3
Relatedness of Jabuticabeira 2 Individuals to Present-Day Groups, Related to Figure 2 and Table S1 Outgroup f3-statistics of the form f3(Mbuti; Brazil_Jabuticabeira2_2000BP, present day Native American). We marked with blue outline groups that speak Tupi-Guarani languages (Karitiana, Surui, Guarani and Parakana) and with a white outline groups that speak Ge languages (Kaingang) and Carib languages (Arara), and find that the latter two have a specific affinity to Brazil_Jabuticabeira2_2000BP. Archeological site location is indicated with a green triangle on each map.
Figure S4
Figure S4
Minimum Number of Ancestral Sources, Related to Figures 4 and 5 qpWave analyses with all (A) pairs and (B) triplets of South American groups as “left” populations (related to Table S5, which also shows quadruplet and quintuplet statistics). Southern Cone, Belize, Brazil, and Early Andes individuals are labeled “Old,” while Late Central Andes individuals are labeled “Young.” Only individuals with over 100,000 SNPs covered were used for this analysis. The colors of the dots indicate whether the combination includes Brazil_LapaDoSanto_9600BP (red), Chile_LosRieles_10900BP (brown) or Argentina_ArroyoSeco2_7700BP or Argentina_LagunaChica_6800BP (orange). Cuncaicha_LA_combined refers to a combination of Peru_Cuncaicha_4200BP and Peru_Cuncaicha_3300BP. Rank 0 and 1 refers to a model in which all populations in the analysis fit as derived from one or two ancestral populations, respectively, relative to the outgroups (rejection of these ranks means that additional waves of ancestry are required to model the populations).
Figure 3
Figure 3
Skeleton Model that Fits the Data with Minimal Admixture This graph models nine of the ancient North, Central, and South American groups without admixture (branch lengths are in units of FST × 1,000). The maximum deviation between observed and expected f-statistics is Z = 2.9 (Z = 3.1 when restricting to transversions). Drift lengths in the terminal edges are unlabeled as randomly sampling an allele to represent each individual makes them artifactually long. See also Figure S6.
Figure S5
Figure S5
Alternative Admixture Graphs, Related to Figures 4 and 5 (A) Admixture graph in the same format as Figure 3 except with Chile_LosRieles_10900BP added. The maximum Z-score is 3.2 (we give in parentheses the value when restricting to transversions, here 3.1). The significant shared ancestry between the two Los Rieles individuals is indicated by statistics such as f4(Mbuti, Chile_LosRieles_10900BP; Argentina_ArroyoSeco2_7700BP, Chile_LosRieles_5100BP), which gives Z = 2.8. The following graphs have the same format of Figure 4 but (B) with Chile_PicaOcho_700BP instead of Peru_Cuncaicha_4200BP. The maximum Z-score is 3.4 (4.7, a signal of poor fit that may be an artifact of extremely low coverage of Chile_PicaOcho_700BP when restricting to transversions). (C) with Peru_Laramate_900BP instead of Peru_Cuncaicha_4200BP, which gives a maximum Z-score of 3.6 (3.5). Admixture graphs with an extra added admixture edge of ANC-B (D) for Peru_Cuncaicha_4200BP (maximum Z-score is 3.3 (3.0)), (E) for Chile_PicaOcho_700BP (maximum Z-score is 3.4 (4.8)), and (F) for Peru_Laramate_900BP (maximum Z-score is 3.5 (3.5)). Admixture graph including Surui, which shows the necessity of additional East Asian-related ancestry into (G) Peru_Cuncaicha_4200BP (maximum Z-score is 4.2 (3.7)). (H) Chile_PicaOcho_700BP (maximum Z-score is 4.0 (4.6)). (I) Peru_Laramate_900BP (maximum Z-score is 4.1 (3.5)).
Figure S6
Figure S6
No Evidence for Widespread ANC-B Ancestry in the Americas, Related to Figures 3–5 (A) Admixture graph in the same format as for Figure 2A of Scheib et al. (2018) (we left out USA_SanNicolas_1400BP (LSN in Scheib et al., 2018) from our modeling due to its known relationship with Pima, which would lead to higher maximum Z-scores of the later graphs). This graph has a maximum Z-score of 1.1 for mismatch between observed and expected f-statistics. (B-D) Admixture graphs in the same format as for A but with additional non-American populations with known relationships to American ones added as outgroups. B shows a poor fit (maximum Z-score = 4.8), likely due to lack of modeling of the “Population Y” signal. C and D have reasonable fits (maximum Z-scores = 3.4 and 3.0, respectively), but the genetic drift on the edge leading to Canada_Lucier_4800BP-500BP (ASO in Scheib et al., 2018) in all cases is not significantly different from zero when computing jackknife estimates by resampling over 100 contiguous blocks. Thus, the ancestry on the Canada_Lucier_4800BP-500BP branch that mixes into the South American groups does not share a significant amount of drift with Canada_Lucier_4800BP-500BP (see STAR Methods for more details).
Figure 4
Figure 4
Adding in the ∼12,800 BP Anzick-1 and ∼10,900 BP Los Rieles We used Figure 3 that models all analyzed Native Americans as unadmixed as a framework graph (excluding Belize_MayahakCabPek_9300BP because of relatively low coverage). We then added in Anzick-1 and Chile_LosRieles_10900BP. This model specifies three sources of North American related ancestry in South America, indicated by color-coding (Population Y ancestry is not included but Figures S5B–S5I show related fits some of which do include it). The maximum deviation between observed and expected f-statistics is Z = 3.4 (Z = 3.0 when restricting to transversions). The inferred 2% West Eurasian admixture into Canada_Lucier_4800BP-500BP is most likely explained by contamination in these samples by people of European ancestry. See also Figure S6 and Tables S4 and S5.
Figure 5
Figure 5
An Alternative Fitting Admixture Graph Obtained by a Semi-automated Method We also applied a semi-automated approach that aims to fit population relationships while minimizing the number of admixture events (STAR Methods) (Lazaridis et al., 2018). This is less plausible than Figure 4 on archaeological grounds, but it has a lower maximum Z score for the same number of admixture edges (Z = 2.9 for all sites, Z = 2.9 when restricting to transversions). Like Figure 4, this model specifies a minimum of three genetic exchanges between North and South America, indicated here by color-coding (please see Figure 4 color legend). See also Figure S6 and Table S5.
Figure S7
Figure S7
Mitochondrial DNA Phylogeny, Related to Figure 3, Figure 4, Figure 5 (A) Maximum parsimony phylogenetic tree of 65 ancient mtDNA (previously published sequences are in blue font and newly reported sequences are in red font) and 230 modern mtDNA sequences (in black font) built using MEGA6 (Tamura et al., 2013). Related to Table S3. The African mtDNA L haplogroup was used to root the tree (not shown). (A) Tree portion that includes mtDNA haplogroup C1, D4h3a and D1; (B) Tree portion that includes mtDNA haplogroup A2 and B2. The mtDNA sequence of individual LagunaChica_SC50_L763 (Table S3) is not reported in this tree due to the high proportion of unassigned positions (2444Ns).

Comment in

References

    1. Amorim C.E.G., Nunes K., Meyer D., Comas D., Bortolini M.C., Salzano F.M., Hünemeier T. Genetic signature of natural selection in first Americans. Proc. Natl. Acad. Sci. USA. 2017;114:2195–2199. - PMC - PubMed
    1. Bardill J., Bader A.C., Garrison N.A., Bolnick D.A., Raff J.A., Walker A., Malhi R.S., Summer internship for INdigenous peoples in Genomics (SING) Consortium Advancing the ethics of paleogenomics. Science. 2018;360:384–385. - PMC - PubMed
    1. Briggs A.W., Stenzel U., Meyer M., Krause J., Kircher M., Pääbo S. Removal of deaminated cytosines and detection of in vivo methylation in ancient DNA. Nucleic Acids Res. 2010;38:e87. - PMC - PubMed
    1. Cardich A. Volume 3. Centro Argentino de Estudios Prehistóricos; 1964. (Lauricocha: Fundamentos para una prehistoria de los Andes centrales).
    1. Chala-Aldana D., Bocherens H., Miller C., Moore K., Hodgins G., Rademaker K. Investigating mobility and highland occupation strategies during the Early Holocene at the Cuncaicha rock shelter through strontium and oxygen isotopes. J. Archaeol. Sci. Rep. 2018;19:811–827.

Publication types