. 2018 Nov 29;175(6):1533-1545.e20.
doi: 10.1016/j.cell.2018.10.023. Epub 2018 Nov 8.

Tempo and Mode of Genome Evolution in the Budding Yeast Subphylum

Affiliations

Tempo and Mode of Genome Evolution in the Budding Yeast Subphylum

Xing-Xing Shen et al. Cell. .

Abstract

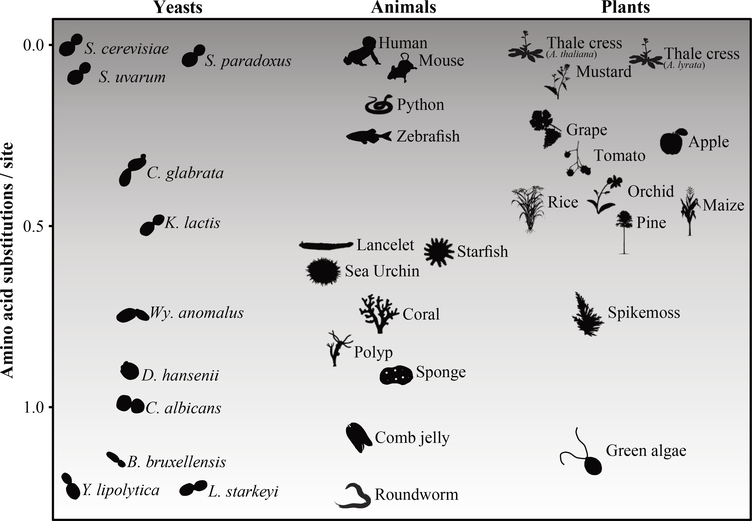
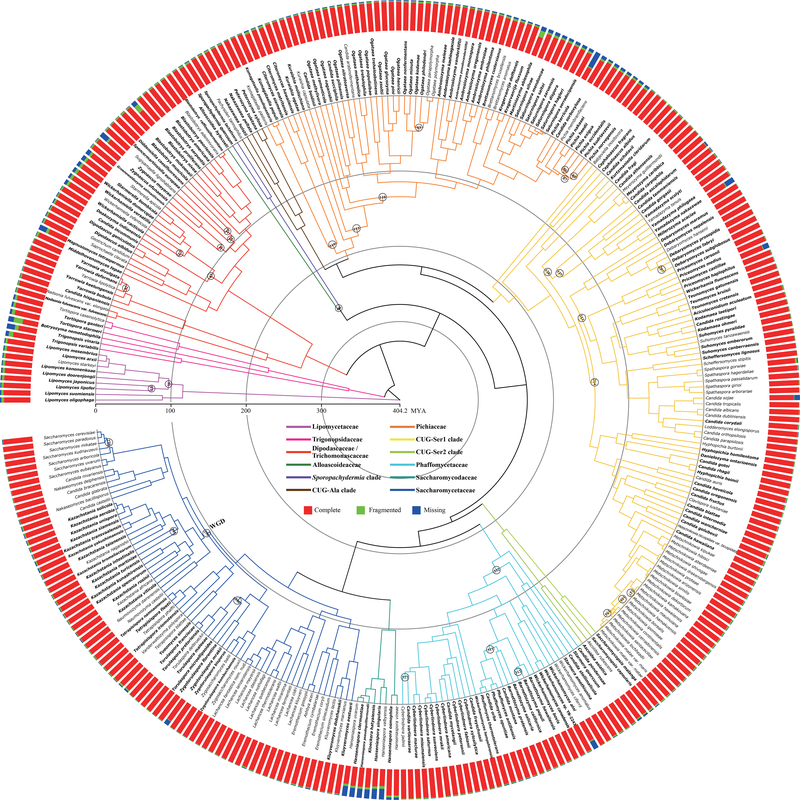
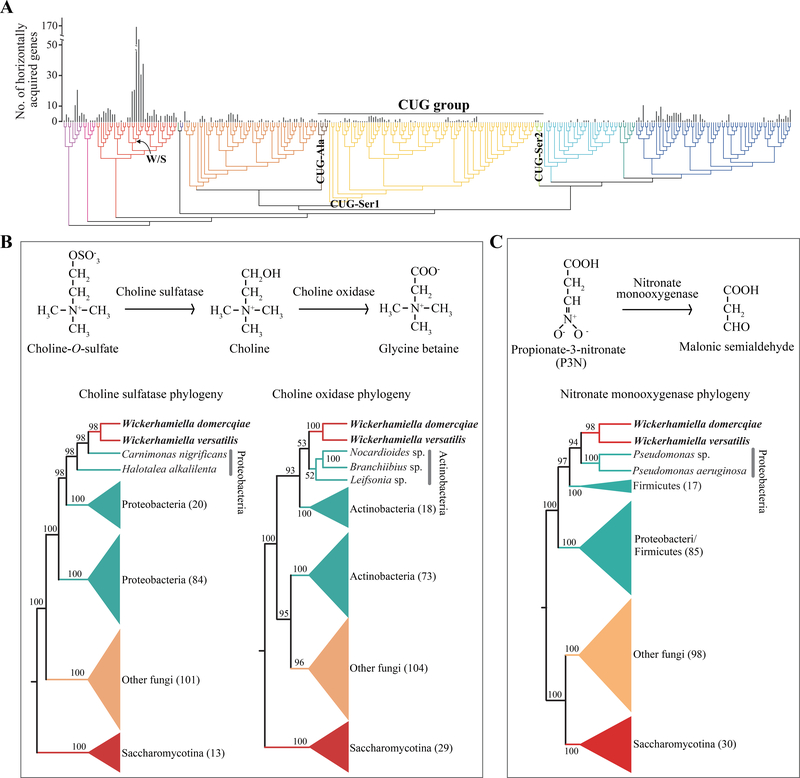
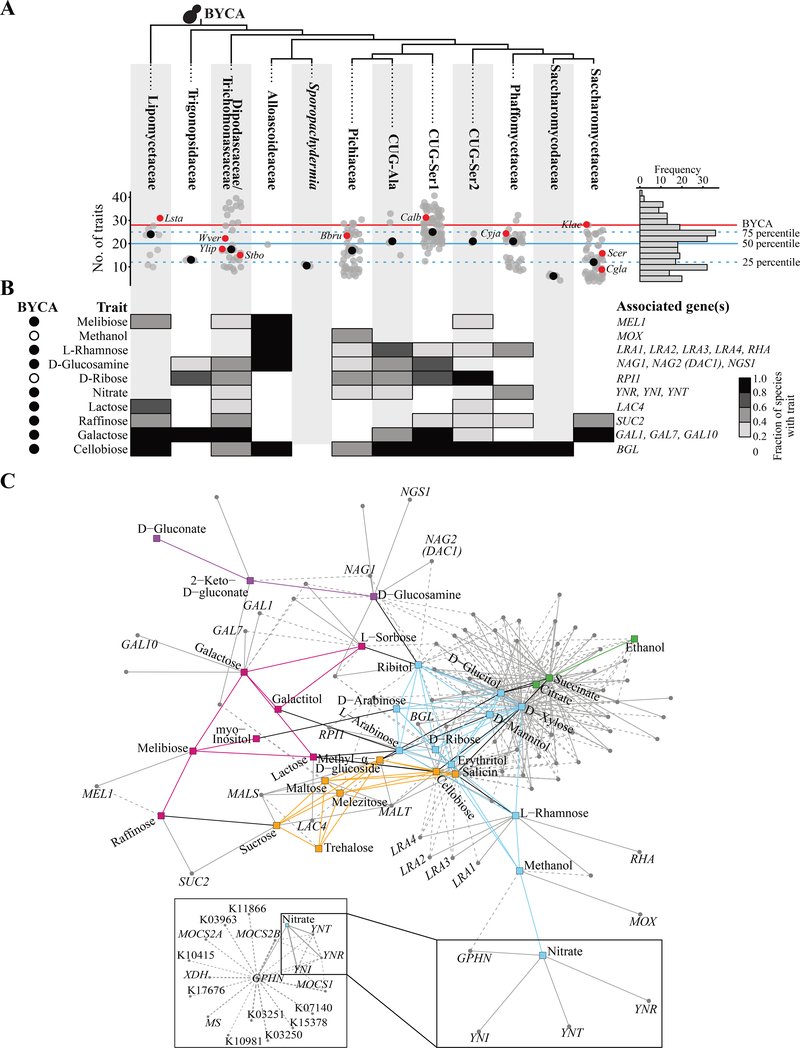
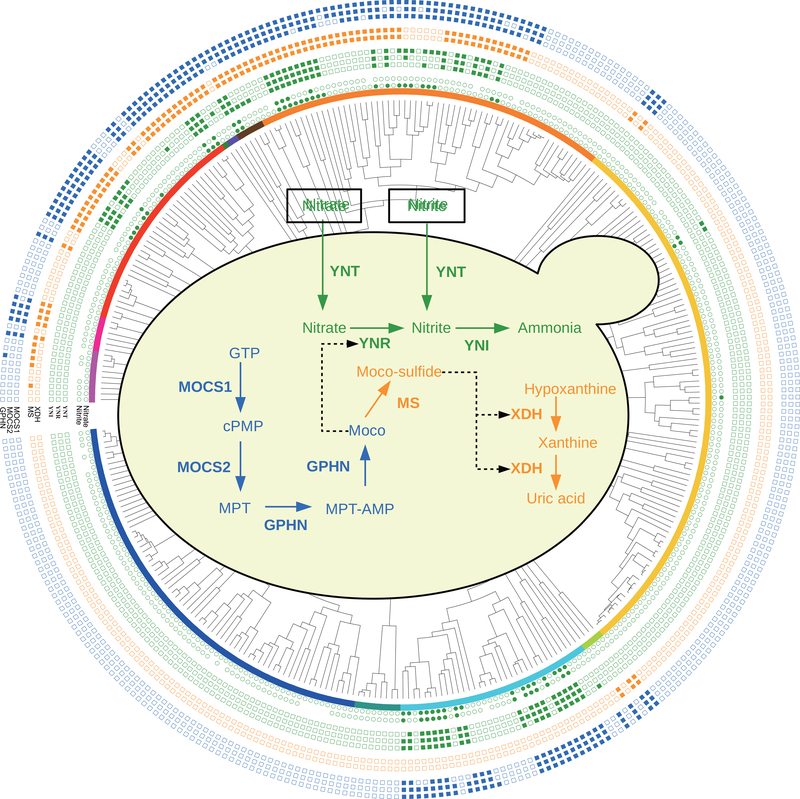
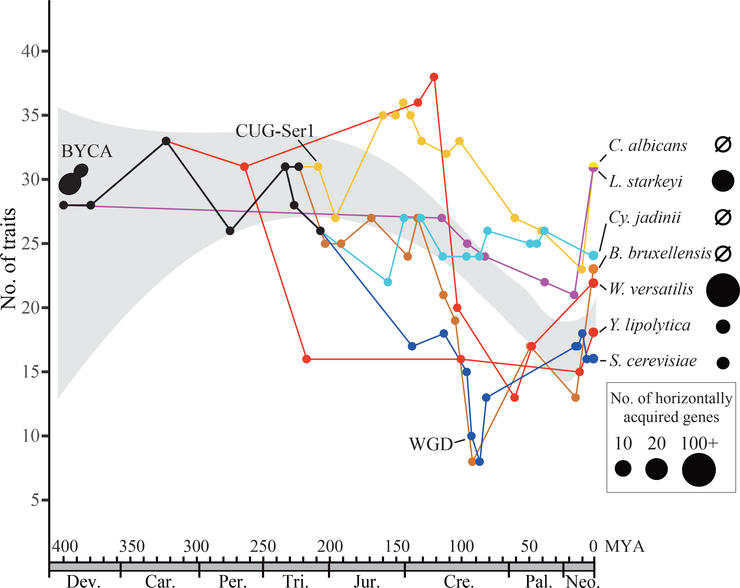
Budding yeasts (subphylum Saccharomycotina) are found in every biome and are as genetically diverse as plants or animals. To understand budding yeast evolution, we analyzed the genomes of 332 yeast species, including 220 newly sequenced ones, which represent nearly one-third of all known budding yeast diversity. Here, we establish a robust genus-level phylogeny comprising 12 major clades, infer the timescale of diversification from the Devonian period to the present, quantify horizontal gene transfer (HGT), and reconstruct the evolution of 45 metabolic traits and the metabolic toolkit of the budding yeast common ancestor (BYCA). We infer that BYCA was metabolically complex and chronicle the tempo and mode of genomic and phenotypic evolution across the subphylum, which is characterized by very low HGT levels and widespread losses of traits and the genes that control them. More generally, our results argue that reductive evolution is a major mode of evolutionary diversification.

Keywords: Ascomycota; Saccharomycotina; and reductive evolution; genomics; high-throughput sequencing; horizontal gene transfer; metabolic traits; molecular dating; phylogenetics; phylogenomics.


Conflict of interest statement

Declaration of Interests

The authors declare no competing interests.

Figures

Figure 1.
Figure 1.. Levels of evolutionary sequence divergence within the budding yeast subphylum are on par with levels observed in animals and plants.
The phylogenetic distance (in terms of amino acid substitutions / site) between iconic species in budding yeasts (Saccharomyces cerevisiae), animals (Homo sapiens), and plants (Arabidopsis thaliana) and other representative species in each lineage. For each lineage, phylogenetic distance was estimated from a concatenated ML tree inferred from analysis of 295 single-copy BUSCO genes. S. cerevisiae = Saccharomyces cerevisiae; S. paradoxus = Saccharomyces paradoxus; S. uvarum = Saccharomyces uvarum; C. glabrata = Candida glabrata; K. lactis = Kluyveromyces lactis; Wy. anomalus = Wickerhamomyces anomalus; D. hansenii = Debaryomyces hansenii; C. albicans = Candida albicans; B. bruxellensis = Brettanomyces bruxellensis; L. starkeyi = Lipomyces starkeyi; Y. lipolytica = Yarrowia lipolytica. Images representing taxa were drawn by hand, taken from PhyloPic (http://phylopic.org), or modified from Google Images. The data matrix and ML tree in Newick format used for calculating sequence divergence in each of the three lineages are provided in the Figshare depository.
Figure 2.
Figure 2.. Time-calibrated phylogeny of the budding yeast subphylum.
Divergence times were estimated using the autocorrelated clock model of rate variation across different lineages implemented in MCMCTree (clock=3), with a topology reconstructed from the concatenation-based maximum likelihood analysis of 2,408 amino acid orthologous groups (OGs) under a single LG+G4 model. The thirty-two internal branches that were not robustly recovered across our analyses are marked with circles. The 220 genomes published in this study are shown in bold. The bar plot next to each species indicates genomic quality assessed by a set of 1,759 BUSCO genes. “Complete” indicates the fraction of full-length BUSCO genes; “Fragmented” indicates the fraction of genes with a partial sequence; and “Missing” indicates the fraction of genes not found in the genome. Note that the CUG-Ser1 clade includes interspersed taxa from the families Debaryomycetaceae, Metschnikowiaceae, and Cephaloascaceae; the CUG-Ser2 clade includes the families Ascoideaceae and Saccharomycopsidaceae; the newly recovered CUG-Ala clade includes several taxa in need of reassignment; the Pichiaceae clade includes several taxa in need of reassignment; and the Dipodascaceae/Trichomonascaceae clade includes interspersed taxa mainly from these two families. MYA: million years ago. See also Figures S1, S2 and S3 and Tables S1 and S2.
Figure 3.
Figure 3.. Very few budding yeast genes were acquired via horizontal gene transfer (HGT).
(A) Mapping of the 878 putative HGT-acquired genes on the 332-taxon phylogeny of budding yeasts (Figure 2). These 878 genes were acquired through 365 distinct HGT events, of which 230 appear to be species-specific and the other 135 involve two or more species. (B) Two independent HGT events provided osmotolerant budding yeasts the genetic machinery to produce the osmoprotectant glycine betaine. On the top, the biochemical pathway for the biosynthesis of glycine betaine from choline-O-sulfate is shown. Choline-O-sulfate is first converted by the action of choline sulfatase into choline; then, choline is converted by the action of choline oxidase into glycine betaine. On the bottom, the phytogenies for the choline sulfatase and choline oxidase genes are shown. Note that the sequences of the sister lineages to the W. domercqiae and W. versatilis choline sulfatase sequences are from Proteobacteria, whereas the sequences of the sister lineages to the W. domercqiae and W. versatilis choline oxidase sequences are from Actinobacteria. (C) Two independent events provided two different lineages of budding yeasts (the W/S clade and a clade of three species in the genus Kluyveromyces) the genetic machinery to metabolize the mitochondrial toxin propionate-3-nitronate (P3N). On the top, the biochemical pathway for the oxidation of P3N is shown, where P3N is converted into malonic semialdehyde via the action of nitronate monooxygenase. On the bottom, the phylogeny for the nitronate monooxygenase acquired by an ancestor of W. domercqiae and W. versatilis is shown. Note that the sequences of the sister lineages to the W. domercqiae and W. versatilis nitronate monooxygenase sequences are from Proteobacteria in the genus Pseudomonas, whereas the sequences of the sister lineages to the three Kluyveromyces nitronate monooxygenase sequences are from Proteobacteria in the genus Acinetobacter. The budding yeast species inferred to have been the recipients of horizontally transferred genes are shown in bold. Data matrices and phylogenies for all HGT-acquired genes are provided in the Figshare repository. See also Figures S4 and S5 and Table S3.
Figure 4.
Figure 4.. Evolution of metabolic traits across the budding yeast subphylum.
(A) The number of traits per major clade (columns) is depicted in a scatterplot where each grey dot corresponds to a species. Red dots indicate representative species, and black dots represent the median number of traits across each family. On the right is the distribution across the subphylum Saccharomycotina in histogram form. The red line corresponds to the inferred number of metabolic traits present (i.e., posterior probability of trait presence > 0.5 in Table 1) in the BYCA (budding yeast common ancestor). The blue dashed and solid lines represent the 75th (25 traits), 50th (median; 20 traits), and 25th (12 traits) percentiles of the numbers of traits, respectively. Representative species names are written using a four-letter abbreviation as follows: Lsta: Lipomyces starkeyi; Ylip: Yarrowia lipomyces; Wver: Wickerhamiella versatilis; Stbo: Starmerella bombicola; Bbru: Brettanomyces bruxellensis; Calb: Candida albicans; Cyja: Cyberlindnera jadinii; Klac: Kluyveromyces lactis; Cgla: Candida glabrata; Scer: Saccharomyces cerevisiae. (B) Heatmap showing the fraction of species in each major clade (columns) that display a representative set of metabolic traits; values near white indicate major clades (whose species are) lacking the trait, and values near black indicate major clades with the trait. To the left of the heatmap, the presence (black) or absence (white) of a trait in BYCA (inferred from ancestral trait reconstruction) is shown. To the right of the heatmap, well-characterized genes whose distributions are significantly associated with each trait are shown. (C) Positive association network for genes and traits. Traits and genes are represented by squares and circles, respectively. Trait communities are represented by the following colors: magenta, Contains Galactose; purple, Modified Glucose, green, Respiratory; orange, Glucosides; and cyan, Sugar Alcohols & Pentose Phosphate Pathway (Opulente et al., 2018). Associations among gene and traits were calculated using Mutual Information (MI) analysis, and negative associations were detected using a Jaccard index (all values less than 0.25 were considered negative associations and excluded). Edges connecting genes to traits are colored gray and are represented by solid lines for associations that had a MI value greater than or equal to 0.15; for genes already appearing in the figure, dashed lines representing MI values between 0.10 and 0.15 were included. The inset includes genes associated with GPHN, which encodes gephyrin. See also Figure S6 and Tables S4 and S5.
Figure 5.
Figure 5.. Interconnections and interdependence of nitrate assimilation, xanthine assimilation, and the molybdopterin cofactor (Moco) biosynthesis pathways across the budding yeast subphylum.
The concentric tracks on the periphery of the figure depict (from inner to outer) the phylogenetic distribution of: growth phenotype on media containing nitrate or nitrite as a sole nitrogen source (inner green circles) and genes encoding proteins involved in nitrate/nitrite assimilation (green squares); hypoxanthine/xanthine assimilation (orange squares); and Moco biosynthesis (blue squares). The underlying phylogeny and distribution of taxa is the same as in Figure 2, but species names have been omitted. The central diagram depicts the individual steps of nitrate assimilation (green, top), xanthine assimilation (orange, right), and Moco biosynthesis (blue, left) pathways, with proteins involved shown in bold: nitrate transporter (YNT), nitrate reductase (YNR), nitrite reductase (YNI), cyclic pyranopterin monophosphate synthase (MOCS1), molybdopterin synthase (MOCS2), gephyrin (GPHN), molybdopterin sulfurtransferase (MS), and xanthine dehydrogenase (XDH). Molecules in the pathways: guanosine triphosphate (GTP), cyclic pyranopterin monophosphate (cPMP), molybdopterin (MPT), adenylated molybdopterin (MPT-AMP), molybdenum cofactor (Moco), and thiomolybdenum cofactor (Moco-sulfide). Solid arrows indicate subsequent steps in each pathway; dashed lines indicate use of a specific cofactor by an enzyme. See also Table S6.
Figure 6.
Figure 6.. The evolution of the budding yeast subphylum is characterized by lineage-variable HGT and widespread losses of genes and traits.
The x-axis depicts the posterior mean of the age of (representative) nodes in the budding yeast phylogeny, and the y-axis depicts the number of metabolic traits inferred to have been present at these nodes. The lines of different colors represent the evolutionary trajectories (in the spaces of time and metabolic traits) for 7 representative yeast taxa and their common ancestors (depicted by dots). For each ancestral node, metabolic traits were considered to be present when the posterior probability of ancestral state 1 (present) was > 0.5 for the node. The gray region is the 95% confidence interval for the number of metabolic traits present across budding yeast evolution based on ancestral trait reconstruction of the distribution of inferences for 45 metabolic traits across 274 budding yeasts. The inferred numbers of HGT-acquired genes are depicted by the circles of different sizes next to each taxon’s name. C. albicans = Candida albicans; L. starkeyi = Lipomyces starkeyi; Cy. jadinii = Cyberlindnera jadinii; B. bruxellensis = Brettanomyces bruxellensis; W. versatilis = Wickerhamiella versatilis; Y. lipolytica = Yarrowia lipolytica; S. cerevisiae = Saccharomyces cerevisiae; BYCA: Budding Yeast Common Ancestor; MYA: million years ago; Dev. = Devonian; Carb. = Carboniferous; Per. = Permian; Tri. =Triassic; Jur. = Jurassic; Cre. = Cretaceous; Pal. = Paleogene; and Neo. = Neogene. See also Figure S7.

References

    1. Albalat R, and Canestro C (2016). Evolution by gene loss. Nat. Rev. Genet 17, 379–391. - PubMed
    1. Alexa A, and Rahnenfuhrer J (2016). Gene set enrichment analysis with topGO. Http://Www.Bioconductor.Org/.
    1. Bankevich A, Nurk S, Antipov D, Gurevich AA, Dvorkin M, Kulikov AS, Lesin VM, Nikolenko SI, Pham S, Prjibelski AD, et al. (2012). SPAdes: A New Genome Assembly Algorithm and Its Applications to Single-Cell Sequencing. J. Comput. Biol 19, 455–477. - PMC - PubMed
    1. Bittner F, Oreb M, and Mendel RR (2001). ABA3 is a molybdenum cofactor sulfurase required for activation of aldehyde oxidase and xanthine dehydrogenase in Arabidopsis thaliana. J. Biol. Chem 276, 40381–40384. - PubMed
    1. Bolger AM, Lohse M, and Usadel B (2014). Trimmomatic: a flexible trimmer for Illumina sequence data. Bioinformatics 30, 2114–2120. - PMC - PubMed

Publication types