. 2018 Nov 15;72(4):727-738.e5.
doi: 10.1016/j.molcel.2018.10.010. Epub 2018 Nov 8.

Spatial Organization of Single mRNPs at Different Stages of the Gene Expression Pathway

Affiliations

Spatial Organization of Single mRNPs at Different Stages of the Gene Expression Pathway

Srivathsan Adivarahan et al. Mol Cell. .

Abstract

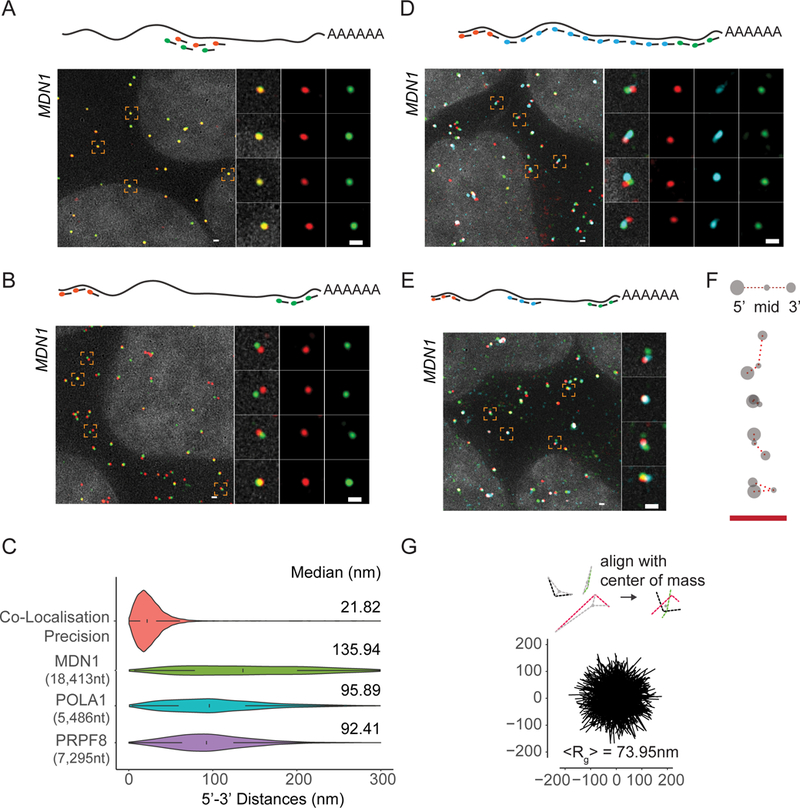
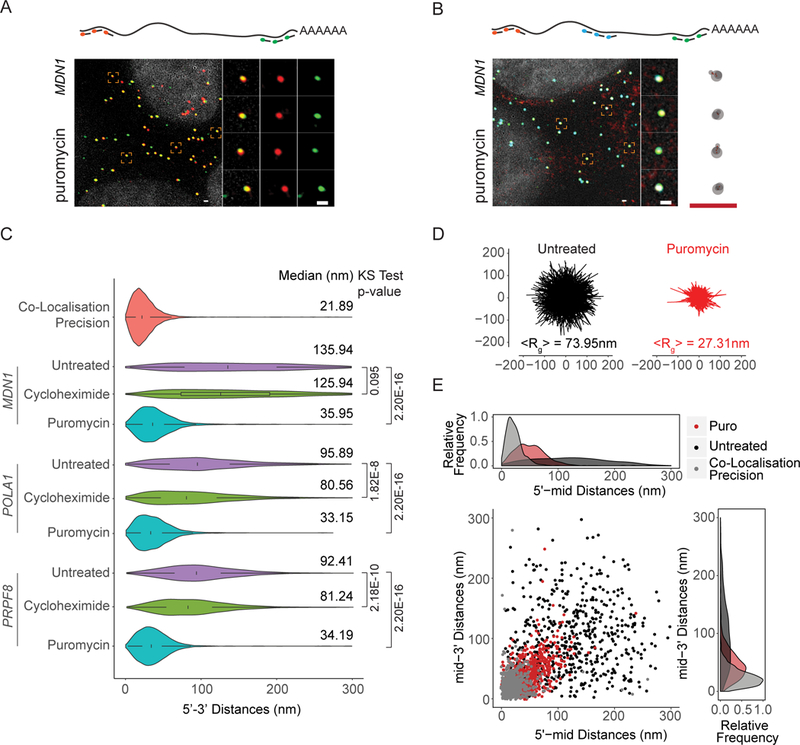
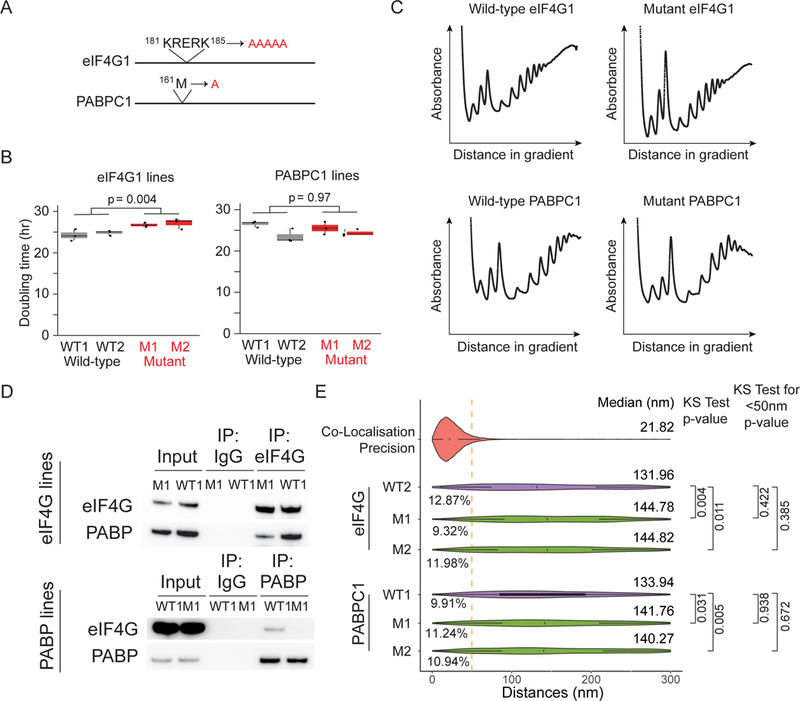
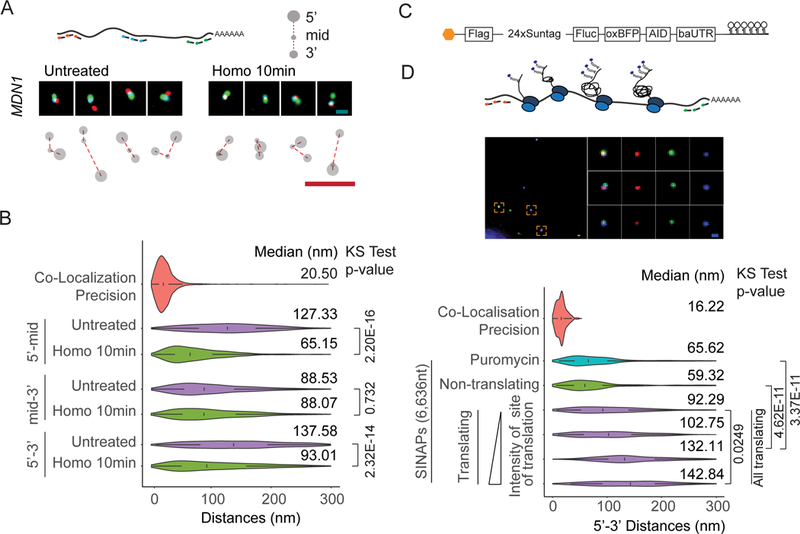
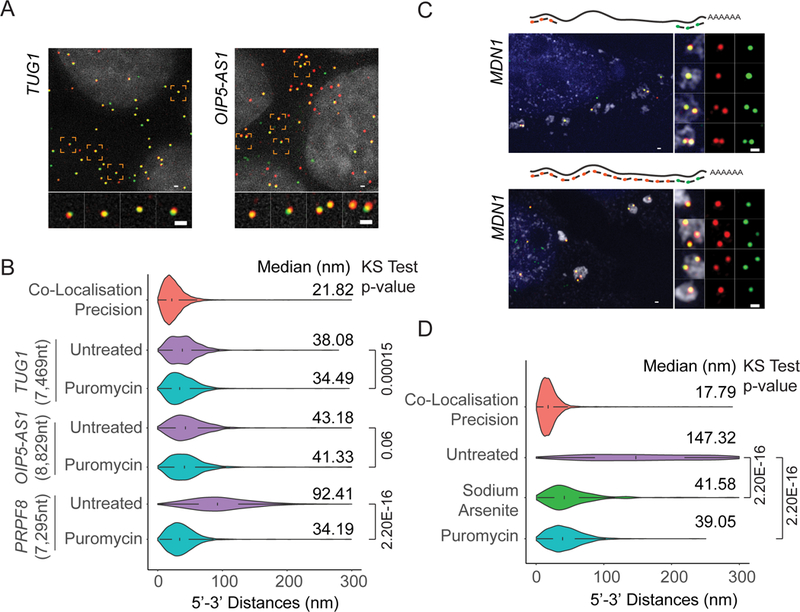
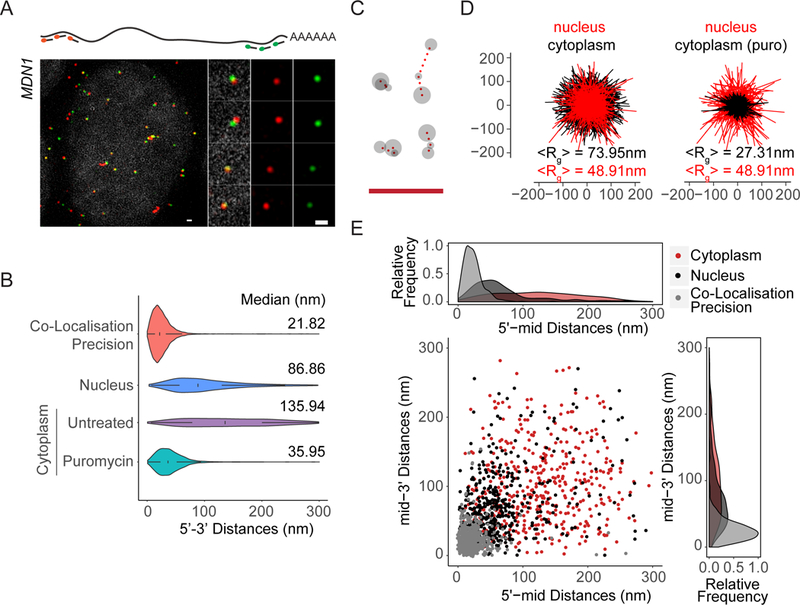
mRNAs form ribonucleoprotein complexes (mRNPs) by association with proteins that are crucial for mRNA metabolism. While the mRNP proteome has been well characterized, little is known about mRNP organization. Using a single-molecule approach, we show that mRNA conformation changes depending on its cellular localization and translational state. Compared to nuclear mRNPs and lncRNPs, association with ribosomes decompacts individual mRNAs, while pharmacologically dissociating ribosomes or sequestering them into stress granules leads to increased compaction. Moreover, translating mRNAs rarely show co-localized 5' and 3' ends, indicating either that mRNAs are not translated in a closed-loop configuration, or that mRNA circularization is transient, suggesting that a stable closed-loop conformation is not a universal state for all translating mRNAs.

Keywords: RNA compaction; RNA imaging; RNA structure; closed-loop translation; long non-coding RNAs; mRNP organization; smFISH; stress granules; super resolution microscopy; translation.


Conflict of interest statement

Declaration of Interests

The authors declare no competing interests.

Figures

Figure 1
Figure 1. See also Figure S2: Visualizing single mRNA reveals open conformations of cytoplasmic mRNAs.
(A) smFISH images using alternating probes labeled in cy3 (red) and cy5 (green) to middle region of MDN1 mRNA (Probe Set#1, Table S3) in paraformaldehyde fixed HEK 293 cells. Nuclei are visualized by DAPI staining (grey). Magnified images of individual RNAs marked by dashed squares are shown on the right. Schematic position of probes shown on top. (B) smFISH using probes targeting the 5’ (red) and 3’ (green) ends of MDN1 mRNAs (Probe Set#2, Table S3). (C) Violin plots showing distance distribution of co-localization precision of co-localizing spots from A, and 5’−3’ distances for MDN1, POLA1, PRPF8 mRNAs determined by Gaussian fitting. White box plot inside the violin plot shows first quartile, median and third quartile. Median distances are shown on the right. (D, E) smFISH using 5’ (red), 3’ (green), and tiling or middle probes (cyan) respectively (Probe Sets#3,4, Table S3). (F) Cartoon depicting different mRNA conformations from E. (G) Projections of superimposed conformations with their centers of mass in registry, n=563. Mean Radius of gyration (<Rg>). Scale bars, 500 nm
Figure 2
Figure 2. See also Figure S3: Open mRNP conformation correspond to translating mRNA.
(A, B) 5’ and 3’ (Probe Set#2, Table S3) or three color MDN1 mRNA smFISH (Probe Set#4, Table S3) in HEK 293 cells treated with puromycin (10min, 100µg/ml). (C) Violin plots showing 5’−3’ distances for MDN1, POLA1, PRPF8 mRNAs in untreated and cells treated with cycloheximide and puromycin. White box plot inside the violin plot shows first quartile, median and third quartile. Median distances and p-values calculated using Kolmogorov-Smirnov test are shown on the right. (D) Projections of superimposed conformations from three color MDN1 mRNA smFISH (Probe Set#4, Table S3) in untreated and puromycin treated cells with their centers of mass in registry, n=563. Mean Radius of gyration (<Rg>). (E) Scatter plot showing 5’mid and mid-3’ distances for individual RNAs. Frequency distribution are shown on top and on the right. Scale bars, 500 nm.
Figure 3
Figure 3. See also Figure S4: Inhibiting eIF4G1-PABC1 interactions does not alter 5’−3’ distances.
(A) Sites of amino acid substitutions in eIF4G1 and PABPC1 cell lines. (B) Doubling time for eIF4G1 and PABPC1 CRISPR-edited lines. Shown are the doubling times calculated for three independent biological replicates for two independent wild-type and mutant eIF4G1 and PABPC1 lines. (C) Polysome profiles for wild-type eIF4G1, wild-type PABPC1, mutant eIF4G1, and mutant PABPC1 lines. (D) Immuno-precipitation of eIF4G1 and PABPC1 from wild-type and mutant cell lines using anti-eIF4G1 and PABPC1 anti-bodies. (E) Violin plots showing distance distribution of co-localization precision from 5’−3’ distances for MDN1 mRNAs in wild type and mutant cell lines (Probe Set#2, Table S3). White box plot inside the violin plot shows first quartile, median and third quartile. Median distances and p-values calculated using Kolmogorov-Smirnov test are shown on the right. WT1/WT2/M1/M2 represent different clonal cell lines.
Figure 4
Figure 4. See also Figure S5: Ribosome occupancy determines mRNP compaction.
(A) smFISH using 5’ (red), 3’ (green), and middle probes (cyan) respectively (Probe Set#4, Table S3) for untreated and homoharringtonine (100µg/ml, 10min) treated cells and cartoon depicting different mRNA conformations. (B) Violin plots showing 5’-mid, mid-3’ and 5’−3’distance distribution of cytoplasmic MDN1 mRNAs in untreated and homoharringtonine treated cells. (C) Cartoon depicting the SINAPs construct (D) Images showing 5’ and 3’ smFISH and anti-GFP immunofluorescence (Probe Set#15, Table S3) (top), and violin plots depicting 5’−3’ distances for puromycin treated, non-translating and translating mRNAs. Translating mRNAs were clustered in 4 groups (k-means) according to intensity of anti-GFP signal (bottom). White box plot inside the violin plot shows first quartile, median and third quartile. Median distances and pvalues calculated using Kolmogorov-Smirnov test are shown on the right. Scale bars, 500 nm.
Figure 5
Figure 5. See also Figure S6: lncRNAs in the cytoplasm and mRNAs sequestered to stress granules show compact conformations.
(A) smFISH visualizing 5’ and 3’ ends of TUG1 and OIP5-AS1 lncRNAs (Probe Sets#7,8, Table S3). Nuclei are visualized by DAPI staining (grey). (B) Violin plots showing 5’−3’ distance distribution of cytoplasmic TUG1 and OIP5-AS1 lncRNAs in untreated and puromycin treated cells compared to PRPF8 mRNAs. (C) 5’ - 3’ (Probe Set#9, Table S3) or 3’ and tiling (Probe Set#10, Table S3) MDN1 mRNA smFISH in U2OS cells treated with arsenite (1hour, 2 mM). Stress granules are visualized using an oligo dT probe (grey). Nuclei are visualized by DAPI staining (blue). (D) Violin plots comparing MDN1 mRNA 5’−3’ distance distribution for untreated, arsenite and puromycin treated U2OS cells. For arsenite treated cells, only mRNAs in stress granules were considered. White box plot inside the violin plot shows first quartile, median and third quartile. Median distances and p-values calculated using Kolmogorov-Smirnov test are shown on the right. Scale bars, 500 nm.
Figure 6
Figure 6. See also Figure S7: Organization of nuclear MDN1 mRNAs.
(A) 5’-3’ MDN1 mRNA smFISH (Probe Set#2, Table S3) of nuclear mRNAs. The nucleus was stained with DAPI (gray). (B) Violin plots comparing MDN1 mRNA 5’−3’ distance distribution of nuclear and cytoplasmic mRNAs. White box plot inside the violin plot shows first quartile, median and third quartile. Median distances are shown on the right. (C) Representative conformations of nuclear MDN1 mRNAs observed by 5’, middle and 3’ labeling as in 1E. (D) Projections of superimposed conformations with their centers of mass in registry, compared to untreated or puromycin treated cytoplasmic MDN1 mRNAs, n=452. Mean Radius of gyration (<Rg>). (E) Scatter plot comparing 5’-mid and mid-3’ distances for individual nuclear and cytoplasmic MDN1 mRNAs. Frequency distribution are shown on top and on the right. Scale bars, 500 nm.

Comment in

References

    1. Afonina ZA, Myasnikov AG, Shirokov VA, Klaholz BP, Spirin AS (2015). Conformation transitions of eukaryotic polyribosomes during multi-round translation. Nucleic Acids Res 43, 618–628. - PMC - PubMed
    1. Archer SK, Shirokikh NE, Hallwirth CV, Beilharz TH, Preiss T (2015). Probing the closed-loop model of mRNA translation in living cells. RNA Biol 12, 248–254. - PMC - PubMed
    1. Batisse J, Batisse C, Budd A, Böttcher B, Hurt E (2009). Purification of nuclear poly(A)-binding protein Nab2 reveals association with the yeast transcriptome and a messenger ribonucleoprotein core structure. J. Biol. Chem 284, 34911–34917. - PMC - PubMed
    1. Bhat M, Robichaud N, Hulea L, Sonenberg N, Pelletier J, Topisirovic I (2015). Targeting the translation machinery in cancer. Nat. Rev. Drug Discov 14, 261–278. - PubMed
    1. Bin Wu, Eliscovich C, Yoon YJ, Singer RH (2016). Translation dynamics of single mRNAs in live cells and neurons. Science 352, 1430–1435. - PMC - PubMed

Publication types

LinkOut - more resources