. 2018 Nov 15;72(4):715-726.e3.
doi: 10.1016/j.molcel.2018.09.012. Epub 2018 Nov 8.

Higher-Order Organization Principles of Pre-translational mRNPs

Affiliations

Higher-Order Organization Principles of Pre-translational mRNPs

Mihir Metkar et al. Mol Cell. .

Abstract

Compared to noncoding RNAs (ncRNAs), such as rRNAs and ribozymes, for which high-resolution structures abound, little is known about the tertiary structures of mRNAs. In eukaryotic cells, newly made mRNAs are packaged with proteins in highly compacted mRNA particles (mRNPs), but the manner of this mRNA compaction is unknown. Here, we developed and implemented RIPPLiT (RNA immunoprecipitation and proximity ligation in tandem), a transcriptome-wide method for probing the 3D conformations of RNAs stably associated with defined proteins, in this case, exon junction complex (EJC) core factors. EJCs multimerize with other mRNP components to form megadalton-sized complexes that protect large swaths of newly synthesized mRNAs from endonuclease digestion. Unlike ncRNPs, wherein strong locus-specific structures predominate, mRNPs behave more like flexible polymers. Polymer analysis of proximity ligation data for hundreds of mRNA species demonstrates that nascent and pre-translational mammalian mRNAs are compacted by their associated proteins into linear rod-like structures.

Keywords: ChimeraTie; RIPPLiT; exon-junction complex; mRNA; mRNP structure; proximity ligation.


Figures

Figure 1.
Figure 1.. Overview of RIPPLiT and ChimeraTie.
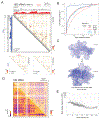
(A) Schematic for EJC RIPPLiT. Solid yellow and blue objects, EJC core proteins; gradient yellow and blue objects, antibody-conjugated beads; gray objects, non-EJC proteins; black and grey lines, RNA; red arrow, proximity ligation event. (B) Bioanalyzer trace showing length distribution of RNAs obtained from EJC RIPPLiT (replicate 1). Double-headed arrow, length distribution shift due to addition of ligase; gray box, sizes selected for sequencing. (C) Types of reads, fragments and chimeric junctions in RIPPLiT libraries, and their relationships to reference transcripts. (D) Schematic of ChimeraTie pipeline used to iteratively map fragments, extract pairwise chimeric junctions and then visualize junctions as a heatmap. Data shown are chimeric junctions (replicate 1 only) within the first 767 nts of PRPF8 mRNA. Thick gray line with arrowheads, coding exons; thinner section; 5' UTR. Arcs show individual chimeric junctions at nt resolution. Heatmap indicates number of junctions within each 10 × 10 nt pixel, with dotted lines indicating the heatmap position of one chimeric junction.
Figure 2.
Figure 2.. RIPPLiT captures intramolecular ligations in EJC-associated RNAs with high reproducibility.
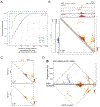
(A, B) Overlaid violin plots for (A) RIPPLiT (transcripts per million: TPM; replicate 1 − ligase) over RNA-seq (TPM; (Ge et al., 2016)) and (B) chimeric junction count (replicate 1 + ligase) over RNA-seq (TPM) for genes with one (purple) or more than one (gray) exon. Gray and purple horizontal lines: medians. Genes not detected by RNA-seq were omitted from (B). TPM values were obtained by mapping RIPPLiT − ligase and RNA-seq libraries to human genome GRCH37 with RSEM; chimeric junction counts were obtained by mapping RIPPLiT − and + ligase libraries to the HEK293 transcriptome with ChimeraTie. (C) Scatter plot comparing RIPPLiT chimeric junction counts to RNA-seq TPM. (D) Cumulative frequency distributions of inline and inverted chimeric junction spans for replicate 1 − and + ligase. Inset table: Raw junction counts. (E) Scatter plots comparing normalized intramolecular chimeric junction counts per transcript in + ligase libraries among biological replicates. Diagonal line: x=y. Red dots: set of transcripts used for scaling plots in Figure 6.
Figure 3.
Figure 3.. Ligations in 18S RNA occur between 3D-proximal regions.
(A) Chimeric junction heatmaps for human 18S rRNA − (lower left) and + ligase (upper right). Color scales, number of junctions per 5×5 nt bin; numbers in lower left corners, number of chimeric junctions obtained per indicated library. Replicate 1 coverage tracks show fragment distributions (red and blue) across the entire transcript and chimeric junction frequencies (black) at individual nucleotides. Note large scale differences for − and + ligase chimeric junction tracks. (B) Cumulative frequency distributions of inline and inverted chimeric junction spans on 18S rRNA for − and + ligase libraries (replicate 1). Inset table: Number of inline and inverted chimeric junctions for each library. (C) Structure of 18S rRNA (4UG0 (Khatter et al., 2015)) showing the two chimeric junctions marked with red and black arrows in (A) mapped onto the structure as lines. (D) Heatmaps for mean Euclidean phosphate-phosphate distances (bottom) overlaid with chimeric junctions (top). White areas: regions absent from structure. (E) Scatter plot showing mean ligation frequency in replicate 1 as a function of mean Euclidian distance for 1,000 bins each containing 79-80 chimeric junctions. Black line shows smoothing (GAM: generalized additive model) with grey area displaying confidence interval (0.95) around smoothing.
Figure 4.
Figure 4.. RIPPLiT captures higher-order structure of XIST.
(A) Cumulative distribution of unique intramolecular and intermolecular chimeric junctions per RNA Pol II transcript. XIST and UBR4 marked for reference. (B) Chimeric junction heatmaps for XIST (replicate 1). Red, blue and black coverage tracks as in Figure 3A. Topmost coverage track (tan) displays short EJC footprint coverage obtained from EJC RIPiT experiments (Singh et al., 2012), with pink lines indicating exon-exon junctions. Tick marks along diagonal gray bar, RefSeq-annotated exon-exon junctions in XIST. Prominent isolated chimeric junctions within the last exon in both − and + ligase heatmaps are due to unannotated minor alternative splice forms. Black arrows, long range interactions within the first and the last exon. (C) XIST chimeric junction heatmaps for replicates 2 and 3. (D) PARIS (Lu et al., 2016) Duplex Groups (DGs) overlaid with XIST RIPPLiT. Numbers in parentheses, number of junctions obtained in each dataset.
Figure 5.
Figure 5.. RIPPLiT captures higher-order structure of spliced Pol II transcripts.
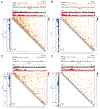
(A-D) Chimeric junction heatmaps for spliced mRNPs. All as in Figure 4B except that thicker and thinner sections of diagonal gray bar a coding exons and UTRs, respectively.
Figure 6.
Figure 6.. Within mRNPs, mRNAs are densely packed into linearly organized flexible rods.
(A) Normalized metagene heatmaps (see text) for transcripts of indicated length ranges. Color scale: Normalized mean chimeric junction frequency per pixel. (B) Expected scaling plots for different polymer types when contact probability, P(s) (equivalent to ligation frequency), is plotted against ligation span (distance in number of monomers constituting the polymer) on log-log axes. EG, equilibrium globule; RC, random coil; FG, fractal globule (top). (C) Expected scaling plots for different polymer shapes when P(s) is plotted against fraction of maximum span on log-log axes. Disc: globular polymer; Bar: rigid rod-like polymer; Worm: flexible rod-like polymer. (D) Mean observed scaling plot for 456 transcripts (grey lines) with more than 100 chimeric junctions in at least one biological replicate. Data from all replicates were combined and mean ligation frequency plotted as a function of distance in nucleotides on log-log axes. Each color represents a transcript (exemplifying different lengths) shown in Figure 5 and Figure S5A. Black line indicates a slope of -1. (E) Mean observed scaling plot for each length group shown in Figure 6A with all replicates combined. Vertical dotted lines indicate approximate boundaries for exponent changes. (F) Model of rod-like mRNP, with EJCs and other mRNP proteins protecting large RNA regions from nuclease digestion.

Comment in

References

    1. Adivarahan S, Rahman S, and Zenklusen D (2017). Spatial organization of single mRNPs at different stages of the gene expression pathway. bioRxiv. - PMC - PubMed
    1. Andersen CB, Ballut L, Johansen JS, Chamieh H, Nielsen KH, Oliveira CL, Pedersen JS, Seraphin B, Le Hir H, and Andersen GR (2006). Structure of the exon junction core complex with a trapped DEAD-box ATPase bound to RNA. Science 313, 1968–1972. - PubMed
    1. Archer SK, Shirokikh NE, Hallwirth CV, Beilharz TH, and Preiss T (2015). Probing the closed-loop model of mRNA translation in living cells. RNA Biol 12, 248–254. - PMC - PubMed
    1. Aw JG, Shen Y, Wilm A, Sun M, Lim XN, Boon KL, Tapsin S, Chan YS, Tan CP, Sim AY, et al. (2016). In Vivo Mapping of Eukaryotic RNA Interactomes Reveals Principles of Higher-Order Organization and Regulation. Mol Cell 62, 603–617. - PubMed
    1. Batisse J, Batisse C, Budd A, Bottcher B, and Hurt E (2009). Purification of nuclear poly(A)-binding protein Nab2 reveals association with the yeast transcriptome and a messenger ribonucleoprotein core structure. J Biol Chem 284, 34911–34917. - PMC - PubMed

Publication types