

Watershed Land Use and Seasonal Variation Constrain the Influence of Riparian Canopy Cover on Stream Ecosystem Metabolism
- PMID: 30416371
- PMCID: PMC6223136
- DOI: 10.1007/s10021-016-0040-9
Watershed Land Use and Seasonal Variation Constrain the Influence of Riparian Canopy Cover on Stream Ecosystem Metabolism
Abstract
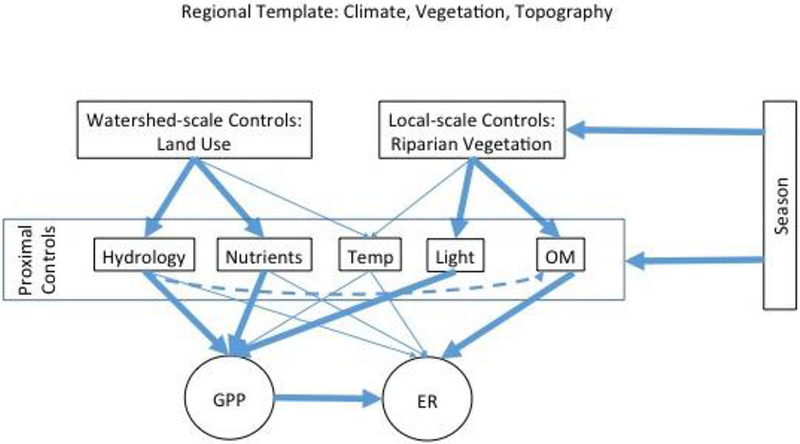
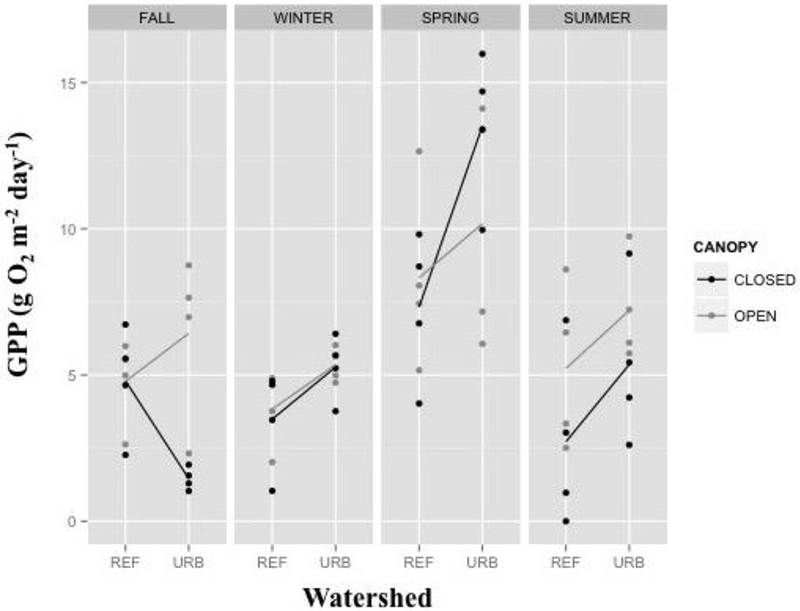
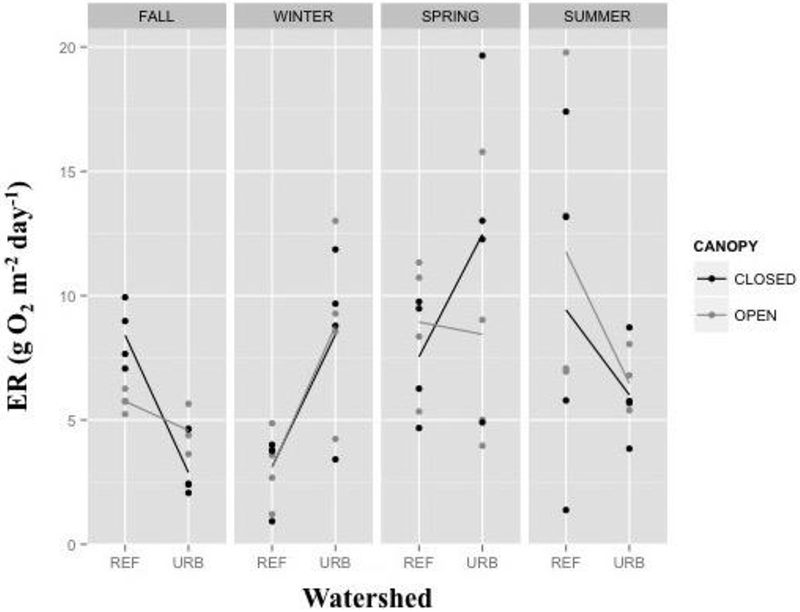
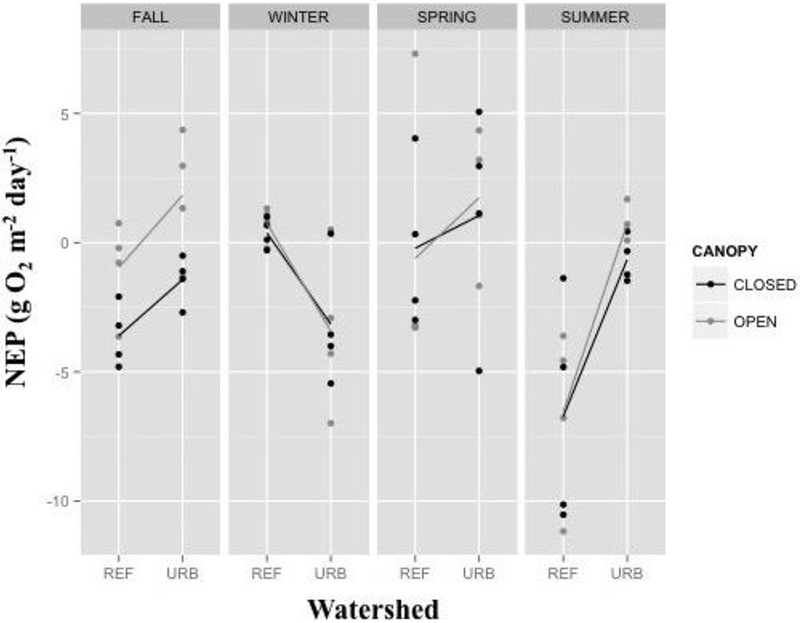
Ecosystem metabolism is an important determinant of trophic structure, nutrient cycling, and other critical ecosystem processes in streams. Whereas watershed- and local-scale controls on stream metabolism have been independently investigated, little is known about how controls exerted at different scales interact to determine stream metabolic rates, particularly in urban streams and across seasons. To address this knowledge gap, we measured ecosystem metabolism in four urban and four reference streams in northern Kentucky, USA, with paired closed and open riparian canopies, during each of the four seasons. Gross primary production (GPP), ecosystem respiration, and net ecosystem production (NEP) were all best predicted by models with season as a main effect, but interactions between season, canopy, and watershed varied for each response. Urban streams exhibited higher GPP during most seasons, likely due to elevated nutrient loads. Open canopy reaches in both urban and forested streams, supported higher rates of GPP than the closed canopy which reaches during the summer and fall, when the overhead vegetation shaded the closed reaches. The effect of canopy cover on GPP was similar among urban and forested streams. The combination of watershed and local-scale controls resulted in urban streams that alternated between net heterotrophy (NEP <0) and net autotrophy (NEP >0) at the reach-scale during seasons with dense canopy cover. This finding has management relevance because net production can lead to accumulation of algal biomass and associated issues like nighttime hypoxia. Our study suggests that although watershed urbanization fundamentally alters ecosystem function, the preservation and restoration of canopied riparian zones can provide an important management tool at the local scale, with the strongest impacts on stream metabolism during summer.
Keywords: ecosystem respiration (ER); gross primary production (GPP); phenology; riparian land cover; stream metabolism; urban streams.
Figures
References
-
- Acuna V, Giorgi A, Munoz I, Uehlinger U, Sabater S. 2004. Flow extremes and benthic organic matter shape the metabolism of a headwater Mediterranean stream. Freshwater Biology 49: 960–971.
-
- Allan JD. 2004. Landscapes and riverscapes: The influence of land use on stream ecosystems. Annual Review of Ecology Evolution and Systematics 35: 257–284.
-
- American Public Health Administration. 2005. Standard methods for the examination of water and wastewater. American Public Health Administration, Washington DC.
-
- Bates D, Maechler M. 2010. Lme4: Linear mixed-effects models using S4 classes. R package version 0.999375–37.
-
- Bailey RG. 1995. Description of the ecoregions of the United States. 2nd edition U.S. Department of Agriculture, Forest Service; Washington, D.C., U.S.A.
Grants and funding
LinkOut - more resources
Full Text Sources
Miscellaneous