. 2018 Oct 26:9:2386.
doi: 10.3389/fimmu.2018.02386. eCollection 2018.

Immunoproteasome Inhibition Impairs T and B Cell Activation by Restraining ERK Signaling and Proteostasis

Affiliations

Immunoproteasome Inhibition Impairs T and B Cell Activation by Restraining ERK Signaling and Proteostasis

Christian Schmidt et al. Front Immunol. .

Abstract

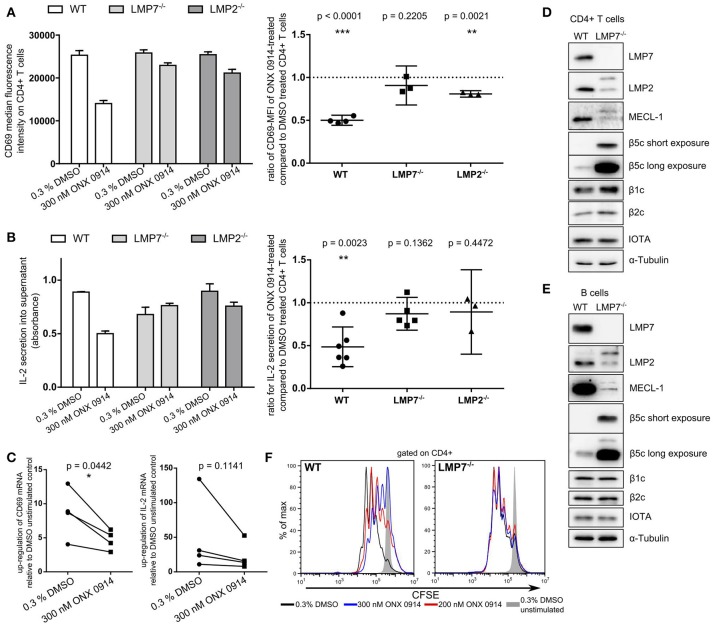
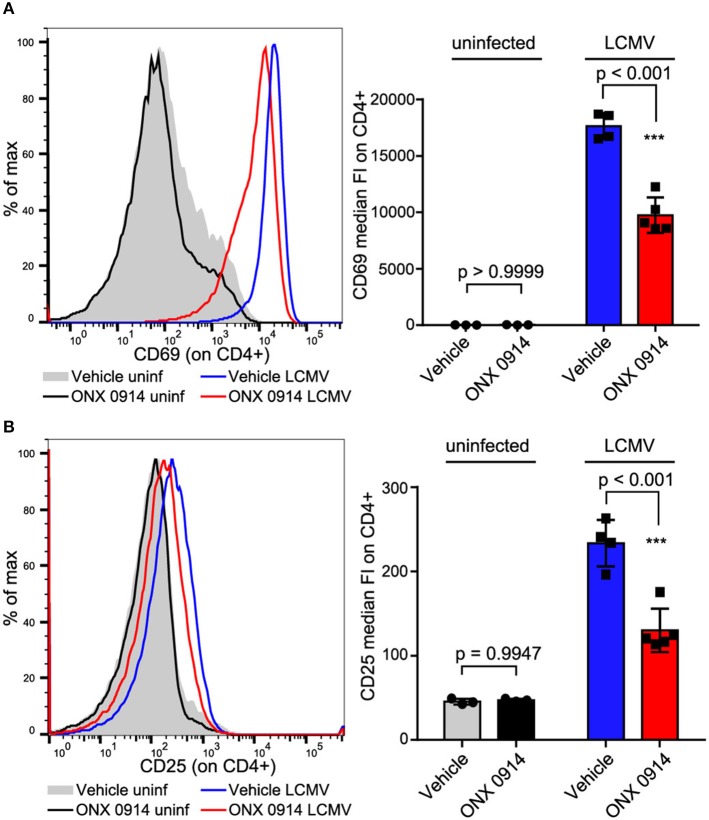
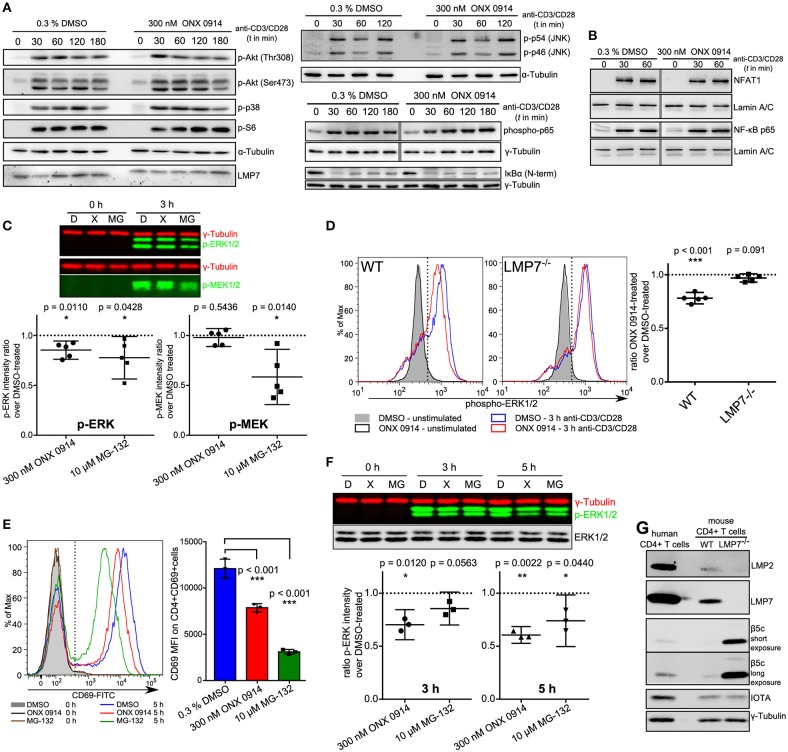
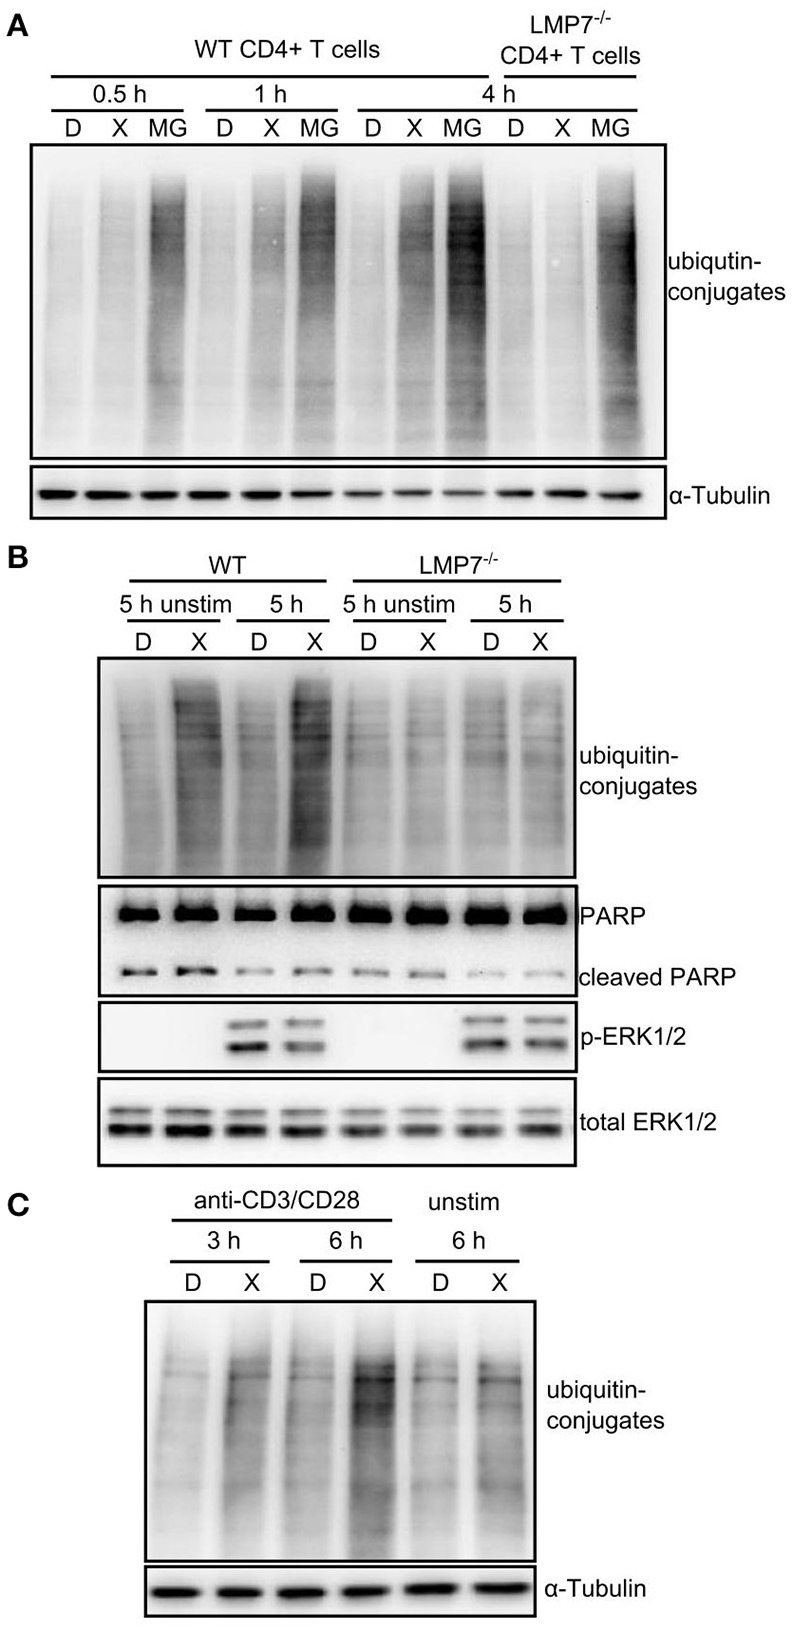
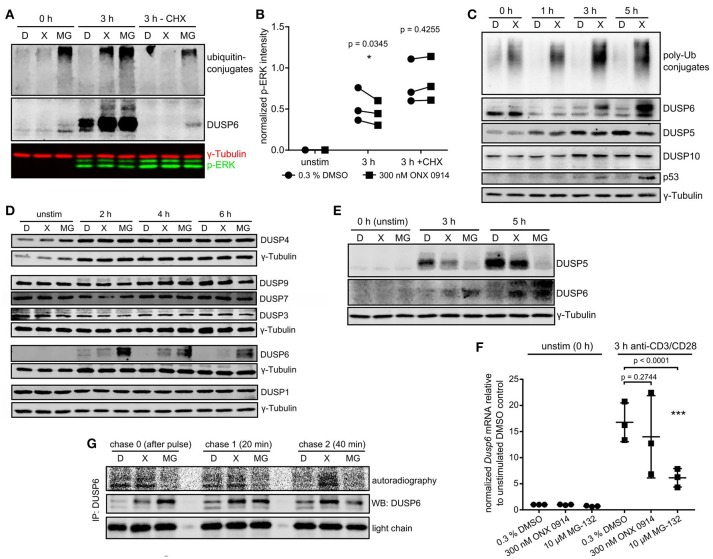
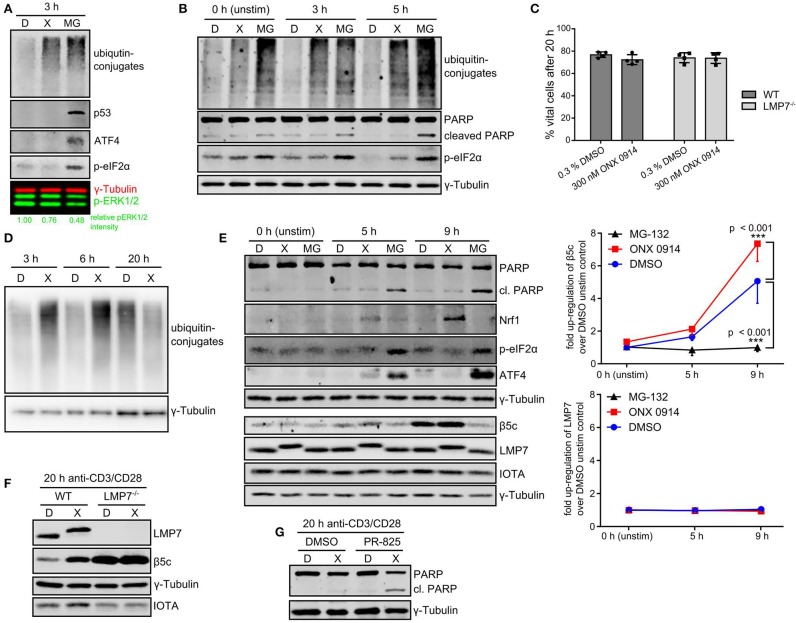
Immunoproteasome (IP) inhibition holds potential as a novel treatment option for various immune-mediated pathologies. The IP inhibitor ONX 0914 reduced T cell cytokine secretion and Th17 polarization and showed pre-clinical efficacy in a range of autoimmune disorders, transplant-allograft rejection, virus-mediated tissue damage, and colon cancer progression. However, the molecular basis of these effects has remained largely elusive. Here, we have analyzed the effects of ONX 0914 in primary human and mouse lymphocytes. ONX 0914-treatment impaired primary T cell activation in vitro and in vivo. IP inhibition reduced ERK-phosphorylation sustainment, while leaving NF-κB and other signaling pathways unaffected. Naïve T and B cells expressed nearly exclusively immuno- or mixed proteasomes but no standard proteasomes and IP inhibition but not IP-deficiency induced mild proteostasis stress, reduced DUSP5 expression and enhanced DUSP6 protein levels due to impaired degradation. However, accumulation of DUSP6 did not cause the reduced ERK-phosphorylation in a non-redundant manner. We show that broad-spectrum proteasome inhibition and immunoproteasome inhibition have distinct effects on T cell activation at the molecular level. Notably, ONX 0914-treated T cells recovered from proteostasis stress without apoptosis induction, apparently via Nrf1-mediated up-regulation of standard proteasomes. In contrast, B cells were more susceptible to apoptosis after ONX 0914-treatment. Our data thus provide mechanistic insights how IP inhibition functionally impedes T and B cells likely accounting for its therapeutic benefits.

Keywords: B cell activation; DUSP6; ERK; Nrf1; ONX 0914; T cell activation; immunoproteasome; proteostasis.


Figures

Figure 1
Figure 1
Immunoproteasome inhibition impairs T cell activation in an LMP7-/LMP2-co-dependent manner. (A) Purified naive T cells from WT, LMP7−/−, or LMP2−/− mice were pulse-treated with DMSO or ONX 0914 for 2 h prior to activation with plate-bound anti-CD3/anti-CD28 antibodies for 5 h. CD69 MFI was measured on CD4+ cells by flow cytometry. Bar graph shows one representative example. Right hand graphs show ratios of ONX 0914-treated/DMSO-treated means from independent reproduction as mean + 95% CI for each genotype, p-values of one-sample t-tests. Horizontal dashed line indicates μ0. (B) Quantification of IL-2 secretion by ELISA from supernatants of cells purified and treated as in A. One representative example (bar graph) and ratios of ONX 0914/DMSO treated of three or more independent experiments represented as in A. (C) Purified WT CD4+ T cells were pulse-treated as in A and activated for 4 h. Total RNA was extracted and retro-transcribed cDNA was subjected to q-RT PCR for Cd69 and Il-2 transcripts. Shown is the fold up-regulation over unstimulated controls normalized to Rpl13a. P-values of paired t-tests as indicated. (D,E) Purified naive CD4+ T cells (D) or CD19+ B cells (E) were subjected to analysis of (immuno-) proteasome subunit protein expression by immunoblotting. One example each of three independent experiments are shown, α-tubulin and proteasome subunit α1 (IOTA) were used as loading controls. (F) CFSE-dilution profile of WT or LMP7−/− derived CD4+ T cells after 72 h of activation with plate-bound antibodies in presence or absence of indicated ONX 0914 concentrations.
Figure 2
Figure 2
In vivo activated CD4+ T cells are impaired by ONX 0914. (A,B) SMARTA mice were treated with 10 mg/kg ONX 0914 or vehicle s.c. 2 h before i.v. infection with 4 × 10⁵ pfu LCMV or left uninfected. 18 h after infection, splenocytes were subjected to flow cytometry to assess CD69 and CD25 up-regulation on CD4+ T cells. Histograms show one representative profile of a mouse from each group. Bar graphs show pooled data from MFI quantifications (mean ± SD). Two-way ANOVA, Sidak's post-test, p-values as indicated in the figure; n = 3 for uninfected controls, n = 4 or 5 mice for infected group.
Figure 3
Figure 3
ONX 0914 reduces ERK-phosphorylation sustainment while leaving most canonical signaling pathways unaffected. (A) Immunoblot analysis with whole cell lysates for indicated (phospho-)proteins in expanded CD4+ T cells after pulse-treatment with ONX 0914 or DMSO for 2 h, followed by activation with plate-bound anti-CD3/anti-CD28 antibodies for indicated time periods. Representative blots of three independent experiments are shown. Alpha-tubulin was used as control. Vertical gray line indicates signals from the same membrane and detection, but not originally juxtaposed. (B) Immunoblots of p65 and NFAT with nuclear fractions of cell lysates after activation of cells treated as in A. Lamin was used as a loading control. Vertical gray line indicates signals from same membrane, but not originally juxtaposed. (C) Cells treated as in A were lysed and used for near-IR immunoblotting against indicated proteins (top: representative example). Intensities of p-ERK and p-MEK relative to tubulin loading control at 3 h were quantified in five independent experiments. Graphs below show mean + 95% CI. Ratios of ONX 0914-treated/DMSO-treated signals were analyzed with one-sample t-test, μ0 = 1, p-values as indicated in the figure. (D) MACS-enriched splenic CD4+ T cells from WT or LMP7−/− mice were 2 h pulse-treated with DMSO or ONX 0914 and activated for 3 h with plate-bound anti-CD3/anti-CD28 antibodies or left unstimulated. Intracellular p-ERK1/2 levels were measured using flow cytometry on CD4+ p-ERK+ cells. Histograms (left) show one representative example of five independent experiments. Phospho-ERK+ median fluorescence intensity ratios of ONX 0914-treated/DMSO-treated cells from five independent experiments are shown as mean + 95% CI in the right hand graphs. One-sample t-test with μ0 = 1, p-values as indicated. (E) MACS-enriched human CD4+ T cells were pulse-treated with DMSO or ONX 0914 or continuously treated with MG-132 and activated with stimulating beads for 5 h. CD69 expression on CD4+ CD69+ cells was measured by flow cytometry and median fluorescence intensities used for quantification. Representative histogram (left) and quantification with pooled data of three independent experiments (right) are shown (mean ± SD); two-way repeated measures ANOVA, Sidak's post-test, p-values as indicated. (F) Cells treated as in E were lysed and used for near-IR detection of p-ERK1/2 intensities normalized to γ-tubulin after 3 and 5 h of activation. Top: Representative immunoblot, graph below: Ratio of ONX 0914-treated/DMSO-treated signals from three independent experiments (mean with 95% CI) was analyzed with one-sample t-test, μ0 = 1, p-values are indicated. (G) Immunoblot analysis of murine CD4+ T cells from WT or LMP7−/− mice compared with purified human CD4+ T cells. One example out of three similar experiments is presented.
Figure 4
Figure 4
Immunoproteasome inhibition induces mild proteostasis stress in activated CD4+ T cells. (A) Expanded CD4+ T cells from WT or LMP7-deficient mice were pulse-treated for 2 h with 0.3% DMSO (D) or 300 nM ONX 0914 (X) or continuously treated with 10 μM MG-132 (MG) and consequently activated with plate-bound anti-CD3/anti-CD28 antibodies for the indicated time periods. Immunoblot analysis of ubiquitin conjugates with α-tubulin as loading control is shown. A representative example of at least three experiments with similar outcome is displayed. (B) Primary MACS-enriched naive CD4+ T cells from WT or LMP7-deficient mice were pulse-treated for 2 h with 0.3% DMSO (D) or 300 nM ONX 0914 (X) and activated with plate-bound anti-CD3/anti-CD28 antibodies or left unstimulated for 5 h. Immunoblot analyses against indicated proteins with total ERK as loading control are displayed. One example of at least three experiments with similar outcome is presented. (C) Expanded CD4+ T cells from WT mice were pulse-treated for 2 h with 0.3% DMSO (D) or 300 nM ONX 0914 (X) and activated with plate-bound anti-CD3/anti-CD28 antibodies for indicated time periods or were left unstimulated. Immunoblot analysis for ubiquitin-conjugates with α-tubulin serving as loading control. One example of at least three experiments with similar outcome is shown.
Figure 5
Figure 5
Immunoproteasome inhibition dysregulates DUSP5 and DUSP6 in T cells. (A) Expanded murine CD4+ T cells were pulse treated with 0.3% DMSO (D) or 300 nM ONX 0914 (X) or continuously treated with 10 μM MG-132 (MG) before activation with plate-bound anti-CD3/anti-CD28 antibodies for 3 h in the presence or absence of cycloheximide (CHX). Shown are immunoblots for ubiquitin and DUSP6 employing γ-tubulin as loading control. One example of three independent experiments is shown. (B) Quantification of p-ERK intensities normalized to γ-tubulin from three independent experiments performed as in A. Paired t-test, p-values as indicated. (C) MACS-enriched naive murine CD4+ T cells from WT mice were pulse-treated with 0.3% DMSO (D) or 300 nM ONX 0914 (X) for 2 h before activation with anti-CD3/anti-CD28 antibodies. Cells were lysed after indicated times and immunoblots performed as indicated. One example of at least three similar experiments. (D) Expanded murine CD4+ T cells were pulse-treated with 0.3% DMSO (D) or 300 nM ONX 0914 (X) or continuously treated with 10 μM MG-132 (MG) before activation with plate-bound anti-CD3/anti-CD28 antibodies for indicated time periods. Immunoblots were performed with indicated antibodies. One example of three or more independent reproductions is shown. (E) One example of three independent reproductions of the experiment as in C, but with primary human CD4+ T cells from healthy donors and continuous MG-132 treatment (10 μM) in addition. (F) Expanded murine CD4+ T cells treated as in D were used for RNA extraction and q-RT-PCR against Dusp6 after 3 h of activation. Fold change of Dusp6 mRNA (normalized to Rpl13 and Ipo8) over unstimulated DMSO control. Pooled data from three independent experiments. Two way ANOVA, Sidak's post test, p-values as indicated. (G) T1 cells were treated with 200 U/ml IFN-γ for 3 days to induce higher immunoproteasome content. Cells were then pulse-treated for 2 h with DMSO, ONX 0914, or MG-132 as in C. Consequently, cells were activated with plate-bound anti-CD3/CD28 antibodies in RPMI 1640 +supplements. After 1–2 h the cells were starved in methionine/cysteine-free RPMI 1640 for 1 h, followed by a 15 min radioactive pulse of 35S-cys/met in RPMI 1640 at 250 μCi/ml. Cells were washed and lysed directly after (chase 0) as well as 20 and 40 min after the pulse. Lysates were loaded for an anti-DUSP6-IP according to β-count CPM. After 6 h of IP and washing, the radioactive signal of newly synthesized DUSP6 was detected with a phosphoimager. Total DUSP6 in the IP and the antibody light chain were used as loading controls. One example of three experiments with similar outcome is displayed.
Figure 6
Figure 6
T cells alleviate IP-inhibition-induced proteostasis stress without induction of apoptosis. (A) Expanded murine CD4+ T cells were pulse treated with 0.3% DMSO (D) or 300 nM ONX 0914 (X) or continuously treated with 10 μM MG-132 (MG) before activation with plate-bound anti-CD3/anti-CD28 antibodies for 3 h. Immunoblot analysis of indicated proteins with γ-tubulin as loading control and phosphorylated ERK1/2 as activation control was performed. Numbers below show quantification of normalized p-ERK as in Figure 3C. One example of three independent experiments is displayed. (B) Primary human CD4+ T cells purified from PBMCs of voluntary healthy donors were pre-treated as in A and stimulated with antibody-coated beads against CD3/CD28/CD2 (Miltenyi human T cell activation kit) for indicated time periods. Immunoblot analysis was performed for indicated proteins. γ-Tublin served as loading control. One example out of three independent experiments is shown. (C) Naive T cells isolated from either WT or LMP7-deficient mice were pulse-treated for 2 h with 0.3% DMSO (D) or 300 nM ONX 0914 (X) and activated with plate-bound antibodies against CD3/CD28 for 20 h. The percentage of vital cells was assessed using AO/PI staining in a Cellometer 2000. Pooled data from four independent experiments is displayed. (D) Cells treated as in C were harvested after 3, 6, or 20 h. Immunoblot analysis against ubiquitin-conjugates is shown with γ-tubulin as loading control. One example of at least three experiments with similar outcome is shown. (E) Cells treated as in C (with continuous MG-132-treatment in addition) were lysed after indicated time periods. Immunoblots against indicated proteins with γ-tubulin as loading control are shown. One example out of three independent experiments is shown. Quantification of normalized β5c and LMP7 intensities from three independent experiments is shown in the right hand graph (mean + SD for each time point). (F) Cells treated as in C were harvested after 20 h. Immunoblot analysis against indicated proteins with γ-tubulin as loading control and IOTA as total proteasome control is presented. One representative example of at least three independent experiments is shown. (G) WT CD4+ T cells treated as in C were activated and PR-825 was added to 100 nM final concentration after 4 h. Cells were harvested 20 h after activation and immunoblots performed as indicated. One example out of three experiments is shown.

Similar articles

Cited by

References

    1. Khan S, van den Broek M, Schwarz K, de Giuli R, Diener PA, Groettrup M. Immunoproteasomes largely replace constitutive proteasomes during an antiviral and antibacterial immune response in the liver. J Immunol. (2001) 167:6859–68. 10.4049/jimmunol.167.12.6859 - DOI - PubMed
    1. Kuckelkorn U, Frentzel S, Kraft R, Kostka S, Groettrup M, Kloetzel PM. Incorporation of major histocompatibility complex–encoded subunits LMP2 and LMP7 changes the quality of the 20S proteasome polypeptide processing products independent of interferon-gamma. Eur J Immunol. (1995) 25:2605–11. 10.1002/eji.1830250930 - DOI - PubMed
    1. Stohwasser R, Standera S, Peters I, Kloetzel PM, Groettrup M. Molecular cloning of the mouse proteasome subunits MC14 and MECL-1: reciprocally regulated tissue expression of interferon-γ-modulated proteasome subunits. Eur J Immunol. (1997) 27:1182–7. 10.1002/eji.1830270520 - DOI - PubMed
    1. Frentzel S, Kuhn-Hartmann I, Gernold M, Gött P, Seelig A, Kloetzel PM. The major-histocompatibility-complex-encoded beta-type proteasome subunits LMP2 and LMP7. Evidence that LMP2 and LMP7 are synthesized as proproteins and that cellular levels of both mRNA and LMP-containing 20S proteasomes are differentially regulated. Eur J Biochem. (1993) 216:119–26. 10.1111/j.1432-1033.1993.tb18123.x - DOI - PubMed
    1. Driscoll J, Brown MG, Finley D, Monaco JJ. MHC-linked LMP gene products specifically alter peptidase activities of the proteasome. Nature (1993) 365:262–4. 10.1038/365262a0 - DOI - PubMed

Publication types

MeSH terms