. 2018 Oct 25:4:52.
doi: 10.1038/s41420-018-0115-9. eCollection 2018.

Autophagy modulates temozolomide-induced cell death in alveolar Rhabdomyosarcoma cells

Affiliations

Autophagy modulates temozolomide-induced cell death in alveolar Rhabdomyosarcoma cells

Adel Rezaei Moghadam et al. Cell Death Discov. .

Erratum in

Abstract

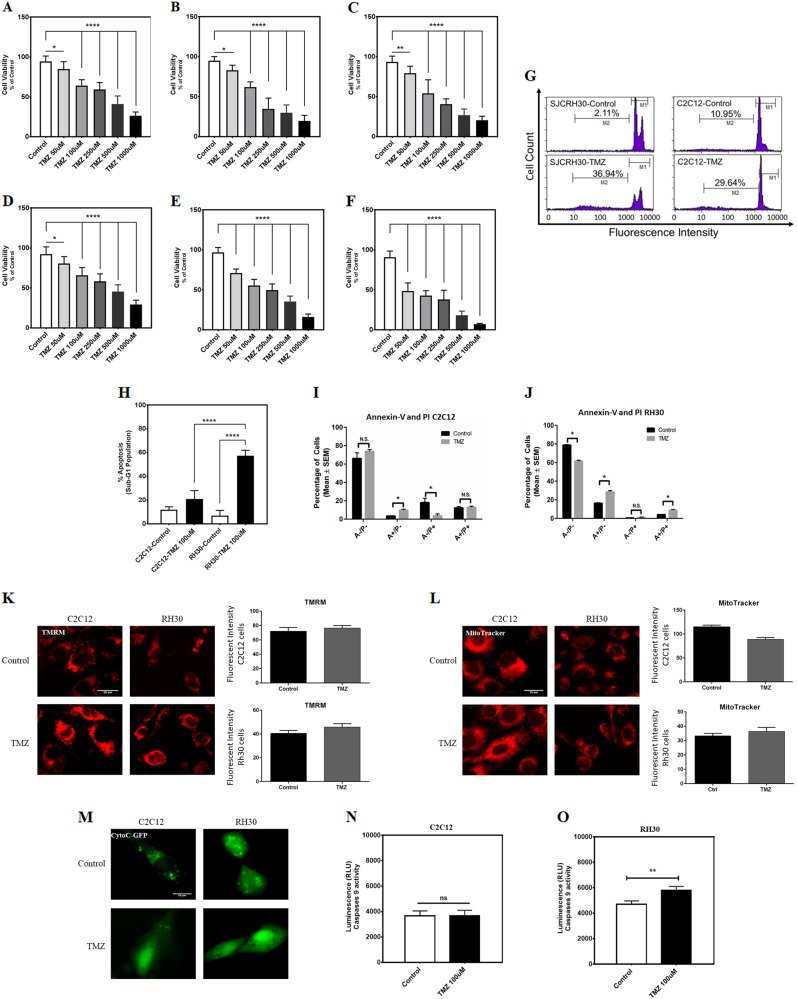
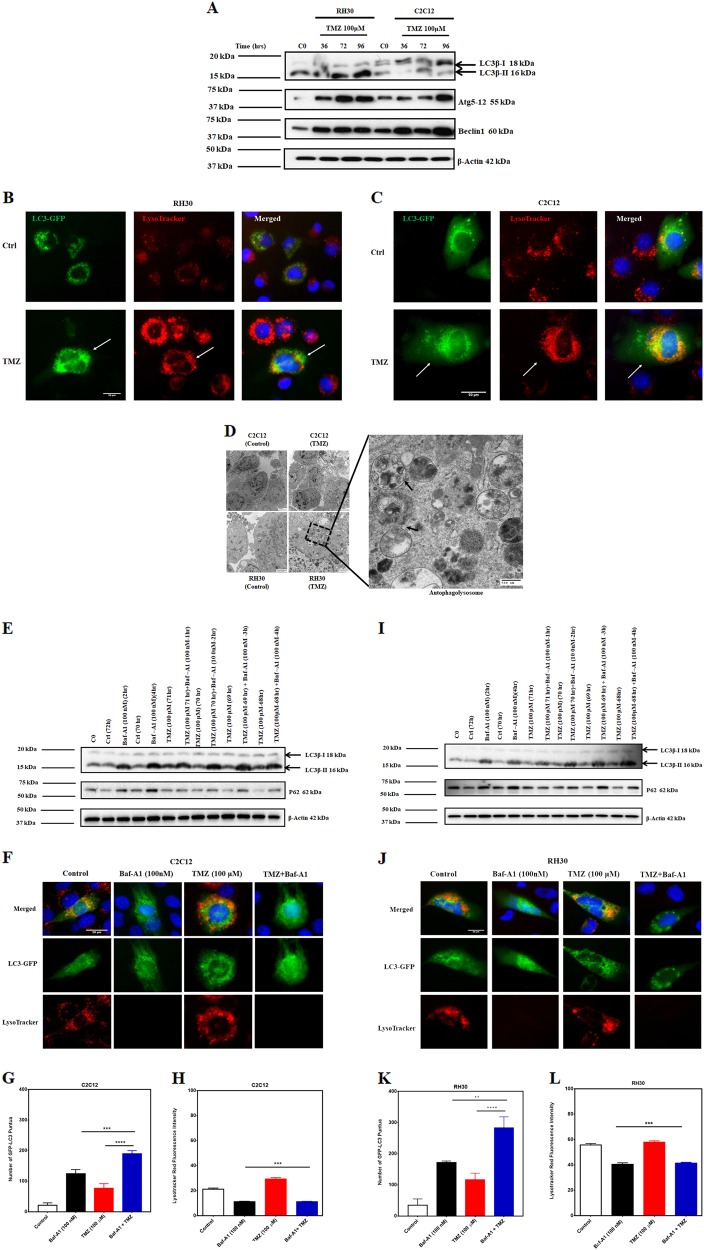
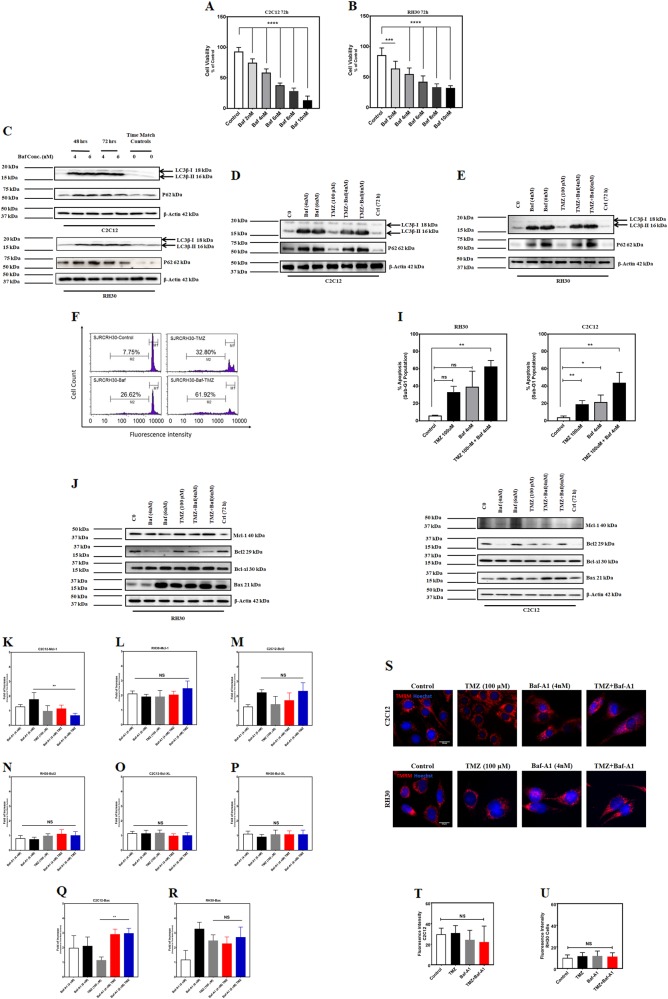
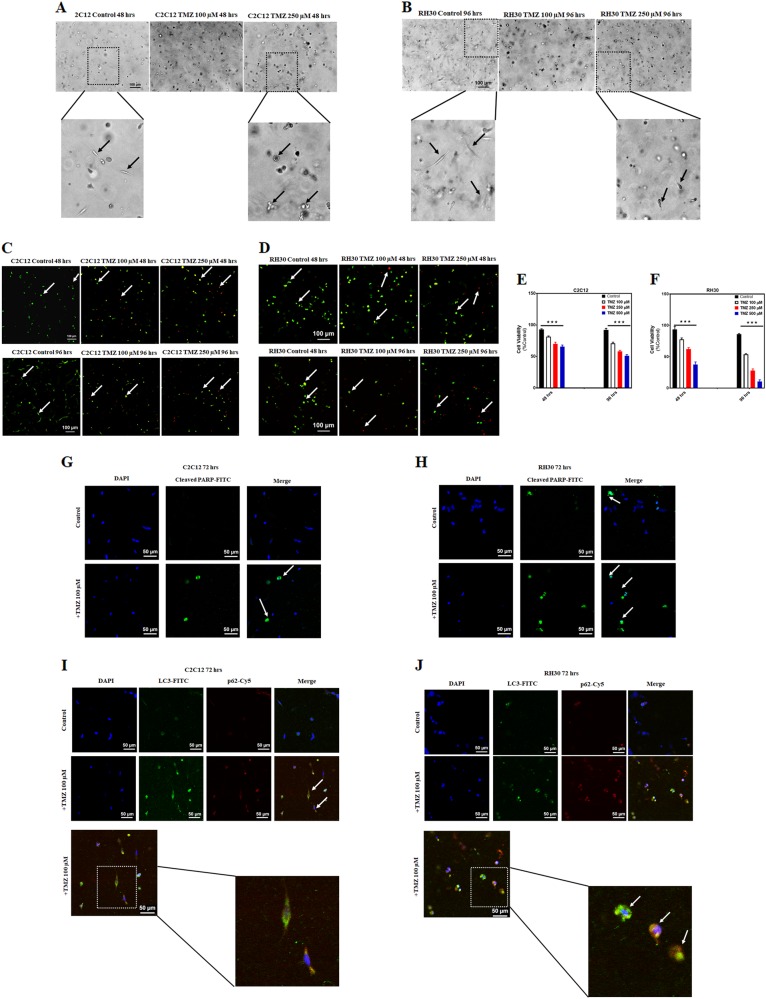
Rhabdomyosarcoma (RMS) is a muscle-derived tumor. In both pre-clinical and clinical studies Temozolomide (TMZ) has been recently tested against RMS; however, the precise mechanism of action of TMZ in RMS remains unclear. Here we demonstrate that TMZ decreases the cell viability of the RH30 RMS and C2C12 cell line, where cells display evidence of mitochondrial outer membrane permeability. Interestingly, the C2C12 mouse myoblast line was relatively more resistant to TMZ-induced apoptosis. Moreover, we observed that TMZ activated biochemical and morphological markers of autophagy in both cell lines. Autophagy inhibition in both RH30 and C2C12 cells significantly increased TMZ-induced cell death. In RH30 cells, TMZ increased Mcl-1 and Bax protein expression compared to corresponding time match controls while in C2C12 Mcl-1, Bcl-2, Bcl-XL, and Bax protein expression were not changed. Baf-A1 co-treatment with TMZ significantly decrease Mcl-1 expression compared to TMZ while increase Bax expression in C2C12 cells (Bcl2 and Bcl-XL do not significantly change in Baf-A1/TMZ co-treatment). Using a three-dimensional (3D) C2C12 and RH30 culture model we demonstrated that TMZ is significantly more toxic in RH30 cells (live/dead assay). Additionally, we have observed in our 3D culture model that TMZ induced both apoptosis (cleavage of PARP) and autophagy (LC3-puncta and localization of LC3/p62). Therefore, our data demonstrate that TMZ induces simultaneous autophagy and apoptosis in both RH30 and C2C12 cells in 2D and 3D culture model, where RH30 cells are more sensitive to TMZ-induced death. Furthermore, autophagy serves to protect RH30 cells from TMZ-induced death.


Conflict of interest statement

The authors declare that they have no conflict of interest.

Figures

Fig. 1
Fig. 1. TMZ induces apoptotic cell death in C2C12 and RH30 cell lines.
ac C2C12 cells were treated with TMZ (50, 100, 250, and 1000 μM) and cell viability was assessed 48, 72, and 96 h after that by MTT assay. Control cells for each time point were treated with the solvent control (DMSO). Results are expressed as a percentage of corresponding time point control and represent the means ± SD of 15 replicates in three independent experiments (**P < 0.01; ***P < 0.0001). df C2C12 cells were treated TMZ (50, 100, 250, and 1000 μM) and cell viability was assessed 48, 72, and 96 h after that by MTT assay. Control cells for each time point were treated with the solvent control (DMSO). Results are expressed as a percentage of corresponding time point control and represent the means ± SD of 15 replicates in three independent experiments (**P < 0.01; ****P < 0.0001). g Representative figures of the flow cytometry histogram for C2C12 and RH30 are shown. Cells were treated with TMZ (100 μM, 72 h) and Percent sub-G1 abundance induced by TMZ (100 μM) or DMSO solvent control after 72 h. The Sub-G1 population showed an abundance of apoptotic cell death in each treatment. h The average of the sub-G1 population of C2C12 and RH30 cells which were treated with TMZ (100 μM, 72 h) and DMSO solvent control has been measured. Results represent the means ± SD of six replicates in three independent experiments (****P < 0.0001). i, j C2C12 and RH30 cells were treated with TMZ and stained with Annexin-V-FITC (A) and PI (P) and analyzed by flow cytometry (n = 3)(*P < 0.05). k TMRM staining of C2C12 and RH30 cells treated with TMZ (100 μM, 48 h). l MitoTracker staining of C2C12 and RH30 cells treated with TMZ (100 μM, 48 h). m C2C12 and RH30 cells were transfected with cytochrome C-GFP (CytoC-GFP) and treated with TMZ (100 μM, 48 h)(*P < 0.05). n, o C2C12 and RH30 cells were treated with 100 μM TMZ for 48 h and then Caspase-9 activity was measured using Caspase-Glo luminescence assay. (**P < 0.01)
Fig. 2
Fig. 2. TMZ induces autophagy in C2C12 and RH30 cell lines.
a C2C12 and RH30 cells were treated with TMZ (100 μM, 36, 72, 96 h) and autophagy hallmark was detected in both C2C12 and RH30 cell lines using immunoblotting. TMZ-induced LC3β lipidation, Atg5-12 conjugation, and Beclin-1 expression in both cell lines. Beta-actin was used as loading control. Data are representative of three independent experiments using different cultures. b, c RH30 and C2C12 cells were treated with TMZ (100 μM, 72 h) and using immunocytochemistry LC3 puncta and changes in lysosomal activity (LysoTracker red staining) has been investigated. The results showed that TMZ increased LC3 puncta and LysoTracker red fluorescence intensity and co-localization of LC3 puncta and LysoTracker in both RH30 and C2C12 cells. d Transmission electron microscopy showed that in treated RH30 and C2C12 cells there are accumulated autophagosome-like structures compared to control and normal cells after 72 h treatment. Arrows show the autophagolysosomes containing the cargo (magnification ×11,600). e C2C12 cells were treated with TMZ (100 µM, 72 h) and then treated with Baf-A1 (100 nM, 1, 2, 3, 4 h) to evaluate for autophagy flux. TMZ + Baf-A1 treatment induces more lipidated LC3β and reduces the degradation of p62 in RH30 cells. Beta-actin was used as the loading control. Data are representative of three independent experiments. f C2C12 cells were treated with TMZ (100 μM, 72 h) and Baf-A1 (100 nM, +4 h) followed by immunocytochemistry to evaluate LC3 puncta and changes in lysosomal activity (LysoTracker red staining). The results showed that TMZ increased LC3 puncta and LysoTracker red fluorescence intensity in C2C12 cells. On the other hand, Baf-A1 and TMZ + Baf-A1 significantly decreased the LysoTracker red fluorescence in the presence of an accumulation of LC3 puncta showing the inhibition of autophagy flux by Baf-A1. g, h Representative figures of LC3 puncta and fluorescence intensity for LysoTracker in C2C12 cells in the presence of TMZ, Baf-A1, and TMZ/Baf-A1 treatment. These results showed that the number of LC3 puncta is significantly higher in cells which are treated with Baf-A1 and TMZ + Baf-A1. However, the fluorescence intensity of LysoTracker was lower in Baf-A1, and TMZ + Baf-A1 treated cells. i RH30 cells were treated with TMZ (100 µM, 72 h) and then treated with Baf-A1 (100 nM, 1, 2, 3, 4 h) to evaluate for autophagy flux. TMZ/Baf-A1 treatment induces more LC3β lipidation and reduces the degradation of p62 in RH30 cells compared to TMZ and Baf-A1 single treatment. Beta-actin was used as the loading control. Data are representative of three independent experiments. j RH30 cells were treated with TMZ (100 μM, 72 h) and Baf-A1 (100 nM, +4 h) followed by immunocytochemistry to evaluate LC3 puncta and changes in lysosomal activity (LysoTracker red staining). The results showed that TMZ increased LC3 puncta and LysoTracker fluorescence intensity in RH30 cells. On the other hand, Baf-A1 and TMZ + Baf-A1 significantly decreased the LysoTracker red fluorescence showing the inhibition of autophagy by Baf-A1. k, l Representative figures of LC3 puncta and fluorescence intensity for LysoTracker in RH30 cells in the presence of TMZ, Baf-A1, and TMZ/Baf-A1 treatment. These results showed that many LC3 puncta are significantly higher in cells which are treated with Baf-A1 and TMZ + Baf-A1. However, the fluorescence intensity of LysoTracker was lower in Baf-A1, and TMZ + Baf-A1 treated cells
Fig. 3
Fig. 3. Autophagy inhibition increases TMZ-induced apoptosis in C2C12 and RH30 cells.
a, b C2C12 and RH30 cells were treated with Baf-A1 (2, 4, 6, 8, and 10 nM) and cell viability was assessed after 72 h using MTT assay. Control cells for each time point were treated with the solvent control (DMSO). Results are expressed as a percentage of corresponding time point control and represent the means ± SD of 15 replicates in three independent experiments (**P < 0.01; ***P < 0.0001). c C2C12 and RH30 cells were treated with Baf-A1 (4 and 6 nM, 48, 72 h) and autophagy hallmark proteins were detected in both C2C12 and RH30 cell lines using immunoblotting. Baf-A1 induces accumulation of lipidated LC3β and decreases the degradation of p62 in both cell lines. Beta-actin was used as loading control. Data are representative of three independent experiments using different cultures. d, e C2C12 and RH30 cells were treated with TMZ (100 µM, 72 h) and then treated with Baf-A1 (4, 6 nM, 72 h) to evaluate autophagy inhibition in the presence of Baf-A1 treatment. TMZ + Baf-A1 treatment induces LC3β lipidation and reduces the degradation of p62 in C2C12 and RH30 cells. Beta-actin was used as the loading control. Data are representative of three independent experiments. fh Representative figures of the flow cytometry histogram for RH30 are shown. Cells were treated with TMZ (100 μM, 72 h), Baf-A1 (4 nM, 72 h) and Baf-A1/TMZ. Percentage of sub-G1 abundance induced by TMZ (100 μM, 72 h), Baf-A1 (4 nM, 72 h) and Baf-A1/TMZ after 72 h has been showed. The Sub-G1 population showed an abundance of apoptotic cell death in each treatment. g, h C2C12 and RH30 cells were treated with TMZ (100 µM, 72 h) and Baf-A1 (4 nM, 72 h) and then cell lysates were collected to examine the effect of TMZ, Baf-A1, and TMZ/Baf-A treatment on expression of Bcl2 family proteins (Bcl-2, Bcl-XL, Mcl-1, and Bax). kr, k, l TMZ does not significantly change Mcl-1 expression in both C2C12 and RH30 cells. It is notable that Baf-A1 (6 nM)/TMZ co-treatment significantly (P < 0.01) decrease Mcl-1 expression in C2C12 cells while does not have any effect in RH30 cells. m, n TMZ does not significantly change Bcl-2 expression in both C2C12 and RH30 cells. TMZ/Baf-A combination treatment also does not significantly change Bcl-XL expression in both C2C12 and RH30 cells. o, p TMZ does not significantly change Bcl-XL expression in both C2C12 and RH30 cells. TMZ/Baf-A combination treatment also does not significantly change Bcl-2 expression in both C2C12 and RH30 cells. q, r TMZ does not significantly change Bax expression in both C2C12 and RH30 cells. TMZ/Baf-A combination treatment significantly increase Bax-expression in C2C12 cells (P < 0.01) while does not have a significant effect on its expression in RH30 cells. su We have evaluated changes in mitochondrial membrane potential in the presence of TMZ (100 µM, 60 h), Baf-A1 (4 nM, 60 h), and TMZ/Baf-A1 combination in C2C12 and RH30 cells. s Representative images show the mitochondrial membrane potential measured by TMRM. Red color denotes TMRM staining. t, u Measurement of the mean of TMRM fluorescence intensity shows that TMZ (100 µM, 60 h), Baf-A1 (4 nM, 60 h), and TMZ/Baf-A1 combination does not change mitochondrial membrane potential in C2C12 t and RH30 u cells. The data are representative of the mean fluorescence in at least 100 cells in each cell type. The data were analyzed by Student’s t-test or ANOVA, followed by post hoc analysis. If p < 0.05, results were considered statistically significant
Fig. 4
Fig. 4. TMZ induces apoptosis and autophagy in C2C12 and RH30 3D culture.
a, b Bright field image of C2C12 a and RH30 b 3D culture which shows the morphology of untreated and TMZ treated cells (100, 250 µM, 4 h) in 3D culture. cf Viability assay was done by adding the live/dead solution to cells 48 and 96 h after treatment with TMZ (0–500 µM). Cells were incubated for 2 h in the dark at room temperature, rinsed twice with DPBS, and confocal microscopy was used to capture live/dead cell images in C2C12 c and RH30 d cells. e, f Quantification of live/dead assay was measured by calculating the ratio of live: total cells which showed a significant decrease in viability of C2C12 e and RH30 f cells treated with different concentrations of TMZ. The data showed TMZ significantly induces cell death in both C2C12 and RH30 cells (P < 0.001) while TMZ induces more cell death in RH30 compared to C2C12 cells. g, h IF labeling of C2C12 cells g and RH30 cells h by cleaved PARP following treatment with TMZ (100 µM, 72 h) increased number of cells with cleaved PARP in TMZ treated cells in comparison to control cells which is the hallmark of increase of apoptosis in these cells. i, j After treatment of C2C12 i and RH30 j cells with TMZ (100 µM, 72 h), cells were IF labeled with autophagosome markers, LC3 and P62. Data showed that TMZ increases LC3 puncta (green) which is localized with p62 compared to corresponding time match control, a hallmark of autophagy induction in C2C12 and RH30 3D culture

References

    1. Rudzinski Erin R. Histology and Fusion Status in Rhabdomyosarcoma. American Society of Clinical Oncology Educational Book. 2013;33:425–428. - PubMed
    1. Goldblum, J. R., Weiss, S. W. & Folpe, A. L. Enzinger and Weiss’s Soft Tissue Tumors E-Book. (Elsevier Health Sciences, Netherland 2013).
    1. Pizzo, P. A. & Poplack, D. G. Principles and practice of pediatric oncology. (Lippincott Williams & Wilkins, U.S.A. 2015).
    1. Kashi VP, Hatley ME, Galindo RL. Probing for a deeper understanding of rhabdomyosarcoma: insights from complementary model systems. Nat. Rev. Cancer. 2015;15:426–439. - PMC - PubMed
    1. Fletcher, C. D. & Organization, W. H. WHO classification of tumours of soft tissue and bone: [this book reflects the views of a working group that convened for a consensus and editorial meeting at the University of Zurich, Switzerland, 18–20, 2012]. (Internat. Agency for Research on Cancer, U.S.A 2013).