. 2018 Nov 6:2:24.
doi: 10.1038/s41698-018-0067-9. eCollection 2018.

Multi-faceted computational assessment of risk and progression in oligodendroglioma implicates NOTCH and PI3K pathways

Affiliations

Multi-faceted computational assessment of risk and progression in oligodendroglioma implicates NOTCH and PI3K pathways

Sameer H Halani et al. NPJ Precis Oncol. .

Abstract

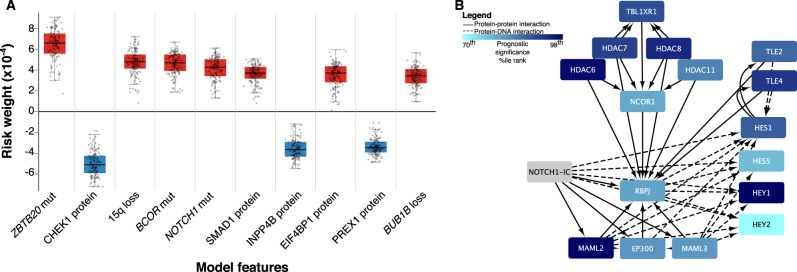
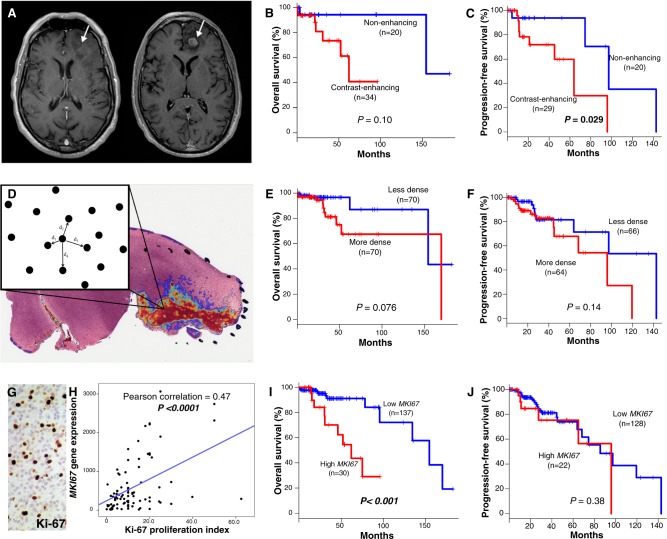
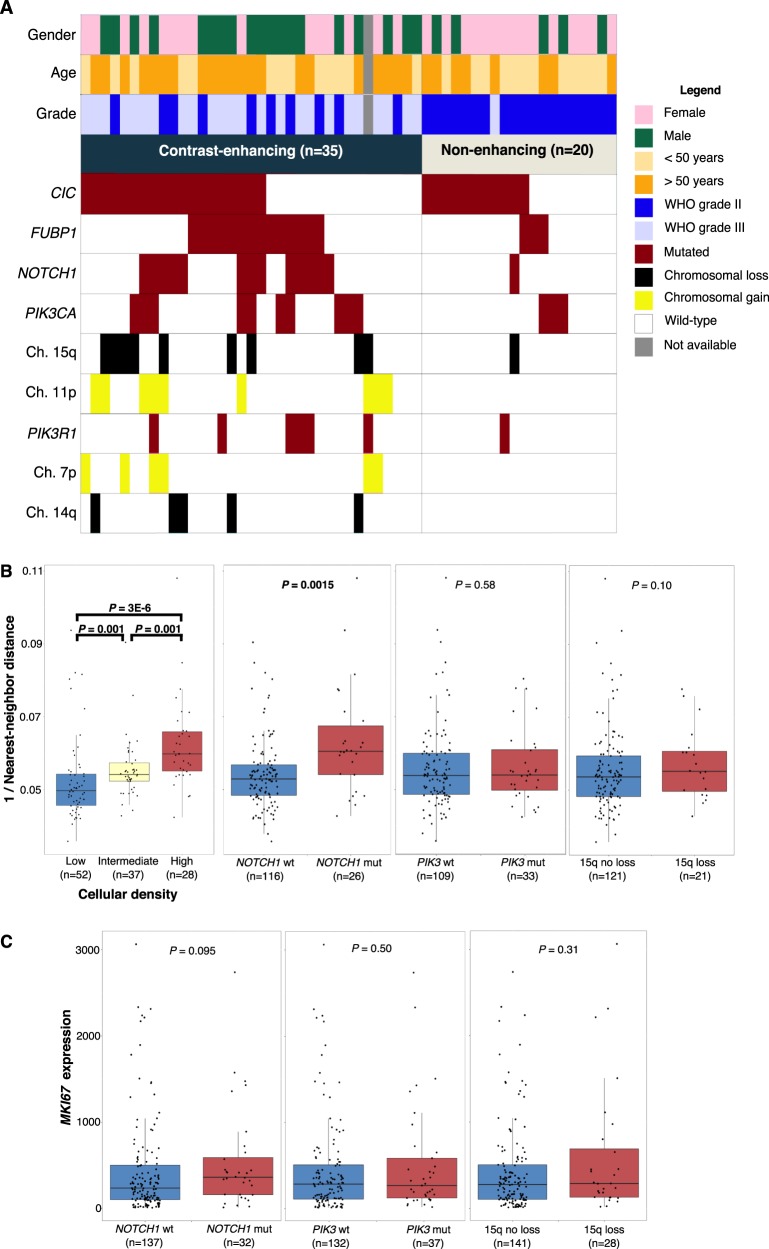
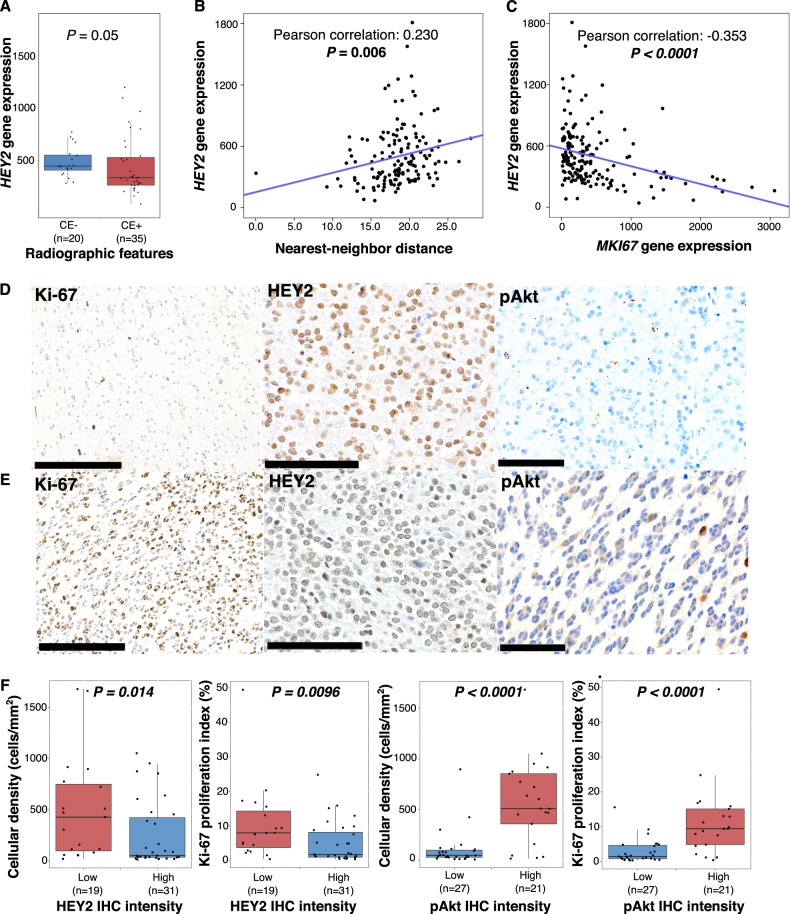
Oligodendrogliomas are diffusely infiltrative gliomas defined by IDH-mutation and co-deletion of 1p/19q. They have highly variable clinical courses, with survivals ranging from 6 months to over 20 years, but little is known regarding the pathways involved with their progression or optimal markers for stratifying risk. We utilized machine-learning approaches with genomic data from The Cancer Genome Atlas to objectively identify molecular factors associated with clinical outcomes of oligodendroglioma and extended these findings to study signaling pathways implicated in oncogenesis and clinical endpoints associated with glioma progression. Our multi-faceted computational approach uncovered key genetic alterations associated with disease progression and shorter survival in oligodendroglioma and specifically identified Notch pathway inactivation and PI3K pathway activation as the most strongly associated with MRI and pathology findings of advanced disease and poor clinical outcome. Our findings that Notch pathway inactivation and PI3K pathway activation are associated with advanced disease and survival risk will pave the way for clinically relevant markers of disease progression and therapeutic targets to improve clinical outcomes. Furthermore, our approach demonstrates the strength of machine learning and computational methods for identifying genetic events critical to disease progression in the era of big data and precision medicine.


Conflict of interest statement

The authors declare no competing interests.

Figures

Fig. 1
Fig. 1
a Neural network risk factors. A nonlinear Cox proportional hazards model was trained using a neural network to model survival in oligodendrogliomas using clinical, genetic and proteomic factors. Prognostic significance of each feature was assessed by determining how its changes impact prognosis. Positive scores indicate a negative impact on survival (red) while negative scores (blue) suggest a positive impact. The boxplot contains the top 10 factors ranked by median prognostic importance; complete results in Datafile S1. b Gene set enrichment analysis of Notch pathway members. A separate model based on mRNA expression weighed the prognostic significance of individual transcripts and used this data in a gene-set-enrichment analysis to identify pathways associated with prognosis. The canonical Notch pathway was highly enriched with significantly negatively scored transcripts (i.e., darker blue signifies negative scores). Increased expression of downstream targets, including HES1, HES5, and HEY1, were associated with improved prognosis. This model demonstrates Notch signaling inactivation is associated with poor prognosis
Fig. 2
Fig. 2
Markers of disease progression in oligodendroglioma a T1-weighted axial MR images with gadolinium contrast demonstrating CE− (left) and CE+ (right) features of oligodendroglioma from The Cancer Imaging Archive. b Kaplan–Meier plots of overall survival (OS) for CE- vs. CE + . c Progression-free survival (PFS) for CE− vs. CE+. d Visual representation of a tumor heatmap showing regions of interest of cell density, with a schematic diagram of the nearest-neighbor algorithm. e OS for cellular density (less vs. more dense). f PFS for less vs. more dense. g. High Ki-67 proliferation index visualized with IHC. h Linear regression of MKI67 expression and Ki-67 proliferation index approximated by IHC. i OS for high vs. low MKI67. j PFS for high vs. low MKI67. P values for survival plots determined using log-rank tests
Fig. 3
Fig. 3
Genetic alterations associated with advanced disease progression a Waterfall plot illustrating the mutational landscape of oligodendrogliomas based on radiographic features of progression. b Boxplots demonstrating nearest-neighbor validation, and differential 1/nearest-neighbor distances in key genetic alterations of oligodendroglioma. c Boxplots for differential MKI67 expression in key genetic alterations of oligodendroglioma. P values determined using Wilcoxon rank sum tests
Fig. 4
Fig. 4
HEY2 associations with advanced disease and validation cohort. a Boxplots demonstrating differential HEY2 gene expression in CE− and CE+; P value determined using Wilcoxon rank-sum test. b Linear regression of HEY2 gene expression and nearest-neighbor distance, demonstrating positive correlation. c Linear regression of HEY2 and MKI67 expression, demonstrating negative correlation. P values from Pearson correlation. d IHC showing high Ki-67 proliferation index (25%) (bar, 250 μm), with corresponding absent HEY2 expression (bar, 100 μm) and high pAkt expression (bar 100 μm). e IHC showing low Ki-67 proliferation index (1%) (bar, 250 μm), with corresponding high HEY2 expression (bar, 100 μm) and absent pAkt expression (bar, 100 μm). f HEY2 and pAKT IHC intensity as related to cellular density and Ki-67 proliferation indices

References

    1. Cancer Genome Atlas Research, N. et al. Comprehensive, integrative genomic analysis of diffuse lower-grade gliomas. N. Engl. J. Med. 2015;372:2481–2498. doi: 10.1056/NEJMoa1402121. - DOI - PMC - PubMed
    1. Parsons DW, et al. An integrated genomic analysis of human glioblastoma multiforme. Science. 2008;321:1807–1812. doi: 10.1126/science.1164382. - DOI - PMC - PubMed
    1. Yan H, et al. IDH1 and IDH2 mutations in gliomas. New Engl. J. Med. 2009;360:765–773. doi: 10.1056/NEJMoa0808710. - DOI - PMC - PubMed
    1. Louis, DN, Ohgaki, H., Wiestler, OD, Cavenee, WK. World Health Organization Histological Classification of Tumours of the Central Nervous System. International Agency for Research on Cancer, France (2016).
    1. Eckel-Passow JE, et al. Glioma groups based on 1p/19q, IDH, and TERT promoter mutations in tumors. New Engl. J. Med. 2015;372:2499–2508. doi: 10.1056/NEJMoa1407279. - DOI - PMC - PubMed