. 2018 Nov 21;20(45):28767-28776.
doi: 10.1039/c8cp04671a.

The sacrificial inactivation of the blue-light photosensor cryptochrome from Drosophila melanogaster

Affiliations

The sacrificial inactivation of the blue-light photosensor cryptochrome from Drosophila melanogaster

Roger Jan Kutta et al. Phys Chem Chem Phys. .

Abstract

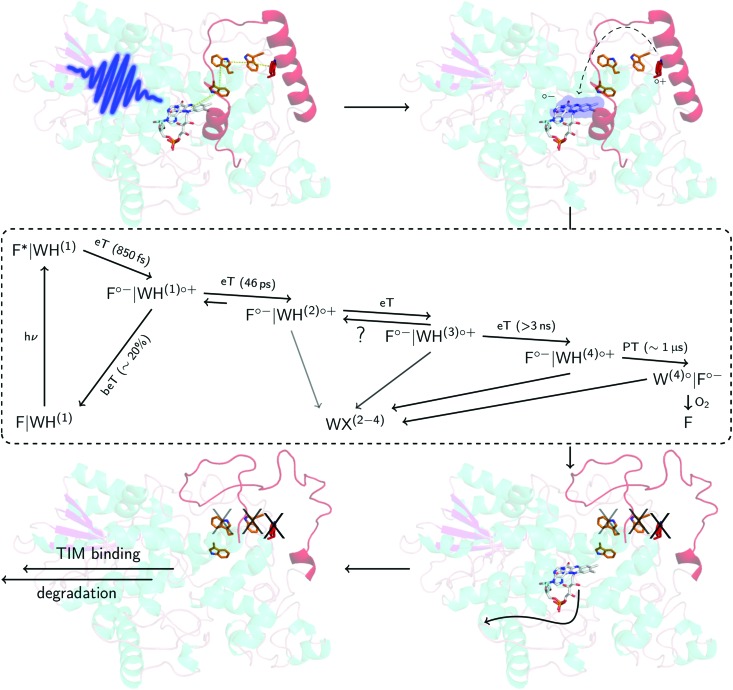
Drosophila melanogaster cryptochrome functions as the primary blue-light receptor that mediates circadian photo entrainment. Absorption of a photon leads to reduction of the protein-bound FAD via consecutive electron transfer along a conserved tryptophan tetrad resembling the signalling state required for conformational changes and induction of subsequent signalling cascades. However, how the initial photochemistry and subsequent dark processes leading to downstream signalling are linked to each other at the molecular level is still poorly understood. Here, we investigated in detail the initial photochemical events in DmCRY by time-resolved and stationary absorption spectroscopy combined with quantum chemical and molecular dynamics calculations. We resolved the early events along the conserved tryptophan tetrad and the final deprotonation of the terminal tryptophanyl radical cation. These initial events lead to conformational changes, such as the known C-terminal tail release, Trp decomposition, and finally FAD release providing evidence that DmCRY does not undergo a photocycle. We propose that light is a negative regulator of DmCRY stability even under in vitro conditions where the proteasomal machinery is missing, that is in line with its biological function, i.e. entrainment of the circadian clock.


Figures

Fig. 1
Fig. 1. Electron transfer cascade in DmCRY. Cartoon representation of FAD (grey carbons) bound to DmCRY and the adjacent conserved tryptophan tetrad (orange/red carbons) based on DmCRY's crystal structure (pdb code: 4GU5). All distances (yellow dashed lines) are measured from the centre of mass of each moiety. Additionally, the transition dipole moments of the most prominent absorption transitions are shown as indicated in the legend.
Fig. 2
Fig. 2. Initial events after photo excitation of FAD inside DmCRY. (a) Raw data of the time-resolved absorption spectra recorded under magic angle conditions in false colour representation (see also Fig. S3 for selected time traces, ESI†). The grey dashed rectangle indicates the data for which laser scattering was corrected. Thus, these data have a higher uncertainty than the rest of the data. (b) Corresponding time-resolved anisotropy data. (c) Decay associated difference spectra (Di, black, red, and blue) from global fit. (d) Selected anisotropy spectra as indicated in (b) by horizontal dashed lines. Inset: Anisotropy as a function of time averaged between 540 and 610 nm (black) and the corresponding tri-exponential global fit (red) using the rate constants obtained from the global fit in (c). (e) Species associated spectra used for decomposition of raw data shown in (a) (see text). (f) Decomposed mole-fraction vs. time profiles plus analytical solution of model shown in Fig. 6. Colour coding as in (e).
Fig. 3
Fig. 3. Intermediate events after photo excitation of FAD inside DmCRY. (a) Raw data of the time-resolved absorption spectra in false colour representation. The grey dashed rectangle indicates a spectral region, where the laser scatter and the small amount of flavin emission was replaced by the fit during the global fitting procedure as described elsewhere. (b) Decay associated difference spectra (Di, black and red) from global fit and linear combination spectra of known species spectra as indicated. (c) Species associated spectra (solid line) used for decomposition of raw data shown in (a) (see text). The dashed lines are reference spectra as indicated. (d) Decomposed mole-fraction vs. time profiles. Colour coding as in (c). Grey and pale blue circle show the sums (offset by 0.1 for visibility) of flavin and Trp contributions, respectively.
Fig. 4
Fig. 4. Final events after photo excitation of FAD inside DmCRY forming an irreversible Trp photo-product. (a) Sequence of absorption spectra of a freshly in the dark purified sample of DmCRY following a 1 s blue light pulse. This experiment was performed 13 × (10 × 1 s, 2 × 5 s and 1 × 10 s blue light pulse). (b) Absorption spectra after illumination as indicated and full re-oxidation (see for instance first re-oxidation sequence after first light pulse in panel (a)) and corresponding CD absorption spectra in the Vis (c) and UV (d) spectral range of the identical sample in (a) and (b). (e) Basis spectra for data decomposition: FADDmCRY dark state spectrum from freshly purified sample in the dark, FADDmCRY˙ from ref. 8, FADHDmCRY˙ is the 39 nm redshifted spectrum of FADHCrLOV1˙ from ref. 33, Trp-XDmCRY is the final spectrum of the entire sequence minus a linear combination of FADsolv, FADDmCRY, a scatter function, and an additional correction for small oscillatory features due to loss in fine structure signatures of the FADDmCRY spectrum (Fig. S17, ESI†), FADsolv recorded in this work. The spectrum of Trp-XDmCRY is arbitrarily scaled to the total amount of FADDmCRY used in the decomposition. (f) Mole fraction vs. experimental time profiles resulting from data decomposition using the basis spectra in e.
Fig. 5
Fig. 5. FAD re-oxidation in DmCRY in dependence of O2 and DTT. (a) Mole fraction vs. time profiles after 1 s blue light pulse in dependence of O2 (a) and after 100 ms blue light pulse in dependence of DTT concentration (b) as indicated.
Fig. 6
Fig. 6. Proposed mechanism in DmCRY at a molecular level. Cartoon representation of DmCRY crystal structure (pdb code: 4GU5) with stick representations of FAD (grey carbons) and the adjacent conserved tryptophan tetrad (orange/red carbons). Following the arrows: (1) photo-excitation of FAD; (2) eT along Trp-tetrad to FAD with details in dashed box derived from this study; (3) unwinding of CTT, Trp decomposition, and FAD release; (4) TIM binding and final degradation.

References

    1. Padmanabhan S., Jost M., Drennan C. L., Elías-Arnanz M. Annu. Rev. Biochem. 2017;86:485. - PMC - PubMed
    1. Kottke T., Xie A., Larsen D. S., Hoff W. D. Annu. Rev. Biophys. 2018;47:291. - PubMed
    1. Yin R., Ulm R. Curr. Opin. Plant Biol. 2017;37:42. - PubMed
    1. Cashmore A. R. Cell. 2003;114:537. - PubMed
    1. Yang Z., Liu B., Su J., Liao J., Lin C., Oka Y. Photochem. Photobiol. 2017;93:112. - PMC - PubMed

LinkOut - more resources