. 2019 Feb;94(2):189-199.
doi: 10.1002/ajh.25345. Epub 2018 Nov 28.

Integrated automated particle tracking microfluidic enables high-throughput cell deformability cytometry for red cell disorders

Affiliations

Integrated automated particle tracking microfluidic enables high-throughput cell deformability cytometry for red cell disorders

Puneeth Guruprasad et al. Am J Hematol. 2019 Feb.

Abstract

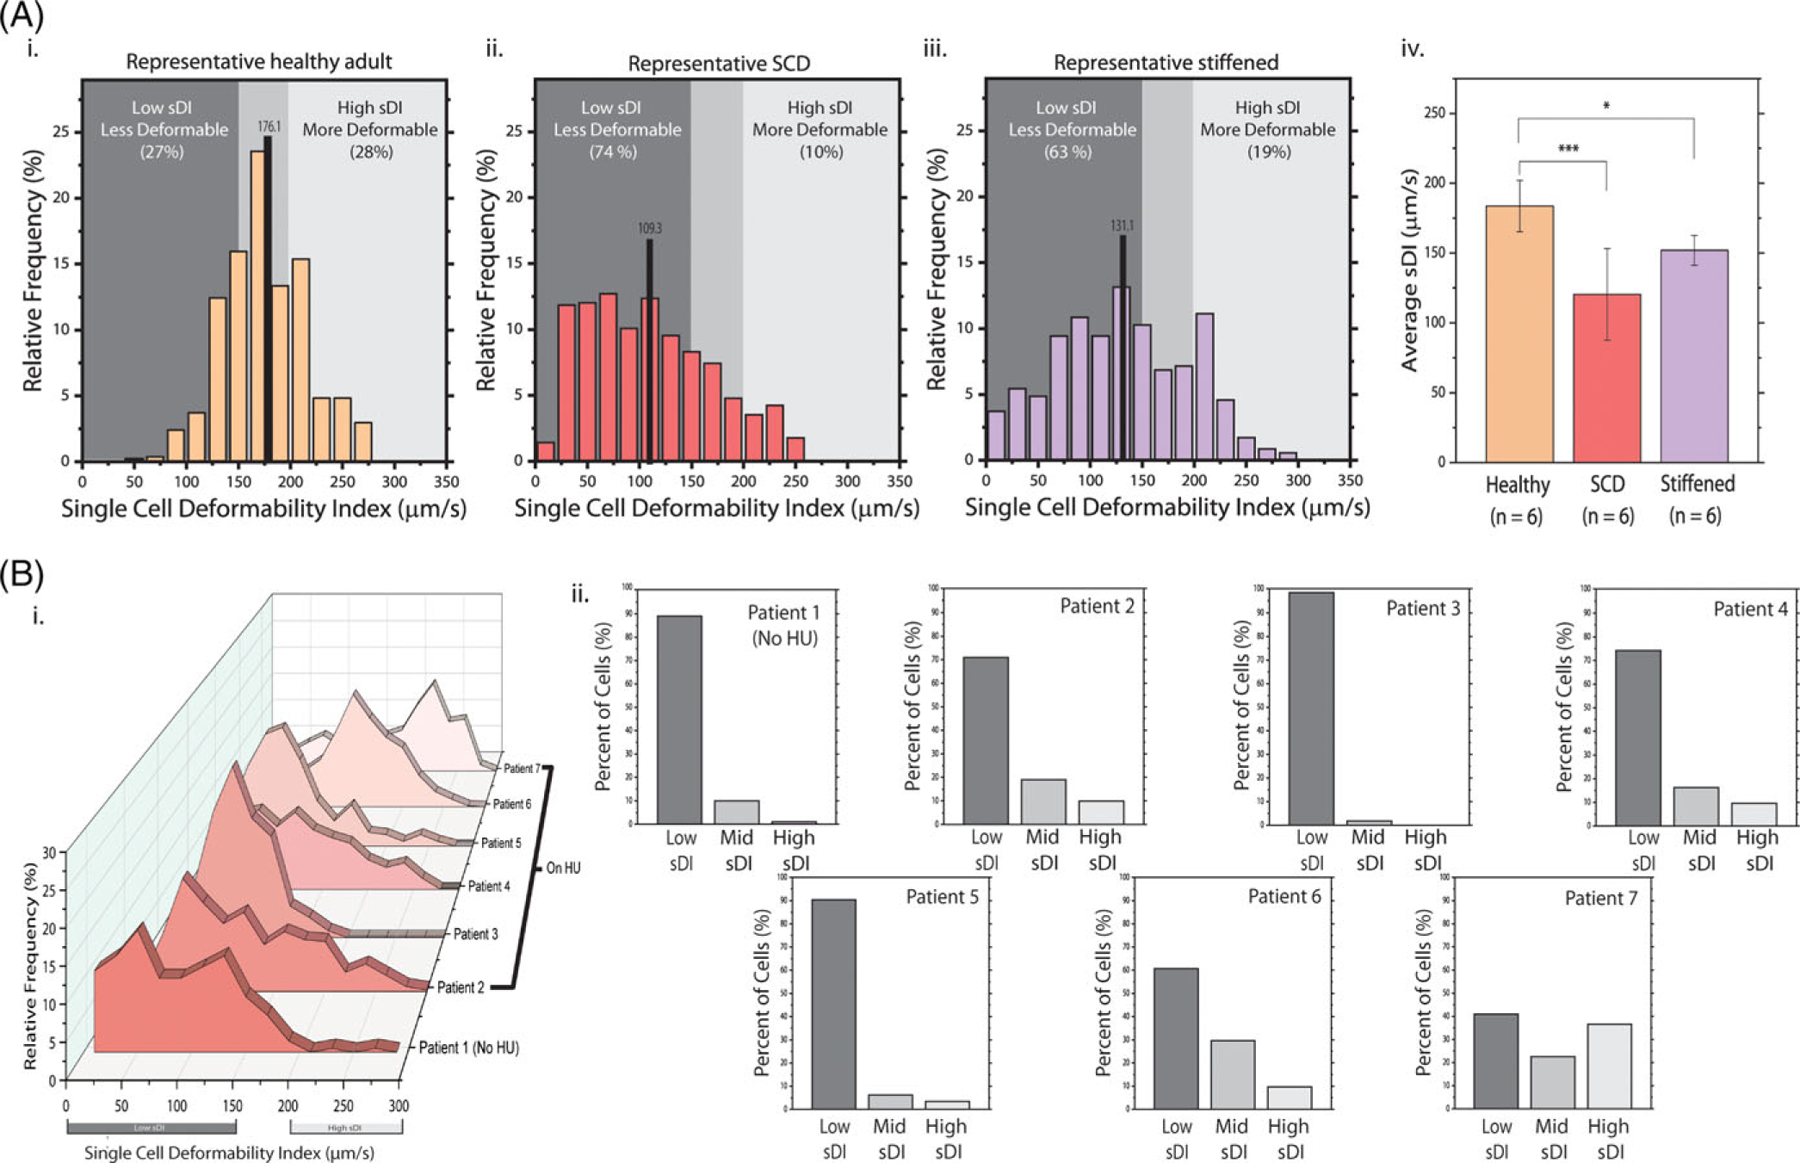
Investigating individual red blood cells (RBCs) is critical to understanding hematologic diseases, as pathology often originates at the single-cell level. Many RBC disorders manifest in altered biophysical properties, such as deformability of RBCs. Due to limitations in current biophysical assays, there exists a need for high-throughput analysis of RBC deformability with single-cell resolution. To that end, we present a method that pairs a simple in vitro artificial microvasculature network system with an innovative MATLAB-based automated particle tracking program, allowing for high-throughput, single-cell deformability index (sDI) measurements of entire RBC populations. We apply our technology to quantify the sDI of RBCs from healthy volunteers, Sickle cell disease (SCD) patients, a transfusion-dependent beta thalassemia major patient, and in stored packed RBCs (pRBCs) that undergo storage lesion over 4 weeks. Moreover, our system can also measure cell size for each RBC, thereby enabling 2D analysis of cell deformability vs cell size with single cell resolution akin to flow cytometry. Our results demonstrate the clear existence of distinct biophysical RBC subpopulations with high interpatient variability in SCD as indicated by large magnitude skewness and kurtosis values of distribution, the "shifting" of sDI vs RBC size curves over transfusion cycles in beta thalassemia, and the appearance of low sDI RBC subpopulations within 4 days of pRBC storage. Overall, our system offers an inexpensive, convenient, and high-throughput method to gauge single RBC deformability and size for any RBC population and has the potential to aid in disease monitoring and transfusion guidelines for various RBC disorders.


Conflict of interest statement

CONFLICT OF INTEREST

Nothing to report.

Figures

FIGURE 1
FIGURE 1
A schematic of the microfluidic setup integrated with automated image analysis using the UmUTracker MATLAB program. RBCs diluted in PBS are infused into the microfluidic device at a constant 1 μL/min flow rate and their transits through the microcapillary channels 5.89 μm in width are recorded at 20× magnification (A). The entire microfluidic device is shown at 4× magnification (A2). RBCs traversing the microchannels over 4 frames captured at 9.6 fps are highlighted in blue for visual convenience (B1). Depiction of the UmUTracker image analysis process shows the same 3 RBCs within the microfluidic device over time as they traverse the microchannel. Images are shown after a hologram normalization setting has been applied. The particle tracking algorithm places green dots on each RBC, labels each with an ID number, and places each within a template radius. The RBC velocity within the microchannel is used to measure the sDI distribution of a population of RBCs (B2)
FIGURE 2
FIGURE 2
sDI distributions confirm less deformable RBC subpopulations in SCD RBCs and in artificially stiffened RBCs and SCD patients, in particular, exhibit significant inter-patient variability of RBC deformability. (A) Representative sDI histograms of healthy, SCD, and glutaraldehydestiffened RBCs are shown. Healthy RBCs (1 donor, 540 cells) demonstrate sDIs distributed toward an average value of 176.1 (SD ± 40.7) μm/s, and 45% of sDIs are in the mid-range (i). A small magnitude skewness of 0.1 and kurtosis of −0.09 indicate a near-Gaussian distribution of values. The SCD RBCs (1 donor, 567 cells) from a patient on HU had both a lower average sDI of 109.3 (SD ± 60.2) μm/s and a significantly left-shifted nonnormal distribution as evidenced by a large positive skewness of 0.47 and large negative kurtosis of −0.86 (ii). The emergence of prominent subpopulations is most notable at lower velocities, as 74% of cells are within the low sDI range. The sDI profile of glutaraldehyde-treated RBCs (1 donor, 350 cells) had an average of 131.1 (SD ± 62.9) μm/s, a skewness of 0.11 and a kurtosis of −0.86 (iii). The mean sDI’s across 6 independent experiments for each condition are compared using a Student’s ttest on means (iv). All SCD samples were from patients on HU. The rough boundaries of ±1 SD from the average sDI of the 6 control or healthy samples dictate the middle range of sDIs. (B) the RBC sDI distributions for 7 SCD patients demonstrate significant interpatient variation and the emergence of prominent heterogeneous RBC subpopulations (i). The average sDI from a patient not on HU (patient 1) is 83.0 (SD ± 51. 4) μm/s with a “left shifted” peak sDI and wide spread as indicated by a skewness of 0.44 and a kurtosis of −0.33. The overall average sDI of all 6 patient samples on HU is 120.5 (SD ± 32.9) μm/s with relatively “right shifted” peak sDIs. The sDI distribution skewness for each patient on HU is 0.54, 0.27, 0.47, 1.07, 0.01, and −0.33, and respective kurtosis was −0.66, −0.07, −0.67, 1.07, −0.16, and 0.−84. Percentages of cells in each sDI regime (low, middle, and high) show large distributions of rigid cells within most patient’s RBC sample (ii)
FIGURE 3
FIGURE 3
sDI distributions fluctuate significantly in healthy RBCs in storage and in thalassemia patients after blood transfusions. (A) RBC sDI distributions extracted from a single bag of refrigerated pRBCs shows distinct decreasing peak sDIs from days 1 to 28 of storage (i). analysis of skewness and kurtosis for these distributions does not reveal notable trends. The most prominent decrease occurred between days 15 to 20, when the average sDIs across 3 stored pRBC units were 135.4 (SD ± 3.0) and 100.7 (SD ± 21.0), respectively (ii). After 12 days of storage, the average sDI of the 3 samples enters the low SDI regime. Quantification of cell percentages within each sDI range shows a sharp increase in distribution of low sDI cells over time in storage (iii). (B) RBC sDI distributions from a single beta thalassemia patient over 37 days are shown with times of transfusions indicated in red (i) whereas average RBC sDI values (right) do not indicate significant changes before or after transfusions (ii), analysis of the entire RBC sDI distributions reveal more obvious changes at the RBC subpopulation level. Specifically, an increase in the number of more deformable RBCs (right shift) is observed immediately after both transfusions (red), as indicated by shifts to more negative values of skewness across each respective transfusion (0.49 to −0.1 over transfusion 1 and −0.72 to −0.82 over transfusion 2). This more deformable subpopulation steadily decreases throughout the rest of the cycle (left shift)
FIGURE 4
FIGURE 4
DCSPs of effective RBC diameter and sDI in various hematologic contexts illustrate RBC subpopulations and their shifts over time. DCSPs of RBC sDI vs effective cell diameter or cell size for 3 healthy individuals show narrow and condensed spreads of both RBC sDIs and sizes (A). These spreads are contained mostly within quadrant I, a region of normal to high sDI and normal cell size. An SCD patient not on HU has a much wider distribution of sDI vs cell diameter; the bulk of the spread lies within quadrants III and IV, regions of lower sDI (B). Wide spread of subpopulations is also observed in 2 other DCSPs for SCD patients on HU. DCSPs for a beta thalassemia patient tracked over the course of 2 transfusion cycles show significant rightward intensity shifts in cell size distribution immediately following transfusion events (days 2 and 23) and gradual leftward shifts in between the transfusion events (C). Quantification of cell percentages in each quadrant shows a shift in subpopulation density from quadrants III and IV to quadrant I following transfusion events (D)

References

    1. Diez-Silva M, Dao M, Han J, Lim C-T, Suresh S. Shape and biomechanical characteristics of human red blood cells in health and disease. MRS Bull/Mater Res Soc. 2010;35(5):382–388. - PMC - PubMed
    1. Yen RT, Fung YC. Effect of velocity distribution on red cell distribution in capillary blood vessels. Am J Physiol Heart Circ Physiol. 1978;235(2): H251–H257. - PubMed
    1. Sosa JM, Nielsen ND, Vignes SM, Chen TG, Shevkoplyas SS. The relationship between red blood cell deformability metrics and perfusion of an artificial microvascular network. Clin Hemorheol Microcirc. 2014; 57(3):291–305. - PMC - PubMed
    1. Stadler A, Linderkamp O. Flow behavior of neonatal and adult erythrocytes in narrow capillaries. Microvasc Res. 1989;37(3):267–279. - PubMed
    1. Stuart J. Erythrocyte rheology. J Clin Pathol. 1985;38(9):965–977. - PMC - PubMed

Publication types