

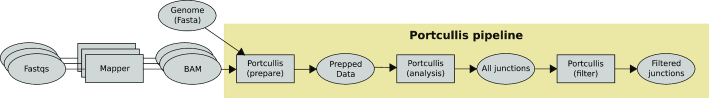
Efficient and accurate detection of splice junctions from RNA-seq with Portcullis
- PMID: 30418570
- PMCID: PMC6302956
- DOI: 10.1093/gigascience/giy131
Efficient and accurate detection of splice junctions from RNA-seq with Portcullis
Abstract
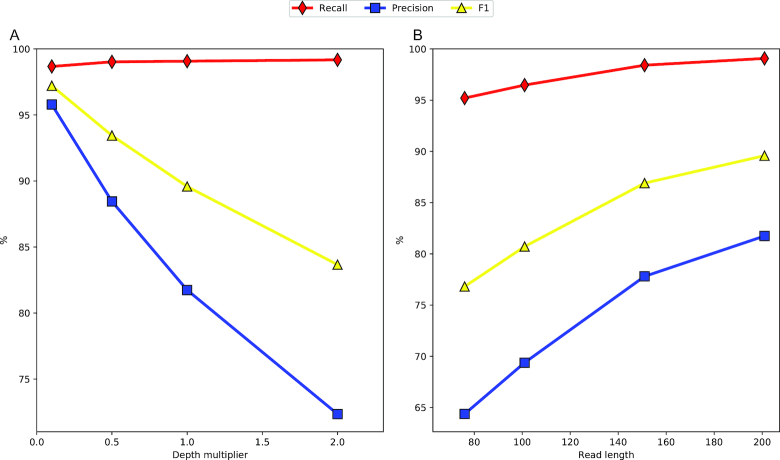
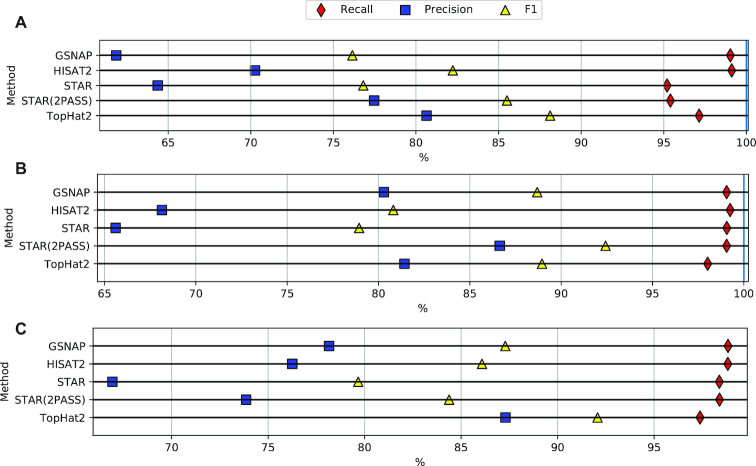
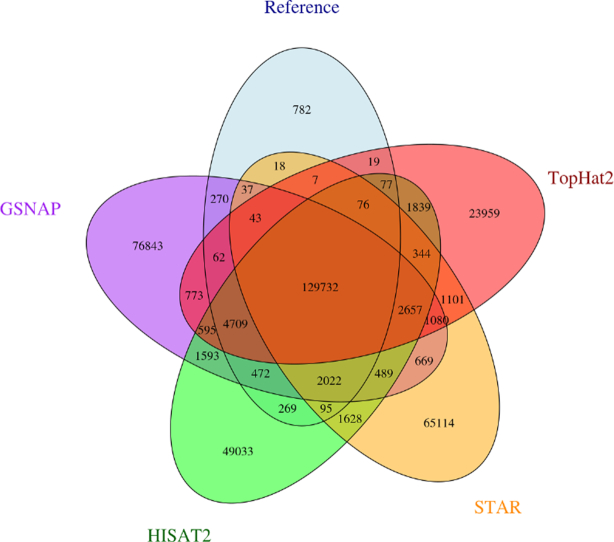
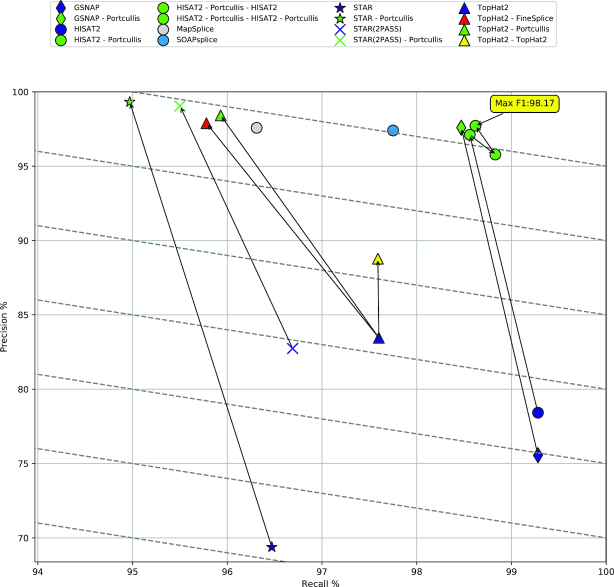
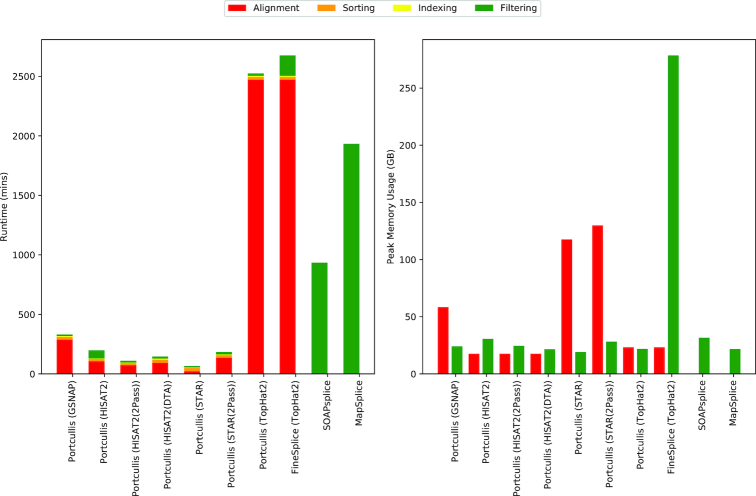
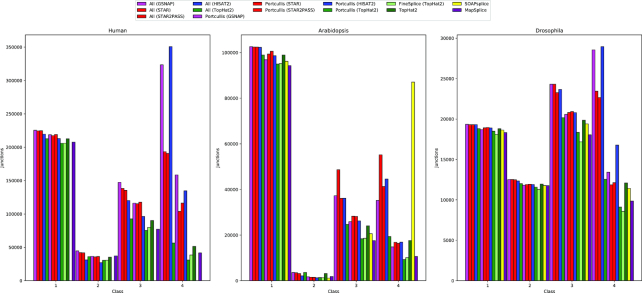
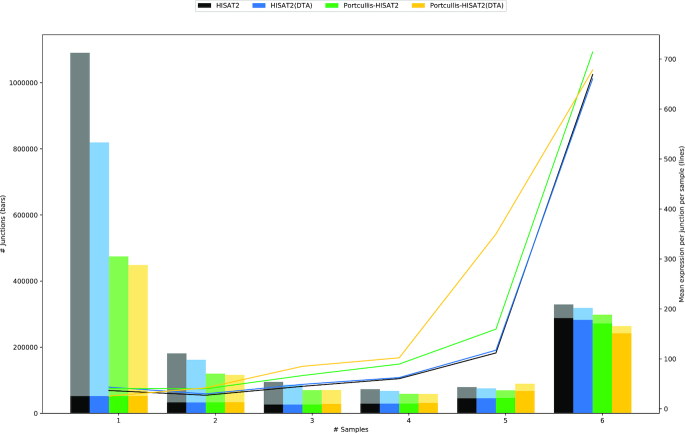
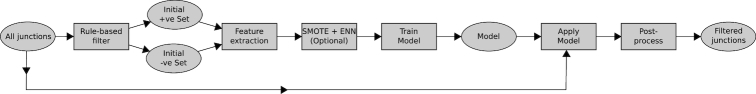
Next-generation sequencing technologies enable rapid and cheap genome-wide transcriptome analysis, providing vital information about gene structure, transcript expression, and alternative splicing. Key to this is the accurate identification of exon-exon junctions from RNA sequenced (RNA-seq) reads. A number of RNA-seq aligners capable of splitting reads across these splice junctions (SJs) have been developed; however, it has been shown that while they correctly identify most genuine SJs available in a given sample, they also often produce large numbers of incorrect SJs. Here, we describe the extent of this problem using popular RNA-seq mapping tools and present a new method, called Portcullis, to rapidly filter false SJs derived from spliced alignments. We show that Portcullis distinguishes between genuine and false-positive junctions to a high degree of accuracy across different species, samples, expression levels, error profiles, and read lengths. Portcullis is portable, efficient, and, to our knowledge, currently the only SJ prediction tool that reliably scales for use with large RNA-seq datasets and large, highly fragmented genomes, while delivering accurate SJs.
Figures

References
-
- Christinat Y, Pawłowski R, Krek W. jSplice: a high-performance method for accurate prediction of alternative splicing events and its application to large-scale renal cancer transcriptome data. Bioinformatics. 2016;32(14): 2111–2119. - PubMed
Publication types
MeSH terms
Substances
Grants and funding
- BBS/E/T/000PR9817/BB_/Biotechnology and Biological Sciences Research Council/United Kingdom
- BB/J003743/1/BB_/Biotechnology and Biological Sciences Research Council/United Kingdom
- BB/CSP1720/1/BB_/Biotechnology and Biological Sciences Research Council/United Kingdom
- BB/CCG1720/1/BB_/Biotechnology and Biological Sciences Research Council/United Kingdom
LinkOut - more resources
Full Text Sources
Other Literature Sources
Molecular Biology Databases
