. 2019 Feb 7:462:48-64.
doi: 10.1016/j.jtbi.2018.10.049. Epub 2018 Oct 27.

Microvscular networks with uniform flow

Affiliations

Microvscular networks with uniform flow

Shyr-Shea Chang et al. J Theor Biol. .

Abstract

Within animals, oxygen exchange occurs within vascular transport networks containing potentially billions of microvessels that are distributed throughout the body. By comparison, large blood vessels are theorized to minimize transport costs, leading to tree-like networks that satisfy Murray's law. We know very little about the principles underlying the organization of healthy micro-vascular networks. Indeed capillary networks must also perfuse tissues with oxygen, and efficient perfusion may be incompatible with minimization of transport costs. While networks that minimize transport costs have been well-studied, other optimization principles have received much less scrutiny. In this work we derive the morphology of networks that uniformize blood flow distribution, inspired by the zebrafish trunk micro-vascular network. To find uniform flow networks, we devise a gradient descent algorithm able to optimize arbitrary differentiable objective functions on transport networks, while exactly respecting arbitrary differentiable constraint functions. We prove that in a class of networks that we call stackable, which includes a model capillary bed, the uniform flow network will have the same flow as a uniform conductance network, i.e., in which all edges have the same conductance. This result agrees with uniform flow capillary bed network found by the algorithm. We also show that the uniform flow completely explains the observed radii within the zebrafish trunk vasculature. In addition to deriving new results on optimization of uniform flow in micro-vascular networks, our algorithm provides a general method for testing hypotheses about possible optimization principles underlying real microvascular networks, including exposing tradeoffs between flow uniformity and transport cost.

Keywords: Blood flow; Capillary; Constrained optimization; Gradient descent; Phase transition; Zebrafish.


Figures

Fig. 1.
Fig. 1.
Examples of complex microvascular networks and the corresponding model networks. (A) Capillary bed in salamander skin [36]. (B) Microvascular network of zebrafish 7.5 days post fertilization (dpf) embryo [25, 9].
Fig. 2.
Fig. 2.
Zebrafish trunk microvascular network (red square) optimizes uniform flow in fine vessels at a high transport cost, compared to untuned networks (blue dots). The untuned networks are obtained by randomly permuting the conductances of fine vessels in a real zebrafish trunk network [9]. The transport cost is characterized by dissipation [6, 1], and the flow variation is quantified by the coefficient of variation of flows in the fine vessels.
Fig. 3.
Fig. 3.
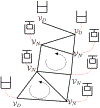
Transport network with the Dirichlet vertices VD and Newmann vertices VN . In our representation we imagine Dirichlet vertices connected to fluid reservoirs allowing pressure to be imposed, and Neumann vertices to syringe pumps, allowing inflows or outflows to be imposed [8]. Loops are shown in arrows.
Fig. 4.
Fig. 4.
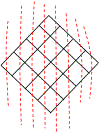
A quadrilateral grid (black) can be divided using a set of non-intersecting control surfaces (red dashed lines) such that each edge in the grid is intersected by exactly one control surface.
Fig. 5.
Fig. 5.
Minimally dissipative networks agree with previous work (with target junction Σκkl(pkpl)2 and material constraint κklγKγ with γ=12 ). (A) We use a branching grid as our basic topology. There are N = 20 layers of vertices and a total of 380 edges, connecting a single source (red filled circle) with 8 sinks (red open circles). (B) A minimal dissipative network calculated by gradient descent method exhibits tree structure as predicted in [17]. We imposed a fixed zero pressure on the top vertex and 8 evenly distributed outflows on the bottom. Each edge is initially assigned a positive uniformly random conductance to impose no prior knowledge on the algorithm. (C) Murray’s law [38] is obeyed by the minimal dissipative network, indicated by the nearly constant sum of radius to an exponent 3.004 among different hierarchies in network shown in (B).
Fig. 6.
Fig. 6.
Minimally dissipative networks consist of a single conduit on capillary bed topology (with target function Σ κkl (pk – pl)2 and material constraint κklγKγ with γ=12 on a 10×10 square grid). (A) We represent the capillary bed network by a square grid where a single source and a single sink locate at upper-left and lower-right corners respectively. (B, C) Different initial conductances produce different optimal networks, but all optimal networks are made of a single wide conduit. Here we use a constant step size throughout the process, and at each step we project by surface normal to maintain the material constraint. Each edge is initially assigned a positive uniformly random conductance to impose no prior knowledge on the algorithm.
Fig. 7.
Fig. 7.
Uniform flow networks have a seemingly random morphology, but can be shown to have the same flows as a uniform conductance network (Here we show a 20×20 square grid network with 400 vertices). (A) An optimal network has an apparently random distribution of conductances. The edge widths are proportional to the conductances. (B) A closer view reveals that the conductances of the optimal network (blue circle) are quite different from uniform (red cross), and do not seem qualitatively different from initial conductances drawn from a uniform random distribution (green star). The conductances are normalized such that κ12 are the same. Each edge is initially assigned a positive uniformly random conductance to impose no prior knowledge on the algorithm. (C) The differences of flows from those in a uniform conductance network (blue circles) are uniformly zero, while the differences of initial flows from those in a uniform conductance network (green stars) are not.
Fig. 8.
Fig. 8.
Minimal dissipative networks for zebrafish trunk vasculature do not explain observed morphology. (A) The zebrafish trunk vasculature can be simplified into a ladder network with arterial (red) and venous parts (blue). The edges e1, e3, …, e2n-1 are aorta segments and e2, e4, …, e2n are capillaries. We use n = 12 in all the following calculations on zebrafish network. (B) The optimal dissipative network with γ=12 and fixed inflow does not correctly describe the zebrafish trunk network since all the conductances are concentrated on the first capillary (red circle), and the whole aorta is deleted (blue cross). In this calculation we imposed a fixed inflow on v1 and fixed zero pressure on vn+1,…,v2n+1. We started with κ = 20 for aorta segments and κ = 1 for capillaries to reflect the difference in radii in real zebrafish. This initial condition is used for all the following simulations. (C) The optimal dissipative network with γ=12 and fixed outflows has a tapering aorta (blue cross) and capillaries with the same conductances (red circle). We imposed zero pressure on v1 and fixed outflows on vn+1, …,v2n+1 with vn+1 taking half of the total outflow (i.e. 12 F) and vn+2,…, v2n+1 evenly dividing the other half of F. (D) However the pressures on the ends of capillaries are decreasing to maintain uniform flows among capillaries, which is non-physical since this means that the blood flows toward the tail in the principal cardinal vein, due to the aorta-vein symmetry.
Fig. 9.
Fig. 9.
The uniform flow networks quantitatively explains the zebrafish trunk vascular network morphology. (A) The uniform flow network dictates a constant conductance on aorta segments (blue cross) but assigns conductances to Se vessels that increase exponentially from head to tail (red circle). We scale the conductances such that κ12 remains the same for comparison with minimal dissipative networks. We started with κ = 20 for aorta segments and κ = 1 for capillaries to reflect the difference in radii in real zebrafish. (B) The predicted hydraulic resistance (blue dashed curve) agrees well with experimentally measured data (red curve, with 95% confidence intervals). The data is obtained from our previous work [9] under the assumption that the volume fraction of the red blood cells is 0.45 [43]. Theoretical resistances are normalized by the mean since optimization only controls the relative resistances of vessels.
Fig. 10.
Fig. 10.
Uniform flow networks under Murray constraint have the same flows as the analytic solution in Sec 3.2, but exhibit tradeoff between dissipation and material cost as a increases. (A) For small a the uniform flow network with Murray constraint is equivalent to a network with material constraint. The network is constrained with a = 36.8, and the solution is selected from the best network visited during the gradient descent, with relative error in energy cost < 10−4, as in the following simulations. Widths show the relative conductances. (B) When a is increased, the dissipation in the network increases (blue crosses), while the material cost decreases (red circles). The simulations were carried out in the manner of numerical continuation, i.e. the simulation for each a starts with the solution from previous a, and the simulation for a = 0 starts with a random conductance configuration. All the networks have the same fixed total energy cost K = 1174.9.
Fig. 11.
Fig. 11.
Uniform flow networks on zebrafish trunk topology exhibit a phase transition when a, the relative cost of dissipation to total material, is varied in the Murray constraint. (A) The target function remains zero for small a until ac = 33.3 where a phase transition occurs and the value of target function suddenly increases (blue crosses). The dissipation (red circles) increases with a for a < ac just as for the capillary bed, but has a sharp decrease right after the critical value ac. Here we adopted numerical continuation as in Fig. 10B, but when a local minimum around previous initial condition does not satisfy Murray constraint the initial configuration at a = 0 is reused for the initial conductances. The minimal value for the total energy cost upon scaling of conductances is used whenever the Murray constraint cannot be maintained. The Murray energy K is maintained to be 70.43 in all simulations by the projection method described in Section 2.6. The total energy cost is fixed to that of initial configuration (with uniform conductances in fine vessels being 1 and those in aorta being 20) when a = 1. The solution is selected from the best network visited during the gradient descent, with relative error in energy cost < 10−4 (B) The conductances of capillaries change qualitatively after the phase transition. The morphology resembles the unconstrained network (Fig. 9A) before the phase transition (blue cross and red circle), but changes qualitatively afterwards (green square). (C) The flows are uniform before the phase transition (blue cross and red circle), but decrease from head to tail afterwards (green square).

References

    1. Acheson David J. Elementary fluid dynamics. Oxford University Press, 1990.
    1. Alim Karen, Amselem Gabriel, Peaudecerf François, Brenner Michael P, and Pringle Anne. Random network peristalsis in physarum polycephalum organizes fluid flows across an individual. Proceedings of the National Academy of Sciences, 110(33):13306–13311, 2013. - PMC - PubMed
    1. Ayata Cenk, Andrew K Dunn Yasemin Gursoy-Özdemir, Huang Zhihong, Boas David A, and Moskowitz Michael A. Laser speckle flowmetry for the study of cerebrovascular physiology in normal and ischemic mouse cortex. Journal of Cerebral Blood Flow & Metabolism, 24(7):744–755, 2004. - PubMed
    1. Barber Jared O, Alberding Jonathan P, Restrepo Juan M, and Secomb Timothy W. Simulated two-dimensional red blood cell motion, deformation, and partitioning in microvessel bifurcations. Annals of biomedical engineering, 36(10):1690–1698, 2008. - PMC - PubMed
    1. Blinder Pablo, Philbert S Tsai, Kaufhold John P, Knutsen Per M, Suhl Harry, and Kleinfeld David. The cortical angiome: an interconnected vascular network with noncolumnar patterns of blood flow. Nature neuroscience, 16(7):889–897, 2013. - PMC - PubMed

Publication types

LinkOut - more resources