. 2019 Apr 1;25(7):2228-2240.
doi: 10.1158/1078-0432.CCR-18-0936. Epub 2018 Nov 12.

Preclinical Efficacy of Endoglin-Targeting Antibody-Drug Conjugates for the Treatment of Ewing Sarcoma

Affiliations

Preclinical Efficacy of Endoglin-Targeting Antibody-Drug Conjugates for the Treatment of Ewing Sarcoma

Pilar Puerto-Camacho et al. Clin Cancer Res. .

Abstract

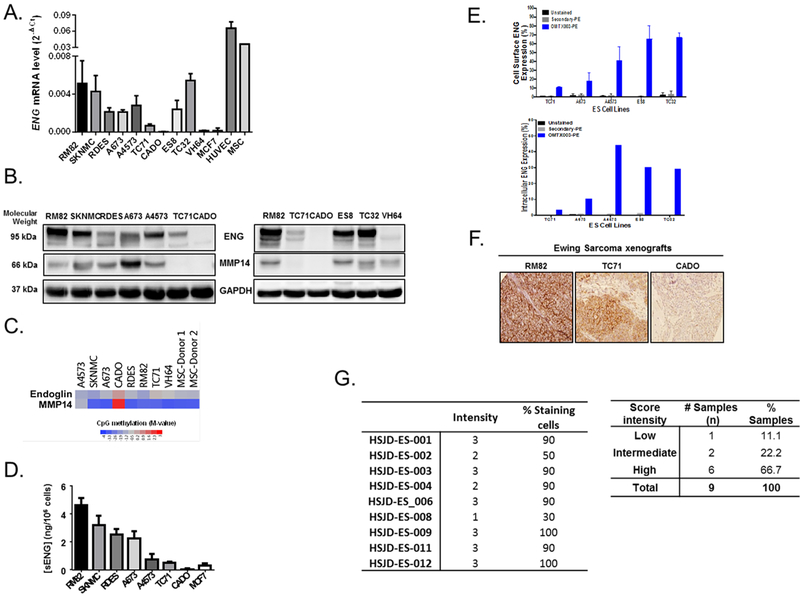
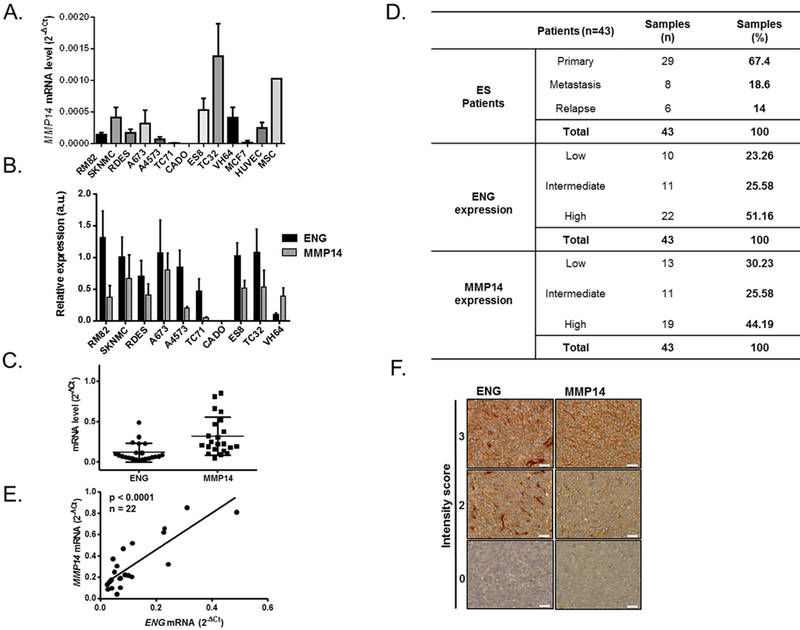
Purpose: Endoglin (ENG; CD105) is a coreceptor of the TGFβ family that is highly expressed in proliferating endothelial cells. Often coopted by cancer cells, ENG can lead to neo-angiogenesis and vasculogenic mimicry in aggressive malignancies. It exists both as a transmembrane cell surface protein, where it primarily interacts with TGFβ, and as a soluble matricellular protein (sENG) when cleaved by matrix metalloproteinase 14 (MMP14). High ENG expression has been associated with poor prognosis in Ewing sarcoma, an aggressive bone cancer that primarily occurs in adolescents and young adults. However, the therapeutic value of ENG targeting has not been fully explored in this disease.

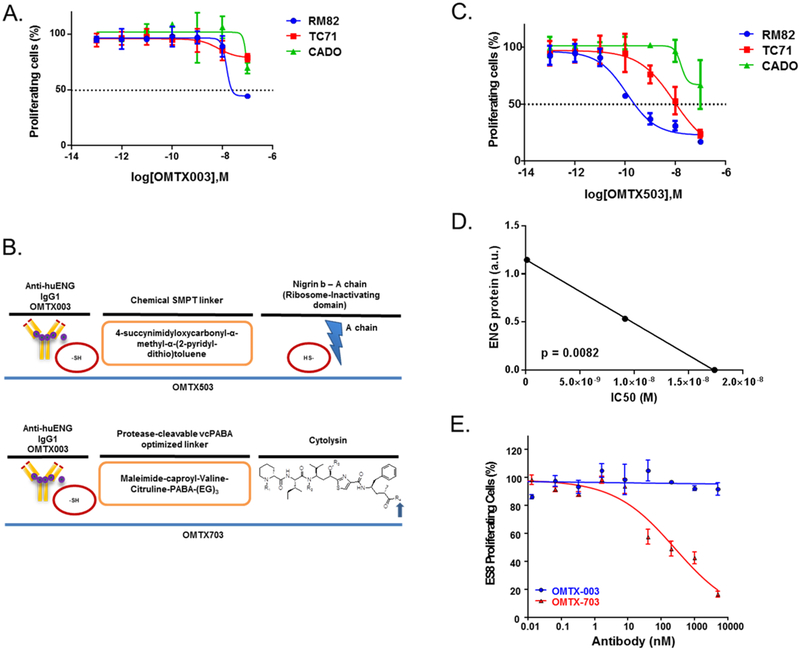
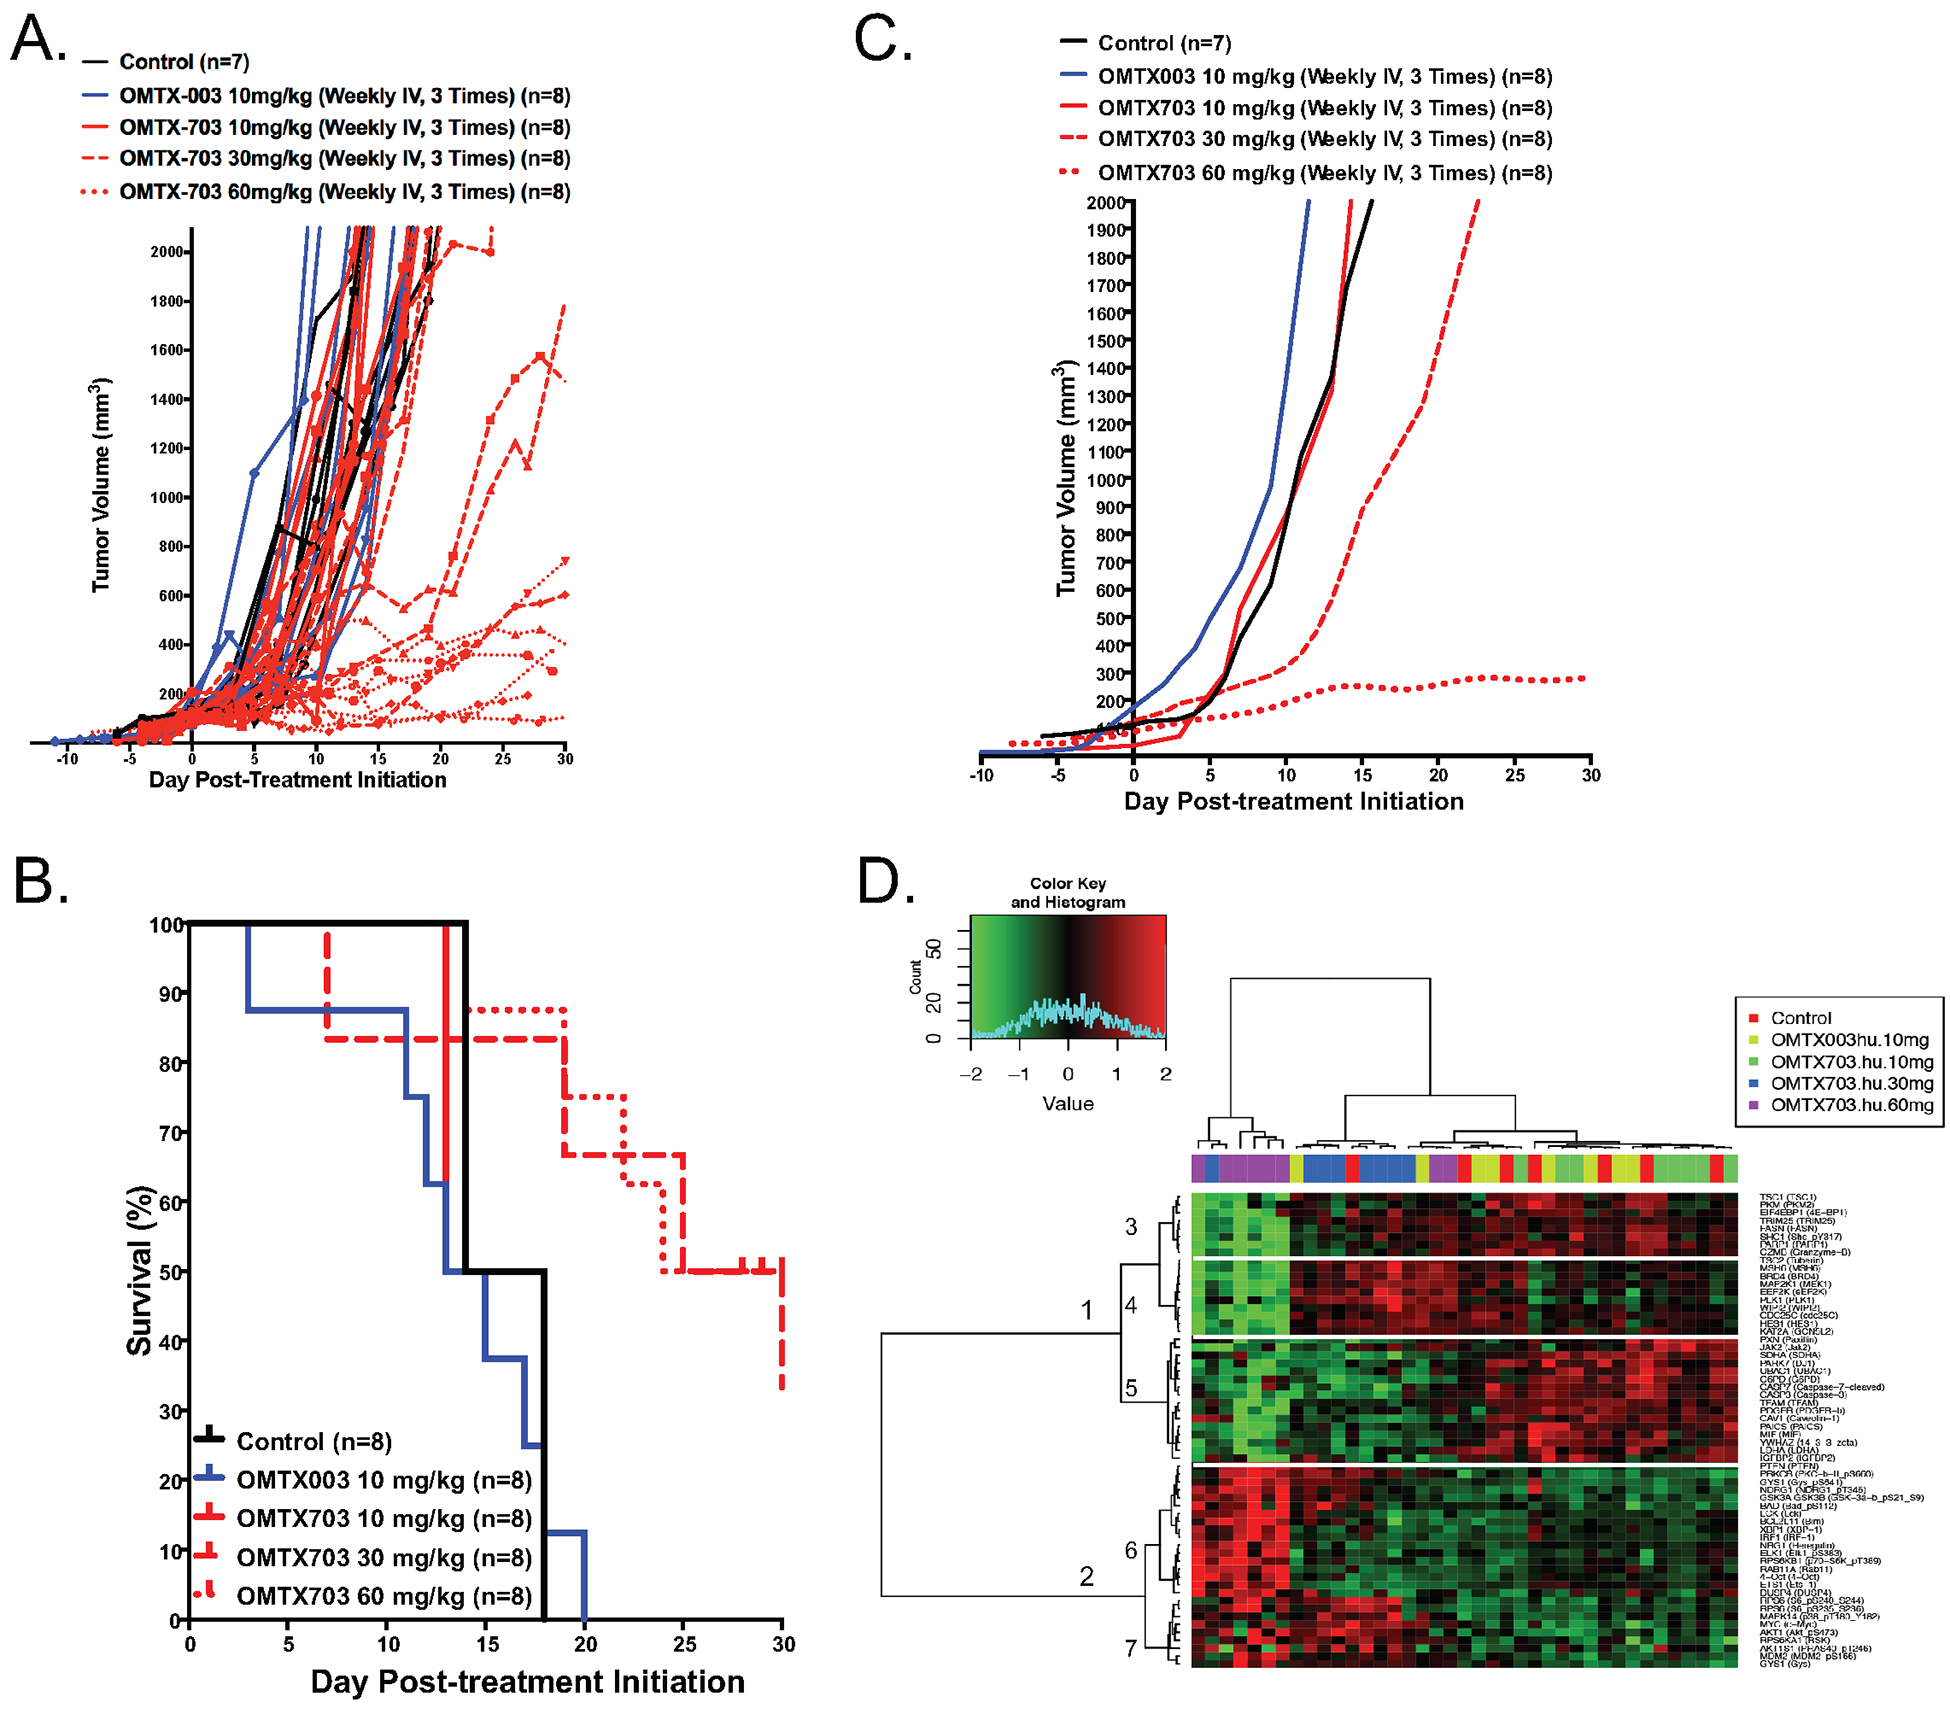
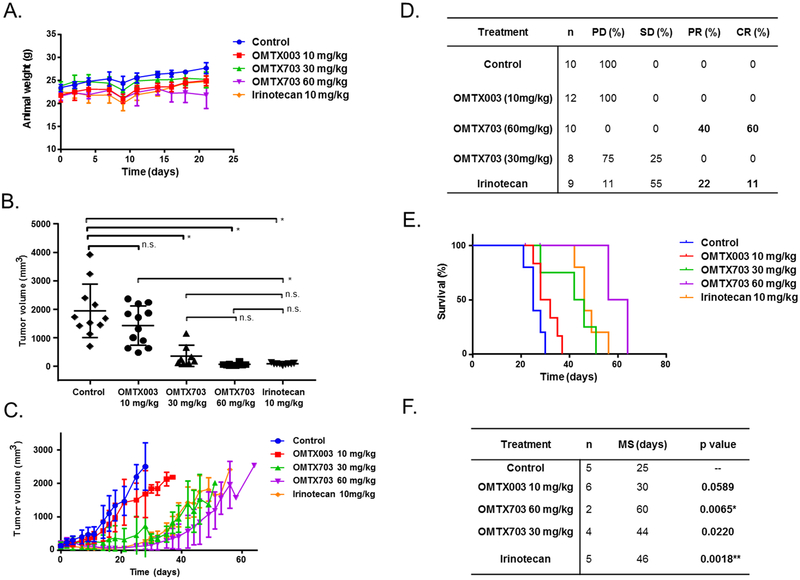
Experimental design: We characterized the expression pattern of transmembrane ENG, sENG, and MMP14 in preclinical and clinical samples. Subsequently, the antineoplastic potential of two novel ENG-targeting monoclonal antibody-drug conjugates (ADC), OMTX503 and OMTX703, which differed only by their drug payload (nigrin-b A chain and cytolysin, respectively), was assessed in cell lines and preclinical animal models of Ewing sarcoma.

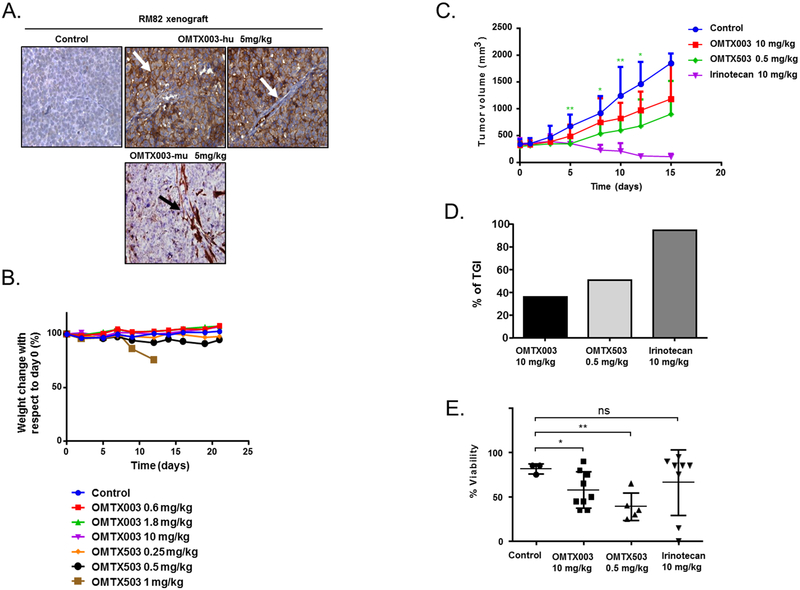
Results: Both ADCs suppressed cell proliferation in proportion to the endogenous levels of ENG observed in vitro. Moreover, the ADCs significantly delayed tumor growth in Ewing sarcoma cell line-derived xenografts and patient-derived xenografts in a dose-dependent manner.

Conclusions: Taken together, these studies demonstrate potent preclinical activity of first-in-class anti-ENG ADCs as a nascent strategy to eradicate Ewing sarcoma.


Conflict of interest statement

Conflict of interest: SD, CF, MF, LS are Oncomatryx employees. JL serves as an external advisor to Oncomatryx, who partially supported his lab's endoglin-related research. All the other authors declare no potential conflicts of interest.

Figures

Figure 1.
Figure 1.. Heterogeneous expression of ENG/MMP14 in ES cell lines and xenografts.
(A-B) The expression of ENG was heterogeneous amongst ES cell lines at both mRNA (A) and protein (B) levels measured, respectively by qRT-PCR and western blotting (n = 10). (B) Similarly, heterogeneous expression of MMP14 was observed at the protein level as determined by western blot (n = 10). (C) The methylation status of ENG/MMP14 genes in the CADO cell line suggests that these genes are regulated at the epigenetic level (GSE#118872). (D) The soluble form of ENG was detected at the extracellular compartment by ELISA in a set of ES cell lines (n = 7) that express ENG. MCF7 cells are used as a negative control. (E) Cell surface and intracellular expression of endoglin as assessed by flow cytometry against a panel of human ES cells. The OMTX003 vehicle antibody exhibits linear dose-dependent binding and effectively discriminates between medium-low-expressing (TC71 and A673) and high-expressing (ES8, TC32 and A4573) cell lines. (F) Maintained expression of ENG was confirmed in RM82, TC71 and CADO xenograft tumors of ES (n = 3), respectively with high, intermediate-low and negative expression. (G) Heterogeneous expression of ENG was investigated in 9 PDX models of ES, which are screened based on the intensity of stain and % of stained cells. The frequency of ENG expression intensity (high-intermediate-low) was presented on the right table.
Figure 2.
Figure 2.. MMP14 expression correlates with ENG levels in ES cell lines and patients.
(A-B) MMP14 presents a heterogeneous expression amongst ES cell lines, as determined by qRT-PCR (A). Relative protein expression of both ENG/MMP14 after normalization against GAPDH is depicted in (B). (C) Heterogeneous expression of ENG and MMP14 at the mRNA levels measured by qRT-PCR in a cohort of 22 frozen ES tumor samples. (D) Evaluation of ENG and MMP14 expression by IHC in 43 FFPE ES tumor samples (E). Significant correlation between ENG and MMP14 at the mRNA levels (r = 0.8331, p = 0.0001). (F) Representative images of different intensity scores (0, 2, 3) of ENG/MMP14 expression in ES patients.
Figure 3.
Figure 3.. ES cells are affected in vitro by ENG-ADCs treatment within an ENG expression-dependent manner.
(A) OMTX003 was tested on three ES cell lines: RM82, TC71 and CADO, which show differential expression of ENG, in order to evaluate in vitro the effect of this ADC on the proliferation rate of these cell lines. (B) Chemical structure of the OMTX-ADC, ENG MAb candidate lead linked to a cytotoxic agent, nigrin-b A chain (OMTX503) or cytolysin (OMTX703). (C) OMTX503 activity was tested on these cell lines, which resulted in an inhibition of their proliferation rate in an ENG expression-dependent manner. (D) There is a significant correlation between the IC50 of OMTX503 over the ES cell lines RM82, TC71 and CADO and the ENG protein expression of these cell lines (r = −0.9999, p = 0.0082). (E) OMTX003 and OMTX703 were tested during 72 h in WST1 proliferation cell-based assay using ES8 cell line. Only OMTX703 showed a significant inhibition of ES8 cell proliferation in a dose-dependent manner (IC50 = 260 nM).
Figure 4.
Figure 4.. OMTX503 impairs in vivo ES tumor growth at a safe concentration.
(A) In vivo binding assay: OMTX003 specifically binds to RM82 cell membranes, as indicated with a white arrow in the middle image, but not in murine-derived microvessels within the xenograft tumor, (as indicated with a white arrow in the far right image of the panel). In contrast, the murine targeting MAb (OMTX003-mu) binds specifically to the microvessels and is undetected in the membrane of the tumor cells as indicated with a black arrow in the lower image of the panel. (B) Comparison of normalized body weight during drug treatment in RM82 xenografts (n = 3 animals per group). (C-D) Therapeutic effect of OMTX503 in RM82 ES xenografts. Tumor volumes were reported after treatment with OMTX003, OMTX503, PBS as negative control, and irinotecan as positive control (n = 9 animals per group). (C) Curves showing mean tumor volumes for RM82 xenograft tumors during the drug treatments. * represents significance between OMTX503 0.5 mg/kg and the control group: at day 5 p = 0.0008; at day 7 p = 0.0118; at day 10 p= 0.0064 and at day 12 p = 0.0218. (D) Tumor growth Inhibition at day 15 in RM82 xenografts treated with OMTX003, OMTX503 and irinotecan (n = 5, n = 7 and n = 9 animals per group, respectively). (E) Cell viability percentage using H&E stain in different treated RM82 tumors at day 15 with OMTX003 (10 mg/kg, p = 0.010) and OMTX503 (0.5 mg/kg, p = 0.002). * and ** represent the significance of difference between two groups of treated mice, respectively p < 0.05 and p < 0.005 according to two tailed, paired Student’s T-test.
Figure 5.
Figure 5.. OMTX703 strongly reduces tumor growth in ES8 xenograft models.
(A) Therapeutic effect of OMTX003 and OMTX703 in ES8 Ewing sarcoma xenografts. Immunocompromised NOD-SCID-IL-2Rgnull/null mice (NSG) were injected with 1·106 ES8 cells at their flank. Treatment with OMTX003 (n = 8), OMTX703 (n = 8 for each dosing group) or control vehicle (n = 7) was started when tumor volumes reached of about 100 mm3. The curves show individual tumor volumes for a period of 30-days drug exposure. (B) The panel shows Kaplan-Meier curves. The p < 0.019 value for differences between the treated OMTX703 (60 mg/kg) and control mice were performed with the log-rank (Mantel-Cox) test. (C) The curves show the smoothed grouped median relative tumor volumes. The OMTX703 (60 mg/kg) treatment show a significant blockade of ES8 tumor growth as compared to control group of mice using unpaired t-test and two-tailed p-value (p < 0.0001). However, no significant effect of low doses OMTX (10 or 30 mg/kg) on this tumor growth. (D) RPPA profiling (GSE#114866) of control (n=7), OMTX003 (10 mg/kg; n = 8), OMTX703 (10 mg/kg; n = 8), OMTX703 (30 mg/kg; n = 8) and OMTX703 (60 mg/kg; n = 8)-treated ES8 xenografts following a 2-week exposure identifies statistically significant 60 proteins at a false discovery rate (FDR) of 0.01.
Figure 6.
Figure 6.. OMTX703 leads to complete response and prolonged survival time in an ES PDX model.
We selected the PDX model with the highest expression of ENG as the best candidate to evaluate the efficacy of OMTX703. (A) Body weights during OMTX003, OMTX703 and irinotecan treatments. No signs of toxicity in terms of weight loss were detected. (n = 6 animals per group; means and SD) (B) Tumor volumes at the end of treatment (21 days). Irinotecan-treated group was considered as the positive control of response. (n = 6 animals per group; 8–12 tumors were evaluable in each group; individual tumor volumes are shown). * P < 0.0001 (one way ANOVA with Tukey’s multiple comparisons test); n.s. : not significant. (C) Efficacy study showing dose-dependent partial tumor growth inhibition with OMTX703. All mice showed progressive disease by the end of the study. (D) Response at the end of treatment (day 21). PD: Progressive Disease; SD: Stable Disease; PR: Partial Response; CR: Complete Response. (E) Kaplan-Meier survival curves. (F) Median Survival (MS) times: The OMTX703-treated group presented the highest median survival (60 days) compared to the reference group treated with irinotecan (46 days). * Significant as compared to control (log rank test). Upon Bonferroni correction for multiple comparisons of the median survivals of treatment groups versus control group, P value threshold < 0.0125 was considered significant.

References

    1. Biswas B, Bakhshi S. Management of Ewing sarcoma family of tumors: Current scenario and unmet need. World J Orthop 2016;7(9):527–38. - PMC - PubMed
    1. Zucman J, Delattre O, Desmaze C, Plougastel B, Joubert I, Melot T, et al. Cloning and characterization of the Ewing’s sarcoma and peripheral neuroepithelioma t(11;22) translocation breakpoints. Genes Chromosomes Cancer 1992;5(4):271–7. - PubMed
    1. Sheffield NC, Pierron G, Klughammer J, Datlinger P, Schonegger A, Schuster M, et al. DNA methylation heterogeneity defines a disease spectrum in Ewing sarcoma. Nat Med 2017;23(3):386–95. - PMC - PubMed
    1. Huertas-Martinez J, Court F, Rello-Varona S, Herrero-Martin D, Almacellas-Rabaiget O, Sainz-Jaspeado M, et al. DNA methylation profiling identifies PTRF/Cavin-1 as a novel tumor suppressor in Ewing sarcoma when co-expressed with caveolin-1. Cancer letters 2017;386:196–207. - PubMed
    1. Franzetti GA, Laud-Duval K, van der Ent W, Brisac A, Irondelle M, Aubert S, et al. Cell-to-cell heterogeneity of EWSR1-FLI1 activity determines proliferation/migration choices in Ewing sarcoma cells. Oncogene 2017. - PMC - PubMed

Publication types

MeSH terms