

PTMiner: Localization and Quality Control of Protein Modifications Detected in an Open Search and Its Application to Comprehensive Post-translational Modification Characterization in Human Proteome
- PMID: 30420486
- PMCID: PMC6356076
- DOI: 10.1074/mcp.RA118.000812
PTMiner: Localization and Quality Control of Protein Modifications Detected in an Open Search and Its Application to Comprehensive Post-translational Modification Characterization in Human Proteome
Abstract
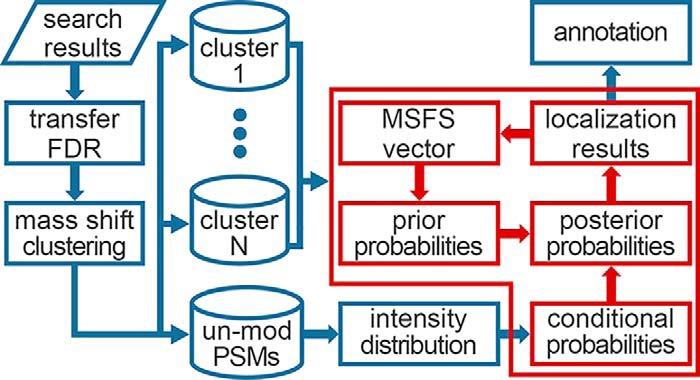
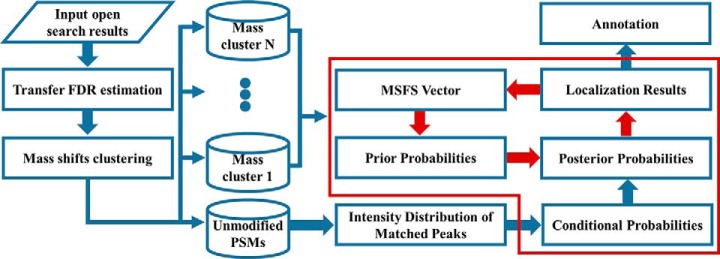
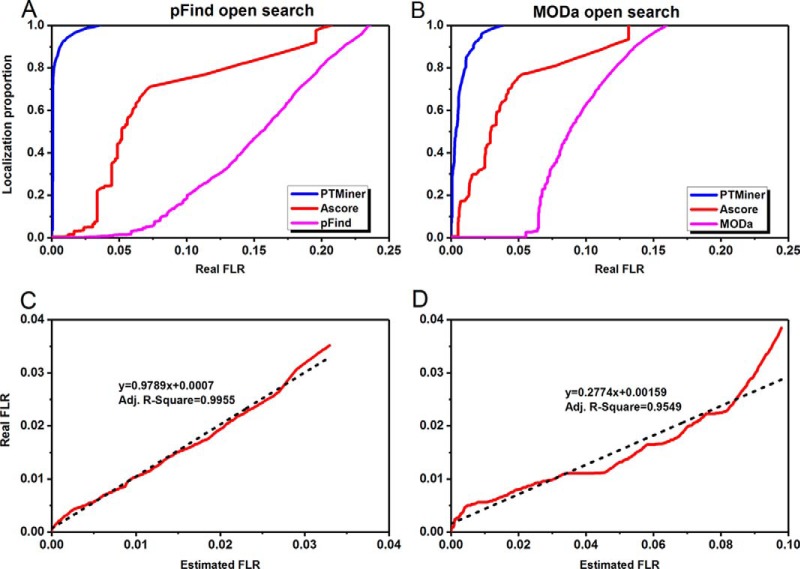
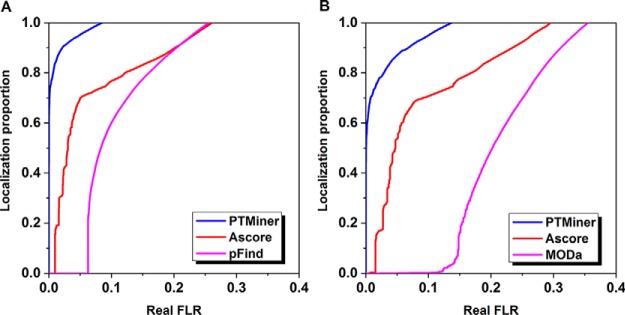
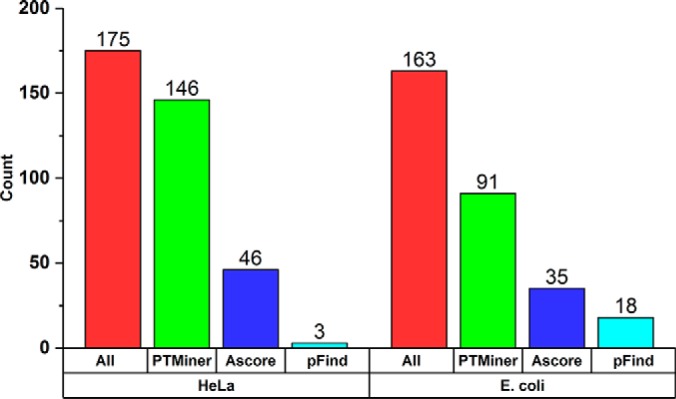
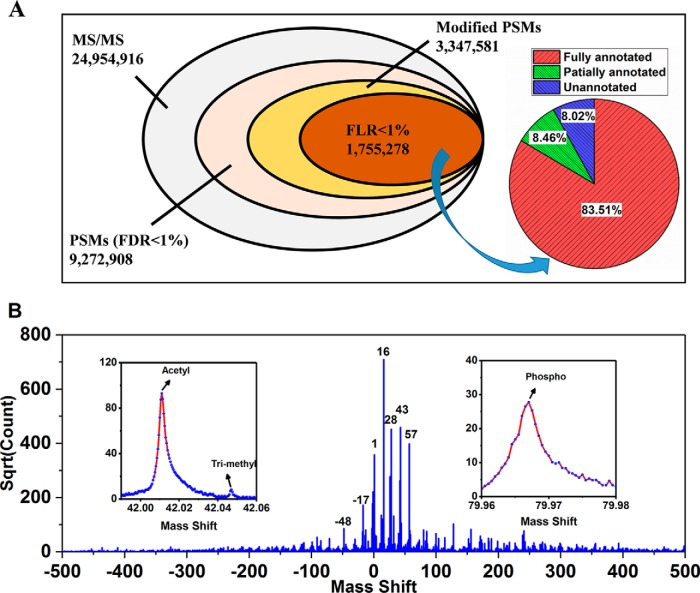
The open (mass tolerant) search of tandem mass spectra of peptides shows great potential in the comprehensive detection of post-translational modifications (PTMs) in shotgun proteomics. However, this search strategy has not been widely used by the community, and one bottleneck of it is the lack of appropriate algorithms for automated and reliable post-processing of the coarse and error-prone search results. Here we present PTMiner, a software tool for confident filtering and localization of modifications (mass shifts) detected in an open search. After mass-shift-grouped false discovery rate (FDR) control of peptide-spectrum matches (PSMs), PTMiner uses an empirical Bayesian method to localize modifications through iterative learning of the prior probabilities of each type of modification occurring on different amino acids. The performance of PTMiner was evaluated on three data sets, including simulated data, chemically synthesized peptide library data and modified-peptide spiked-in proteome data. The results showed that PTMiner can effectively control the PSM FDR and accurately localize the modification sites. At 1% real false localization rate (FLR), PTMiner localized 93%, 84 and 83% of the modification sites in the three data sets, respectively, far higher than two open search engines we used and an extended version of the Ascore localization algorithm. We then used PTMiner to analyze a draft map of human proteome containing 25 million spectra from 30 tissues, and confidently identified over 1.7 million modified PSMs at 1% FDR and 1% FLR, which provided a system-wide view of both known and unknown PTMs in the human proteome.
Keywords: Algorithms; Bioinformatics Software; False Discovery Rate; False Localization Rate; Human Proteome Map; Modification Site Localization; Open Search; Post-translational Modifications; Quality Control and Metrics; Statistics; Tandem Mass Spectrometry.
© 2019 An et al.
Conflict of interest statement
We declare no conflict of interest
Figures


References
-
- Yates J. R. 3rd, Eng J. K., McCormack A. L., and Schieltz D. (1995) Method to correlate tandem mass spectra of modified peptides to amino acid sequences in the protein database. Anal. Chem. 67, 1426–1436 - PubMed
-
- Nesvizhskii A. I., Roos F. F., Grossmann J., Vogelzang M., Eddes J. S., Gruissem W., Baginsky S., and Aebersold R. (2006) Dynamic spectrum quality assessment and iterative computational analysis of shotgun proteomic data: toward more efficient identification of post-translational modifications, sequence polymorphisms, and novel peptides. Mol. Cell Proteomics 5, 652–670. - PubMed
-
- Griss J., Perez-Riverol Y., Lewis S., Tabb D. L., Dianes J. A., Del-Toro N., Rurik M., Walzer M. W., Kohlbacher O., Hermjakob H., Wang R., and Vizcaíno J. A. (2016) Recognizing millions of consistently unidentified spectra across hundreds of shotgun proteomics datasets. Nat. Methods 13, 651–656. - PMC - PubMed
-
- Nielsen M. L., Savitski M. M., and Zubarev R. A. (2006) Extent of modifications in human proteome samples and their effect on dynamic range of analysis in shotgun proteomics. Mol. Cell. Proteomics 5, 2384–2391. - PubMed
Publication types
MeSH terms
Substances
LinkOut - more resources
Full Text Sources
Miscellaneous
