. 2018 Nov 27;115(48):E11238-E11247.
doi: 10.1073/pnas.1717092115. Epub 2018 Nov 12.

Training in cognitive strategies reduces eating and improves food choice

Affiliations

Training in cognitive strategies reduces eating and improves food choice

Rebecca G Boswell et al. Proc Natl Acad Sci U S A. .

Abstract

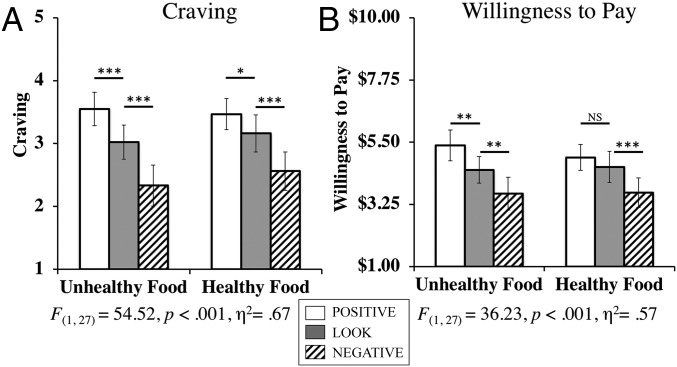
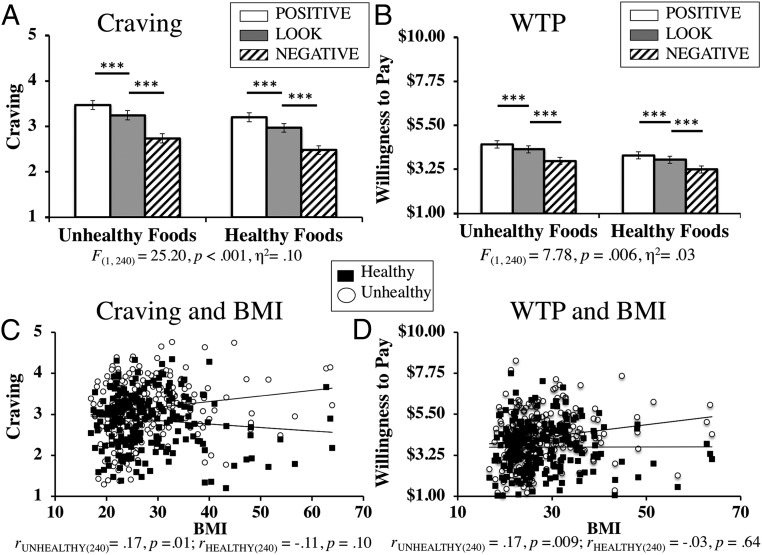
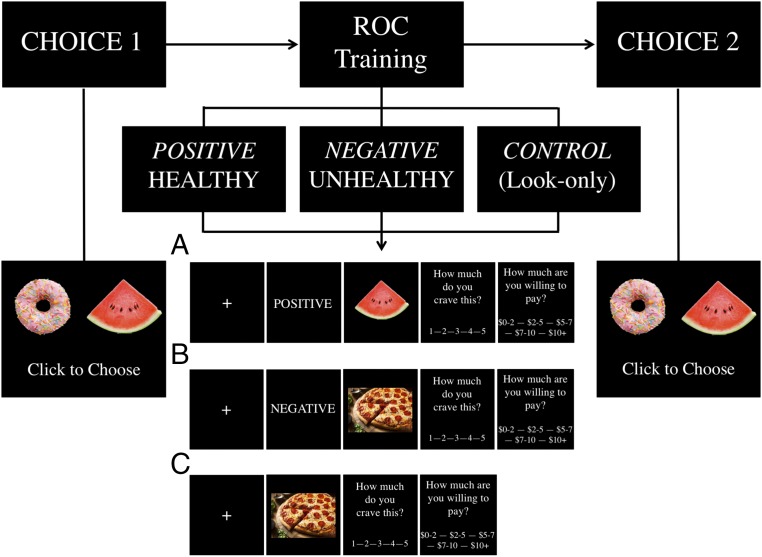
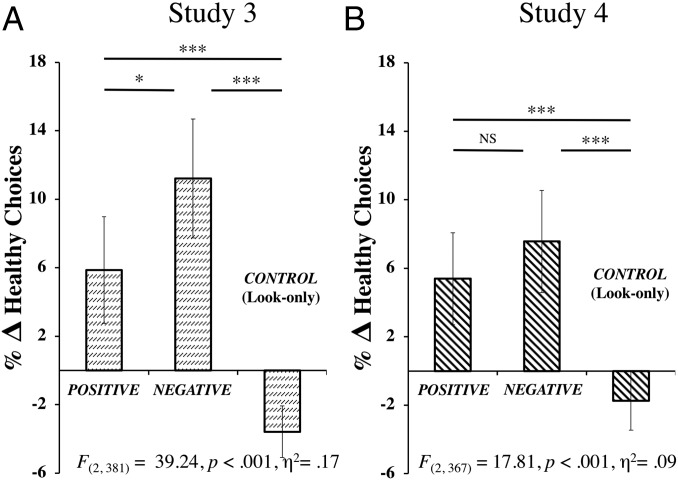
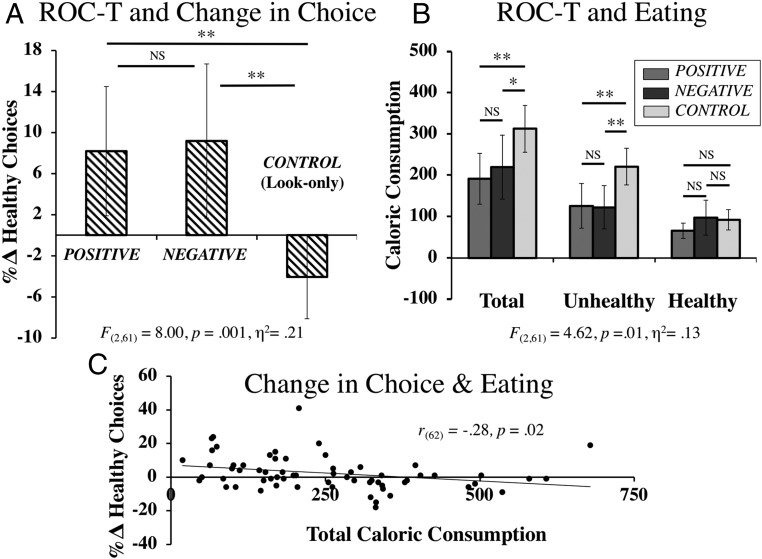
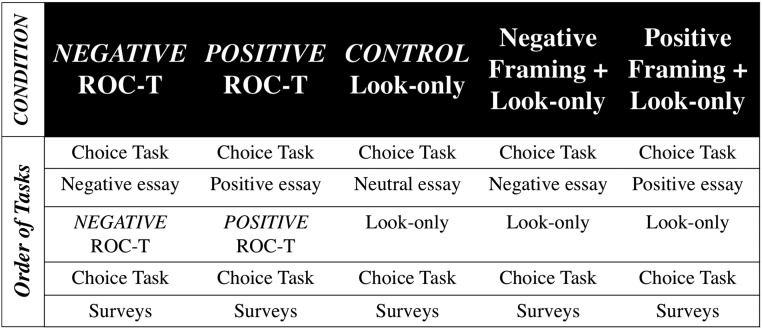
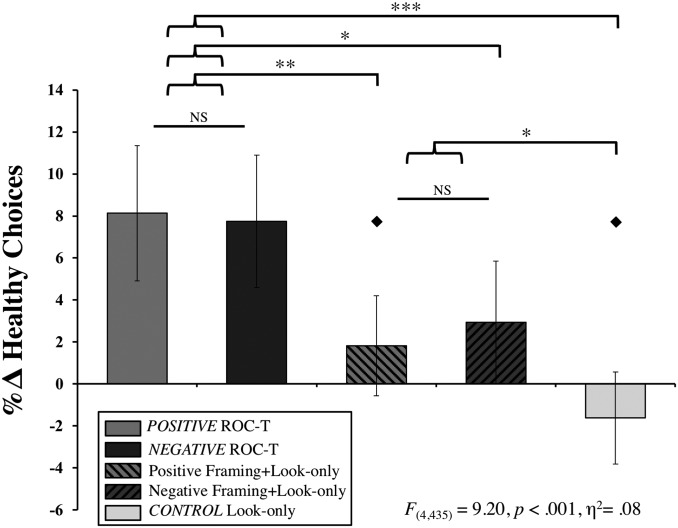
Obesity rates continue to rise alarmingly, with dire health implications. One contributing factor is that individuals frequently forgo healthy foods in favor of inexpensive, high-calorie, unhealthy foods. One important mechanism underlying these choices is food craving: Craving increases with exposure to unhealthy foods (and food cues, such as advertisements) and prospectively predicts eating and weight. Prior work has shown that cognitive regulation strategies that emphasize the negative consequences of unhealthy foods reduce craving. In Studies 1 and 2, we show that cognitive strategies also increase craving for healthy foods by emphasizing their positive benefits, and change food valuation (willingness to pay) for both healthy and unhealthy foods. In Studies 3 and 4, we demonstrate that brief training in cognitive strategies ("Regulation of Craving Training"; ROC-T) increases subsequent healthy (vs. unhealthy) food choices. This was striking because this change in food choices generalized to nontrained items. Importantly, in Study 5, we show that brief training in cognitive strategies also reduces food consumption by 93-121 calories. Consumed calories correlated with changes in food choice. Finally, in Study 6, we show that the training component of ROC-T is necessary, above and beyond any effect of framing. Across all studies (NTOTAL = 1,528), we find that cognitive strategies substantially change craving and food valuation, and that training in cognitive strategies improves food choices by 5.4-11.2% and reduces unhealthy eating, including in obese individuals. Thus, these findings have important theoretical, public health, and clinical implications for obesity prevention and treatment.

Keywords: cognitive strategies; craving; food; obesity; self control.


Conflict of interest statement

The authors declare no conflict of interest.

Figures

Fig. 1.
Fig. 1.
ROC task (Studies 1 and 2). Schematic representation of the ROC task. Participants first saw a fixation cross (duration 0.5 s), followed by the strategy instruction (duration 2.5 s). Specifically, NEGATIVE instructed participants to think about the negative aspects of eating the pictured food (e.g., long-term health consequences, disliking the taste). POSITIVE indicated that they should think about the positive aspects of eating the food (e.g., long-term health benefits, liking the taste). LOOK (just look at the image) served as a control instruction. Instructions were followed by an image of healthy or unhealthy food (duration 6 s), after which participants rated their craving and WTP (4.5 s each). Pizza image courtesy of iStock.com/bhofack2.
Fig. 2.
Fig. 2.
Changes in craving and WTP (Study 1; n = 28). The POSITIVE strategy increased and the NEGATIVE strategy decreased craving (A) and WTP (B) for both healthy and unhealthy foods in Study 1 (college-aged students). F statistics represent the main effects of Instruction. Error bars represent 95% confidence intervals; *P < 0.05; **P < 0.01; ***P < 0.001; NS, not significant.
Fig. 3.
Fig. 3.
Changes in craving and WTP in an online sample (Study 2; n = 242). (A and B) The POSITIVE strategy increased and the NEGATIVE strategy decreased craving (A) and WTP (B) for both healthy and unhealthy foods. (C and D) Additionally, BMI correlated with craving (C) and WTP (D) for unhealthy but not for healthy foods. F statistics represent the main effects of Instruction. Error bars represent 95% confidence intervals; ***P < 0.001.
Fig. 4.
Fig. 4.
Food choice and ROC-T procedures (Studies 3 and 4). Schematic representation of the procedures. Before and after ROC-T, participants completed 108 choices, 72 of which were between healthy and unhealthy foods (other choices were between healthy vs. healthy or between unhealthy vs. unhealthy foods). All images were presented evenly within each task. During ROC-T, participants were randomized into one of three possible conditions, following the ROC task in Studies 1 and 2, namely, (A) POSITIVE ROC-T, (B) NEGATIVE ROC-T, or (C) CONTROL (look-only). In the CONTROL condition, participants saw the same images shown in either the POSITIVE or NEGATIVE training conditions (SI Appendix, SI Methods). Pizza image courtesy of iStock.com/bhofack2. Watermelon image courtesy of iStock.com/Boonchuay1970. Donut image courtesy of iStock.com/Sergey Skleznev.
Fig. 5.
Fig. 5.
Percent of change (Δ%) in healthy choices after ROC-T (Studies 3 and 4; n = 754). (A) Both POSITIVE and NEGATIVE ROC-T increased healthy food choices compared with CONTROL in Study 3. (B) Study 4 replicated these findings. F statistics represent the Time × Condition interactions. Error bars represent 95% confidence intervals; *P < 0.05; ***P < 0.001; NS, not significant.
Fig. 6.
Fig. 6.
Change in food choice and caloric consumption after ROC-T (Study 5; n = 64). (A and B) Compared with CONTROL, POSITIVE, and NEGATIVE ROC-T increased healthy food choices (A) (F statistic represents the Time × Condition interaction) and reduced total and unhealthy caloric consumption (B) (F statistic represents the main effect of Condition). (C) Greater increase in healthy food choice correlated with reduced caloric consumption after ROC-T. Error bars represent 95% confidence intervals; *P < 0.05; **P < 0.01; NS, not significant.
Fig. 7.
Fig. 7.
Schematic representation of conditions (Study 6).
Fig. 8.
Fig. 8.
Percent change in healthy choices (Study 6; n = 440). Both POSITIVE and NEGATIVE ROC-T increased healthy food choices significantly more than Positive or Negative Framing+look-only and CONTROL. F statistic represents the Time × Condition interaction. Error bars represent 95% confidence intervals; ◆, no significant difference from the first to the second Choice Task; *P < 0.05; **P < 0.01; ***P < 0.001; NS, not significant.

Comment in

References

    1. Swinburn BA, et al. The global obesity pandemic: Shaped by global drivers and local environments. Lancet. 2011;378:804–814. - PubMed
    1. Flegal KM, Kruszon-Moran D, Carroll MD, Fryar CD, Ogden CL. Trends in obesity among adults in the United States, 2005 to 2014. JAMA. 2016;315:2284–2291. - PMC - PubMed
    1. Masters RK, Powers DA, Link BG. Obesity and US mortality risk over the adult life course. Am J Epidemiol. 2013;177:431–442. - PMC - PubMed
    1. Hall KD, et al. Quantification of the effect of energy imbalance on bodyweight. Lancet. 2011;378:826–837. - PMC - PubMed
    1. Gearhardt AN, et al. Obesity and public policy. Annu Rev Clin Psychol. 2012;8:405–430. - PubMed

Publication types