Excessive tubulin polyglutamylation causes neurodegeneration and perturbs neuronal transport
- PMID: 30420556
- PMCID: PMC6276888
- DOI: 10.15252/embj.2018100440
Excessive tubulin polyglutamylation causes neurodegeneration and perturbs neuronal transport
Abstract
Posttranslational modifications of tubulin are emerging regulators of microtubule functions. We have shown earlier that upregulated polyglutamylation is linked to rapid degeneration of Purkinje cells in mice with a mutation in the deglutamylating enzyme CCP1. How polyglutamylation leads to degeneration, whether it affects multiple neuron types, or which physiological processes it regulates in healthy neurons has remained unknown. Here, we demonstrate that excessive polyglutamylation induces neurodegeneration in a cell-autonomous manner and can occur in many parts of the central nervous system. Degeneration of selected neurons in CCP1-deficient mice can be fully rescued by simultaneous knockout of the counteracting polyglutamylase TTLL1. Excessive polyglutamylation reduces the efficiency of neuronal transport in cultured hippocampal neurons, suggesting that impaired cargo transport plays an important role in the observed degenerative phenotypes. We thus establish polyglutamylation as a cell-autonomous mechanism for neurodegeneration that might be therapeutically accessible through manipulation of the enzymes that control this posttranslational modification.
Keywords: axonal transport; neurodegeneration; tubulin code; tubulin polyglutamylation; tubulin posttranslational modifications.
© 2018 The Authors.
Figures

Fate of Purkinje cells in mice with Purkinje‐cell‐specific knockout of Ccp1. Ccp1 flox/flox L7‐cre mice show a massive but incomplete degeneration of Purkinje cells (calbindin‐stained; red) at 4 months, while all Purkinje cells are degenerated at 18 months. Scale bar: 500 μm.
Schematic representation of enzymatic tubulin polyglutamylation (red points are glutamate residues that are posttranslationally added to C‐terminal tails of α‐ and β‐tubulin). In neurons, TTLL1 is generating a large share of the overall polyglutamylation (Janke et al, 2005), and CCP1 is reversing this PTM. Loss of CCP1 induces TTLL1‐mediated hyperglutamylation, which can be avoided by TTLL1 inactivation.
Fate of Purkinje cells in mice with combinatorial knockout alleles. Knockout of Ccp1 (pcd mouse; Ccp1 −/−) results in a complete degeneration of Purkinje cells (calbindin‐stained; red), while the additional knockout of Ttll1 selectively in the Purkinje cells (L7‐cre) protects the entire Purkinje cell layer from degeneration up to 18 months. Scale bar: 500 μm.
Nissl staining of the Purkinje cell layer of the brains from various knockout mice shown in (C) confirms the absence of Purkinje cells in Ccp1 −/− and the presence of a wild‐type‐like Purkinje cell density in Ccp1 −/− Ttll1 flox/flox L7‐cre mice. Scale bar: 20 μm. Purkinje cell layer (PC) and granule cell layer (GC) are indicated.
Immunoblot of tissue extracts from cerebella of Ttll1 −/− and wild‐type mice, probed with the polyE, anti‐∆2‐tubulin, and 12G10 antibodies. Increasing amounts of extracts were loaded for detection of polyglutamylated proteins with polyE.
Schematic representation of the experimental paradigm applied in this figure. The thick line in the cerebella symbolizes the Purkinje cell layer.

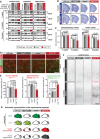
Immunoblot analyses of tubulin polyglutamylation (antibody: polyE) in extracts of different brain regions of wild‐type, Ccp1 −/−, Ccp6 −/−, and Ccp1 −/− Ccp6 −/− mice. In 3‐week‐old mice, hyperglutamylation is observed in cerebral cortex, cerebellum, and hippocampus of Ccp1 −/− and Ccp1 −/− Ccp6 −/− mice. In 2‐ and 5‐month‐old mice, hyperglutamylation is restricted to the cerebellum in Ccp1 −/− mice; however, it persists in all three brain regions of the Ccp1 −/− Ccp6 −/− mice (complete analysis in Fig EV1; α‐ and β‐tubulin bands are indicated).
Nissl‐stained frontal sections of wild‐type, Ccp1 −/−, Ccp6 −/−, and Ccp1 −/− Ccp6 −/− mice at 1 and 5 months, showing age‐dependent thinning (arrowheads) of the cortex in Ccp1 −/− Ccp6 −/− mice (complete analysis in Appendix Fig S2A).
Quantification of the thickness of motor and somatosensory cortex of 1‐ and 5‐month‐old mice shown in Appendix Fig S2. The single values shown in Appendix Fig S2B were averaged, and values from each genotype‐specific group were tested against the average values of the remaining three genotypes (Appendix Fig S2C). Only the cortical thickness of 5‐month‐old Ccp1 −/− Ccp6 −/− mice is significantly decreased (mean ± SEM; Mann–Whitney t‐test).
Immunohistochemistry of brain sections with anti‐MAP2 antibody for visualization of neurons (layer V) and apical dendrites (layer IV) and with anti‐GFAP antibody for reactive astrocytes (layer V). The complete analysis is shown in Figs EV2A and EV3A. Scale bars: 50 μm.
Quantifications of number of MAP2‐positive neurons in layer V and of number of apical dendrites in layer IV (Fig EV2B) reveal reduced neuron number in layer V and reduced dendritic density in layer IV of 5‐month‐old Ccp1 −/− Ccp6 −/− mice. Quantification of the number of reactive astrocytes in layer V (Fig EV3B) shows a significant increase over wild‐type in Ccp1 −/− and Ccp6 −/− mice; however, a much stronger increase is seen in Ccp1 −/− Ccp6 −/− mice. Complete analyses are shown in Figs EV2C and EV3C (mean ± SEM; Student's t‐test).
Immunohistochemistry of brain sections stained with SMI‐32 antibody (a representative section of one brain per genotype group is shown, complete analysis in Appendix Fig S3). Neuronal SMI‐32 labeling indicates increased axonal damage in the cortex of Ccp1 −/− Ccp6 −/− mice at 5 months. Scale bar: 100 μm.
Schematic representation of the experimental paradigm applied in this figure.
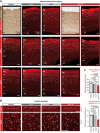
Immunohistochemistry of sagittal sections of frontal cerebral cortex of 5‐month‐old wild‐type, Ccp1 −/−, Ccp6 −/−, and Ccp1 −/− Ccp6 −/− mice stained with anti‐MAP2 antibody to label pyramidal neurons. The number of positive cells was quantified in randomly placed squares (40,000 μm2) in layer V of motor cortex (dotted boxes). Three square areas were quantified in each section. The number of apical dendrites was determined in layer IV of the motor cortex by counting the average number of intersections of apical dendrites with three randomly drawn 200‐μm lines (dotted lines) as shown in (B). Two to four sections per animal were analyzed in three mice of each genotype. Scale bars: 100 μm. CC indicates corpus callosum.
Example of the analysis paradigm used for the quantification of apical dendrites in layer IV (upper panels) and neuron number in layer V (lower panels). Scale bars: 50 μm.
Analyses of number of MAP2‐positive neurons in layer V, and number of apical dendrites in layer IV. Mean values ± SEM are plotted, and significance was tested by Student's t‐test. All P‐values are indicated. A summary of these diagrams focussing on the significant changes is shown in Fig 2E.
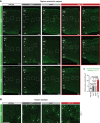
Immunohistochemistry of sagittal sections of frontal cerebral cortex of 5‐month‐old wild‐type, Ccp1 −/−, Ccp6 −/−, and Ccp1 −/− Ccp6 −/− mice stained with anti‐GFAP antibody to label reactive astrocytes. The number of positive cells was quantified in randomly placed squares (40,000 μm2) in layer V of motor cortex (dotted boxes) as shown in (B). Three square areas were quantified in each section. Two to four sections per animal were analyzed in three mice of each genotype. Scale bars: 100 μm. CC indicates corpus callosum.
Example of the quantification of the number of reactive astrocytes in (A). Scale bar: 50 μm.
Analyses of numbers of GFAP‐positive astrocytes in layer V. Mean values ± SEM are plotted, and significance was tested by Student's t‐test. All P‐values are indicated. A summary of this diagram focussing on the significant changes is shown in Fig 2E.


Fate of Purkinje cells in 1‐month‐old wild‐type, spastin −/−, Ccp1 −/−, and Ccp1 −/− spastin −/− mice visualized with anti‐calbindin antibody. Ccp1 −/− and Ccp1 −/− spastin −/− mice show almost complete loss of the Purkinje cell layer. Scale bar: 500 μm.
Nissl staining shows the complete loss of Purkinje cells in Ccp1 −/− and Ccp1 −/− spastin −/− mice. Scale bar: 20 μm. Purkinje cell layer (PC) and granule cell layer (GC) are indicated.
Calbindin staining of sections showing axons of Purkinje cells as in (A). While wild‐type and spastin −/− mice show normal axons, Ccp1 −/− and Ccp1 −/− spastin −/− mice show axonal swellings (arrowheads) in the remaining Purkinje cells. Scale bars: 20 μm.

- A
Representation of the analysis scheme for axonal transport of mitochondria in Ccp1 flox/flox Ccp6 flox/flox neurons. Hippocampal neurons from E17.5 embryos were cultured and transduced (on DIV0) with lentivirus expressing either GFP (control) or GFP‐2A‐cre (inducing conversion to Ccp1 −/− Ccp6 −/−). At DIV4, live neurons were stained with MitoTracker™ and mitochondria were imaged in GFP‐positive cells for 1 min with a spinning disk microscope. Mitochondrial movements were plotted in kymographs for all the cells analyzed in each set and broken down into single runs without change in direction or speed. Anterograde and retrograde runs were color‐coded in green and red, respectively, while immotile events are shown in blue.
- B
Immunoblot of cell extracts from Ccp1 flox/flox Ccp6 flox/flox hippocampal neurons without or after transduction with lentivirus expressing either GFP or GFP‐2A‐cre after 4 days in culture. Note the specific increase of polyglutamylation (polyE) in neurons transduced with GFP‐2A‐cre lentivirus.
- C–E
(C) All kymographs of one representative set of experiments. Mitochondrial movements (Movie EV1) were plotted in kymographs and analyzed as described in (A). Scale bars: 60 sec, 20 μm. Analyses of (D) run length and (E) speed distribution, represented as scatter dot plots with each point representing a single run extracted from the kymographs shown in (C). Each group represents the pool of measurement of multiple neurons made in the experiment. The black line indicates the median of the distribution with whiskers at interquartile range. Numerical value of the medians is indicated below each plot.
- F, G
Overall motility of mitochondria represented as fraction of time mitochondria spent in movement relative to the total number of mitochondria during the recording time of 60 s. Values (below plots) from one set of experiment (C) show a decrease of about 50% in Ccp1 −/− Ccp6 −/− conditions, while (G) mitochondrial density is unaltered.
- H–K
Statistical analyses of mitochondrial transport parameters of experiments shown in (D–G; Fig EV4A–D). Each bar represents the mean (± SEM) of medians of single experiments for run length (H) and speed (I) distributions, and average (± SEM) mitochondrial motility (J) and density (K) of all seven experimental sets. Values of fold change between control and Ccp1 −/− Ccp6 −/− conditions are indicated below the graphs. Green bars are for anterograde, and red for retrograde transport events. Significance was tested using unpaired t‐test. Average run length (H) as well as speed (I) showed no significant differences in these two parameters between control and Ccp1 −/− Ccp6 −/− conditions. (J) The average of overall motility reveals an about 50% decrease in overall mitochondrial motility, while mitochondrial density (K) is unaltered between control and Ccp1 −/− Ccp6 −/− conditions.
- A, B
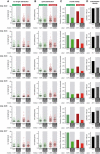
(A) Run length and (B) speed measurements are represented as scatter dot plots with each point representing a single particle movement without change in direction or speed (run). Each group represents the pool of measurement of multiple neurons made in one experiment. The black line indicates the median of the distribution with whiskers at interquartile range. The numerical value of the median is shown below each plot.
- C
Overall motility of mitochondria represented as fraction of time mitochondria spent in movement relative to the total number of mitochondria present during the recording time of 60 s. Values for single experiment are shown below plots.
- D
Mitochondria densities found in single experiments (values are shown below plots). See Appendix Table S3 for detailed data on all experimental sets analyzed.
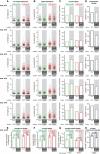
- A, B
(A) Run length and (B) speed measurements are represented as scatter dot plots with each point representing a single particle movement without change in direction or speed (run). Each group represents the pool of measurement of multiple neurons made in one experiment. The black line indicates the median of the distribution with whiskers at interquartile range. The numerical value of the median is shown below each plot.
- C
Overall motility of mitochondria represented as fraction of time mitochondria spent in movement relative to the total number of mitochondria present during the recording time of 60 s. Values for single experiment are shown below plots.
- D
Mitochondria densities found in single experiments (values are shown below plots).
- E–H
Statistical analyses of mitochondria transport parameters of five independent experiments shown in (A–D). Each bar represents the mean (± SEM) of medians of single experiments for run length (E) and speed (F) distributions, and average (± SEM) mitochondria motility (G) and density (H). Green bars are for anterograde, and red for retrograde transport events. Significance was tested using unpaired t‐test. Average run length (E), run speed (F), overall motility (G), and mitochondria density (H) show no significant differences between GFP‐ and GFP‐2A‐cre‐transduced conditions. See Appendix Table S3 for detailed data on all experimental sets analyzed.
Comment in
-
Neurodegenerative polyglutamylation.Nat Rev Mol Cell Biol. 2019 Jan;20(1):1. doi: 10.1038/s41580-018-0083-1. Nat Rev Mol Cell Biol. 2019. PMID: 30443035 No abstract available.
-
Microtubules and Neurodegeneration: The Tubulin Code Sets the Rules of the Road.Curr Biol. 2019 Jan 7;29(1):R28-R30. doi: 10.1016/j.cub.2018.11.031. Curr Biol. 2019. PMID: 30620913
References
-
- Audebert S, Koulakoff A, Berwald‐Netter Y, Gros F, Denoulet P, Eddé B (1994) Developmental regulation of polyglutamylated alpha‐ and beta‐tubulin in mouse brain neurons. J Cell Sci 107: 2313–2322 - PubMed
Publication types
MeSH terms
Substances
LinkOut - more resources
Full Text Sources
Other Literature Sources
Medical
Molecular Biology Databases

