. 2018 Nov 12;9(1):4748.
doi: 10.1038/s41467-018-07200-2.

Genotype specific pathogenicity of hepatitis E virus at the human maternal-fetal interface

Affiliations

Genotype specific pathogenicity of hepatitis E virus at the human maternal-fetal interface

Jordi Gouilly et al. Nat Commun. .

Abstract

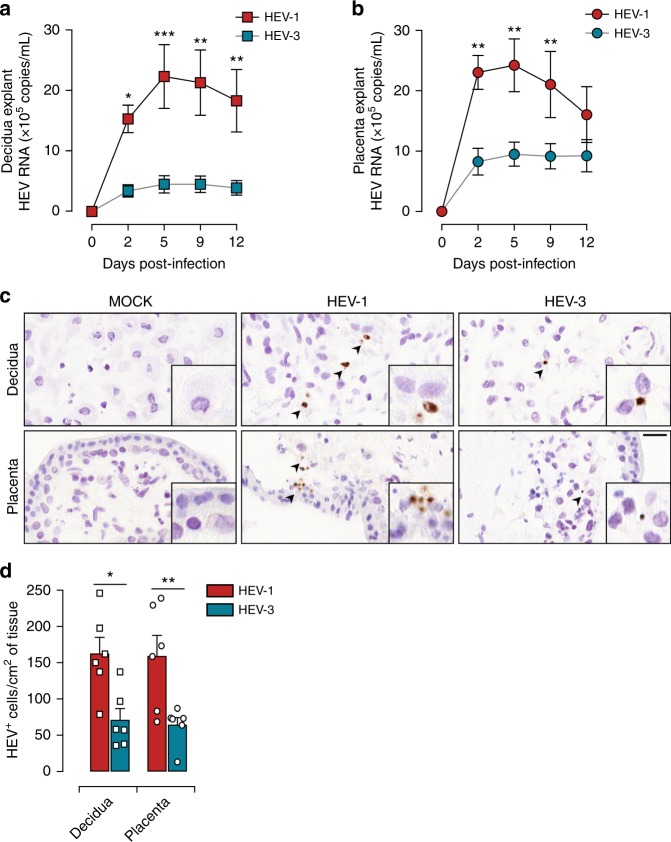
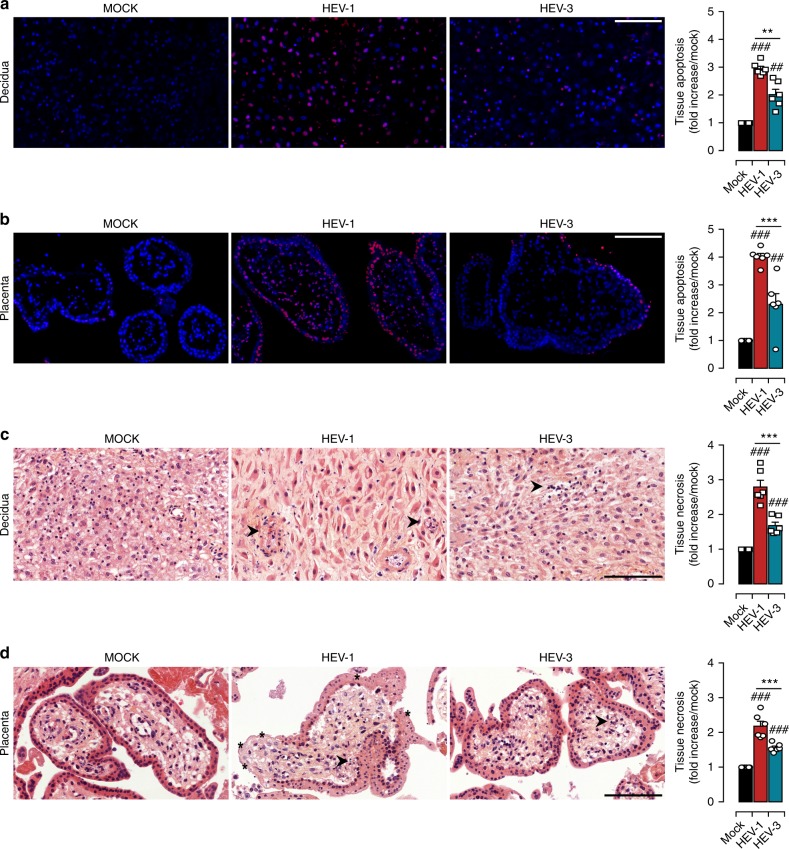
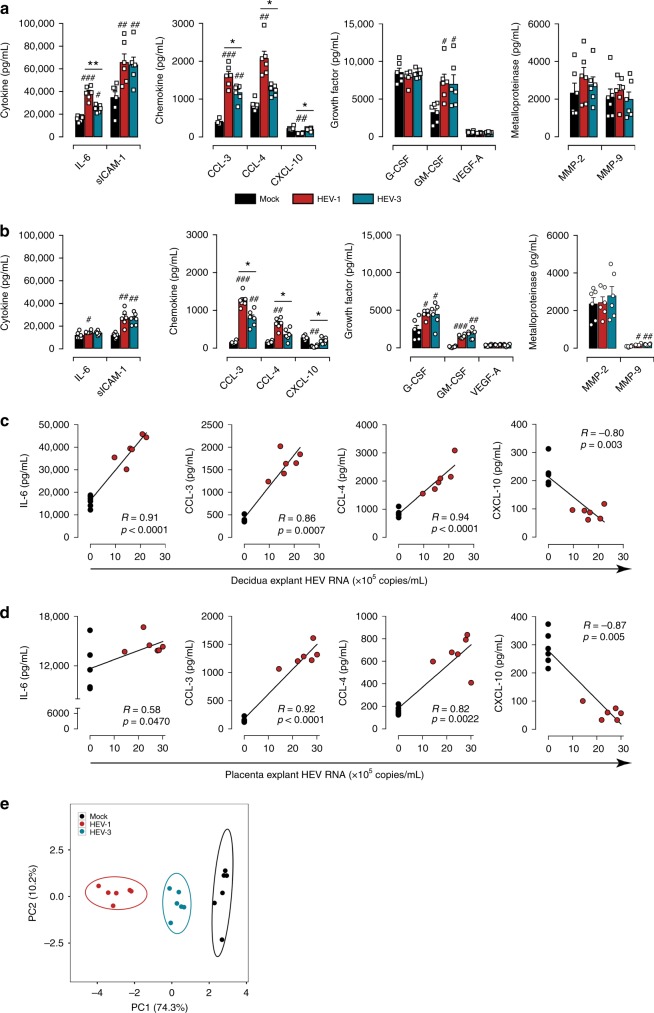
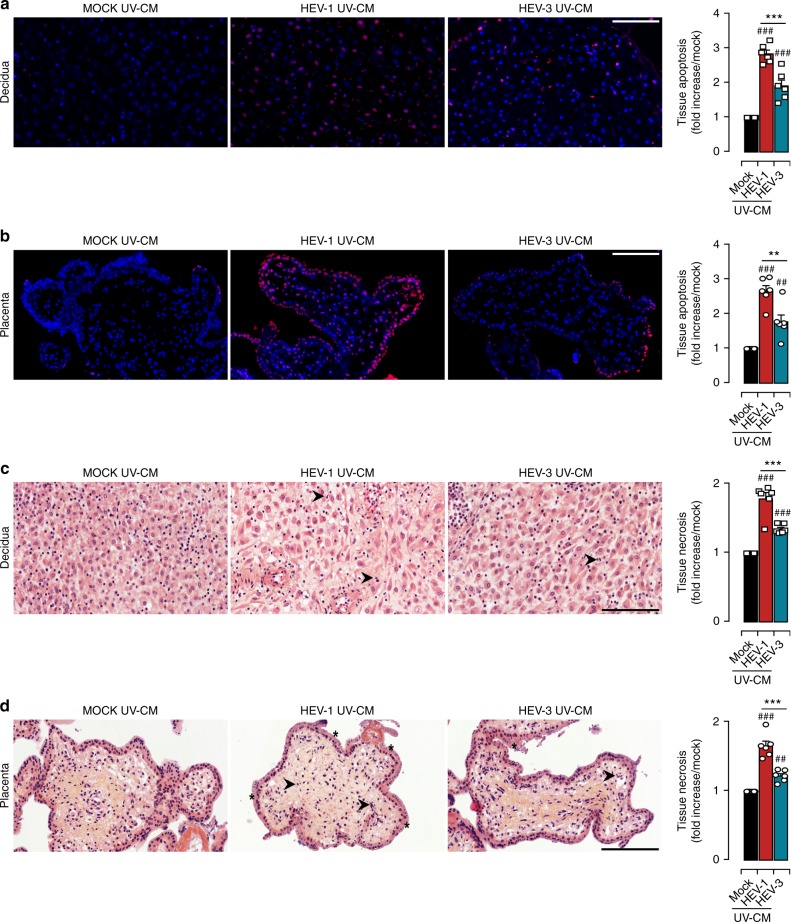
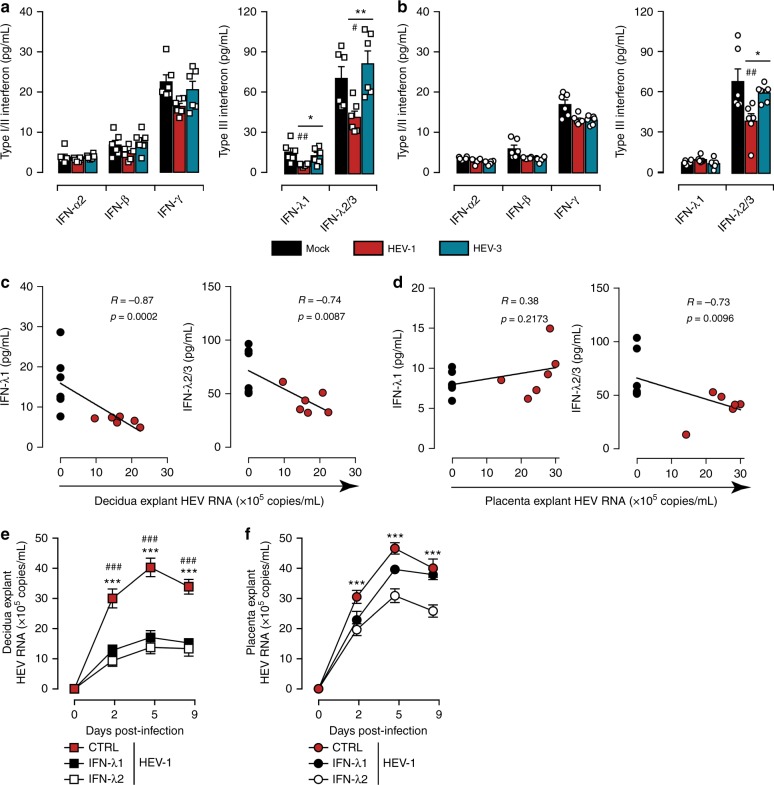
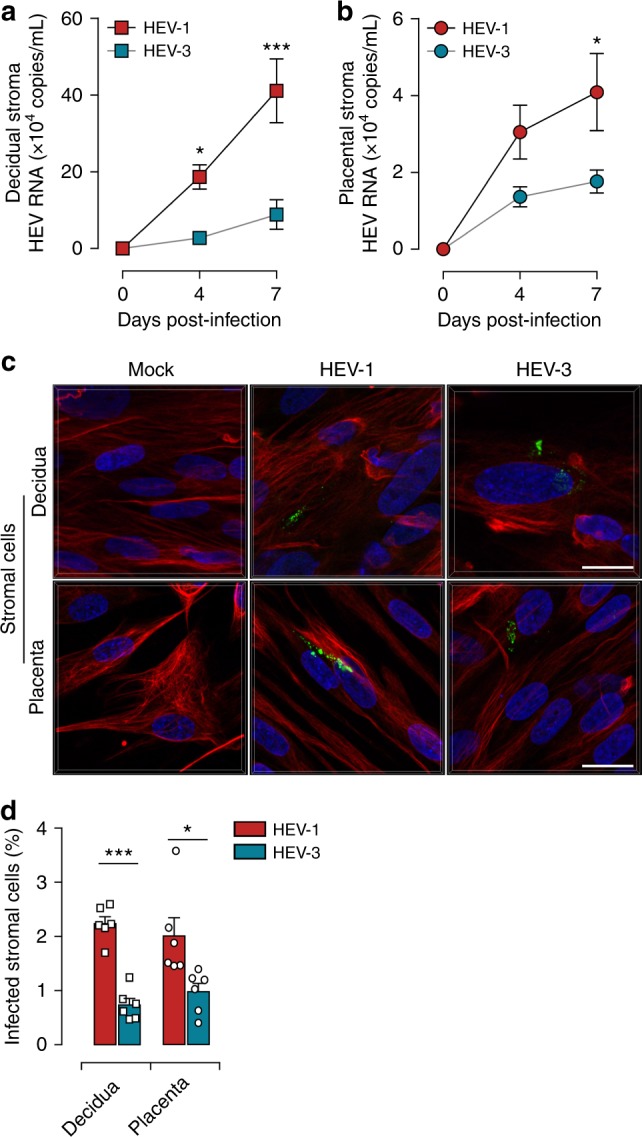
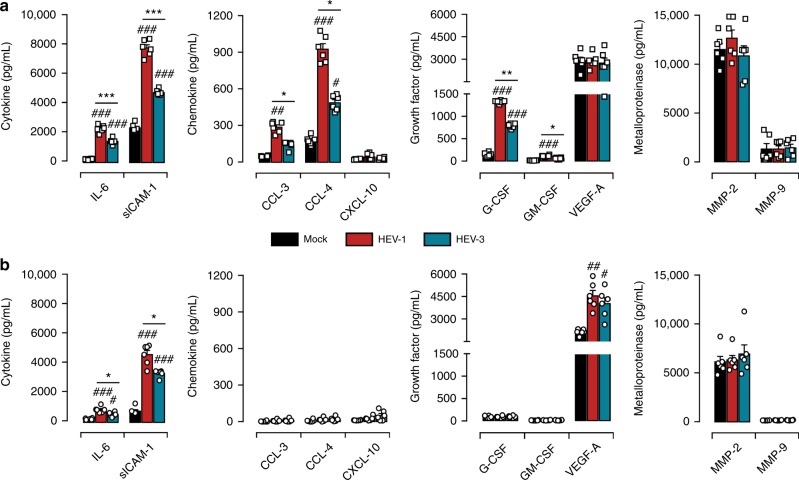
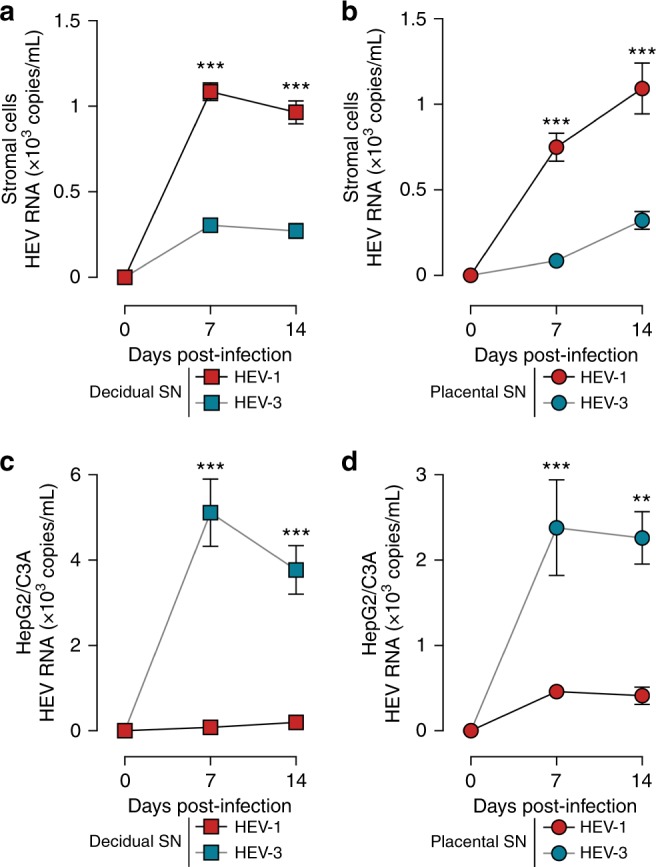
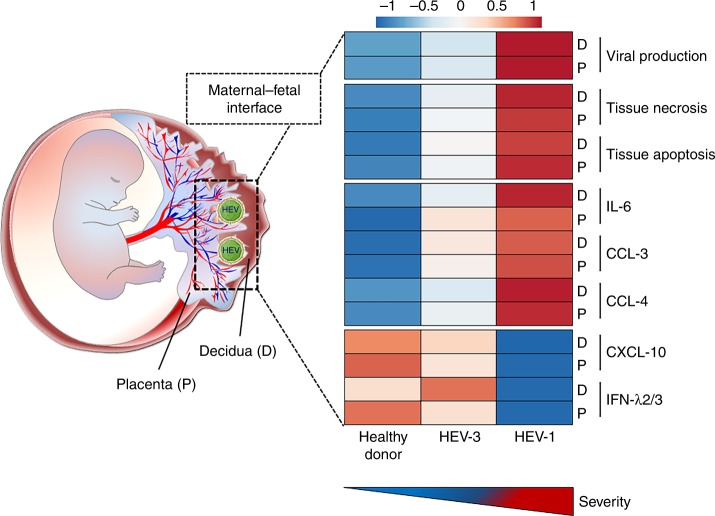
Hepatitis E virus (HEV) infection, particularly HEV genotype 1 (HEV-1), can result in fulminant hepatic failure and severe placental diseases, but mechanisms underlying genotype-specific pathogenicity are unclear and appropriate models are lacking. Here, we model HEV-1 infection ex vivo at the maternal-fetal interface using the decidua basalis and fetal placenta, and compare its effects to the less-pathogenic genotype 3 (HEV-3). We demonstrate that HEV-1 replicates more efficiently than HEV-3 both in tissue explants and stromal cells, produces more infectious progeny virions and causes severe tissue alterations. HEV-1 infection dysregulates the secretion of several soluble factors. These alterations to the cytokine microenvironment correlate with viral load and contribute to the tissue damage. Collectively, this study characterizes an ex vivo model for HEV infection and provides insights into HEV-1 pathogenesis during pregnancy that are linked to high viral replication, alteration of the local secretome and induction of tissue injuries.


Conflict of interest statement

The authors declare no competing interests.

Figures

Fig. 1
Fig. 1
HEV-1 replicates efficiently in decidual and placental tissues. a, b Kinetics of HEV virus production from explants established from the decidua a and placenta b, infected with HEV-1 (red), or HEV-3 (cyan). RNA levels were measured in tissue culture supernatants by RT-qPCR. c, d Histological analyses of tissue sections stained by HEV in situ hybridization (ISH) and prepared from mock, HEV-1, or HEV-3 infected explants 5 days post infection. c Representative field of view of explant material derived from the decidua (upper panel) and placenta (lower panel). Arrowheads point to HEV positive cells (in brown) and boxes represent enlarged areas with characteristic staining patterns. Scale bar, 20 µm. d Bar graph illustrating the number of HEV positive cells per cm2 of tissue determined by ISH staining in HEV-1 (red) or HEV-3 (cyan) infected tissue explants. Data represent mean values ± S.E.M. of six independent donors. * denotes a statistical comparison between HEV-1 and HEV-3 infected tissues. *P < 0.05; **P < 0.01; ***P < 0.001 by two-way ANOVA with Bonferroni post hoc test a, b and paired t-test d
Fig. 2
Fig. 2
HEV-1 causes severe injury in decidual and placental tissues. Histological analyses of apoptosis (TUNEL staining, a, b) and necrosis (H&E staining, c, d) in explants sections prepared from mock, HEV-1, or HEV-3 infected tissues, 5 days post infection. a, b Representative large field of view of TUNEL stained sections prepared from the decidua a and placenta b. Staining indicates the apoptotic cells (red) and nuclei (blue). Scale bar, 100 µm. Bar graph illustrates the increase of tissue apoptosis in HEV-1 (red) or HEV-3 (cyan) infected tissue explants, compared to levels detected in mock-infected tissue explants (black) and represented as fold increase. c, d Representative large field of view of H&E stained sections prepared from the decidua c and placenta d. Arrowheads point to necrotic zones with nuclear changes illustrated by pyknosis, karyorrhexis, and karyolysis. Stars indicate an injured syncytiotrophoblast layer. Scale bar, 100 µm. Bar graph illustrates the increase of tissue necrosis in HEV-1 (red) or HEV-3 (cyan) infected tissue explants, compared to levels detected in mock-infected tissue explants (black) and represented as fold increase. Data represent mean values ± S.E.M. of six independent donors. * denotes a statistical comparison between HEV-1 and HEV-3 infected tissues and # represents a statistical comparison between mock and HEV-1 or HEV-3 infected tissues. **/##P < 0.01; ***/###P < 0.001 by repeated measures ANOVA with Tukey post hoc test
Fig. 3
Fig. 3
HEV-1 infection of decidual and placental tissues skews their secretory function. a, b Cytokine, chemokine, growth factor, and metalloproteinase secretion from explants established from either decidua a or placenta b, measured by multiplex assay in culture supernatants 2 days after infection with HEV-1 (red) or HEV-3 (cyan). Black bars represent mock-infected tissues. c, d Correlation between IL-6, CCL-3, CCL-4, or CXCL-10 secretion and viral production in the decidua c and placenta d 2 days after HEV-1 infection. Black and red points represent mock-, and HEV-1-infected tissues, respectively. The Spearman’s rank correlation test P-value and R coefficient are indicated in each graph. e Principal component analysis (PCA) of IL-6, CCL-3, CCL-4, and CXCL-10 secretion in the decidua and placenta, 2 days after mock (black), HEV-1 (red), or HEV-3 (cyan) infection. Values were centered, unit variance scaling was applied to rows and single value decomposition with imputation was used to calculate principal components. X and Y axis show PC1 and PC2 that explain 74.3% and 10.2% of the total variance, respectively. Prediction ellipses are such that, with probability of 0.95, a new observation from the same group will fall inside the ellipse. Data represent mean values ± S.E.M. of six independent donors. * denotes a statistical comparison between HEV-1 and HEV-3 infected tissue. # represents a statistical comparison between mock and HEV-1 or HEV-3 infected tissues. */#P < 0.05; **/##P < 0.01; ###P < 0.001 by repeated measures ANOVA with Tukey post hoc test
Fig. 4
Fig. 4
HEV-1 altered secretome contributes to tissue damage. Histological analyses of apoptosis (TUNEL staining, a, b) and necrosis (H&E staining, c, d) and in explants sections prepared from tissues challenged for 5 days with either Mock, HEV-1, or HEV-3 UV-irradiated conditioned media (CM). a, b Representative large field of view of TUNEL stained sections prepared from the decidua a and placenta b. Staining indicates the apoptotic cells (red) and nuclei (blue). Scale bar, 100 µm. Bar graph illustrates the increase of tissue apoptosis in explants challenged for 5 days with either HEV-1 (red) or HEV-3 (cyan) UV-CM. Results are normalized to data obtained using UV-CM harvested from mock-infected explants (black) and represented as fold increase. c, d Representative large field of view of H&E stained sections prepared from the decidua c and placenta d. Arrowheads point to necrotic zones with nuclear changes illustrated by pyknosis, karyorrhexis, and karyolysis. Stars indicate an injured syncytiotrophoblast layer. Scale bar, 100 µm. Bar graph illustrates the increase of tissue necrosis in explants challenged for 5 days with either HEV-1 (red) or HEV-3 (cyan) UV-CM. Results are normalized to data obtained using UV-CM harvested from mock-infected explants (black) and represented as fold increase. Data represent mean values ± S.E.M. of six independent donors. * denotes a statistical comparison between HEV-1 and HEV-3 infected tissues and # represents a statistical comparison between mock and HEV-1 or HEV-3 infected tissues. **/##P < 0.01; ***/###P < 0.001 by repeated measures ANOVA with Tukey post hoc test
Fig. 5
Fig. 5
HEV-1 replication is associated with a decrease in type III interferon levels. a, b Type I/II and type III interferon secretion from explants established from either decidua a or placenta b, measured by cytometric bead array in culture supernatants 2 days after infection with HEV-1 (red) or HEV-3 (cyan). Black bars represent mock-infected tissues. Data represent mean values ± S.E.M. of six independent donors. * denotes a statistical comparisons made between HEV-1 and HEV-3 infected tissue, and # represents a statistical comparison between mock-infected and HEV-1 or HEV-3 infected tissue. */#P < 0.05; **/##P < 0.01. c, d Correlation between IFN-λ1, or IFN-λ2/3 secretion and viral production in the decidua c and placenta d 2 days after HEV-1 infection. Black and red points represent mock-, and HEV-1-infected tissues, respectively. The Spearman’s rank correlation test P-value and R-coefficient are indicated in each graph. e, f Kinetics of HEV virus production from explants established from the decidua e and placenta f, infected with HEV-1. After infection, tissues were left untreated (CTRL, in red), treated with IFN-λ1 (100 ng/mL, in black) or treated with IFN-λ2 (100 ng/mL, in white). RNA levels were then measured in tissue culture supernatants by RT-qPCR. Data represent means values ± S.E.M. of three independent donors. * denotes a statistical comparison between CTRL- and IFN-λ2-treated infected tissues. # denotes a statistical comparison between CTRL- and IFN-λ1-treated infected tissues. ***/###P < 0.001 by repeated measures ANOVA with Tukey post hoc test a, b and two-way ANOVA with Bonferroni post hoc test e, f
Fig. 6
Fig. 6
Primary decidual and placental stromal cells are targets of HEV-1 infection at the maternal-fetal interface. a, b Kinetics of viral RNA production in stromal cells derived from the a decidua or b placenta, infected with either HEV-1 (red) or HEV-3 (cyan). Virus production was determined by RT-qPCR in culture supernatants. c Representative images of stromal cells derived from the decidua (upper panel) or placenta (lower panel), 7 days after mock, HEV-1, or HEV-3 infection. 3D-reconstituted maximum intensity projections are shown, generated using the Imaris software. Staining indicates the ORF2 viral capsid protein (green), vimentin (red), and nuclei (blue). Scale bar, 20 µm. d Bar graph illustrating the percentage of infected stromal cells derived from the decidua or placenta 7 days after HEV-1 (red) or HEV-3 (cyan) infection and determined by ORF2 staining. Data represent mean values ± S.E.M. of six independent donors. * denotes a statistical comparison made between HEV-1 and HEV-3 infected cells. *P < 0.05; ***P < 0.001 by two-way ANOVA with Bonferroni post hoc test a, b and paired t-test d
Fig. 7
Fig. 7
HEV-1 alters the secretory functions of both decidual and placental stromal cells. a, b Cytokine, chemokine, growth factor, and metalloproteinase secretion in decidual a and placental b stromal cell supernatants, measured by multiplex assay two days after mock (black), HEV-1 (red), or HEV-3 (cyan) infection. Data represent mean values ± S.E.M. of six independent donors. * denotes a statistical comparisons made between HEV-1 and HEV-3 infected tissue, and # represents a statistical comparison between mock-infected and HEV-1 or HEV-3 infected tissue. */#P < 0.05; **/##P < 0.01; ***/###P < 0.001 by repeated measures ANOVA with Tukey post hoc test
Fig. 8
Fig. 8
HEV-1 replication in explants derived from the decidua and placenta generates infectious progeny particles. Freshly isolated stromal cells a, b, or the HepG2/C3A cell line c, d, were challenged with culture supernatants (SN) from either HEV-1 (red), or HEV-3 (cyan) infected decidual a, c, or placental b, d explants. Viral replication was then followed over a 2-week period by RT-qPCR. Data represent means values ± S.E.M. of six independent donors. * denotes a statistical comparison made between HEV-1 and HEV-3 infected cells. **P < 0.01; ***P < 0.001 by two-way ANOVA with Bonferroni post hoc test.
Fig. 9
Fig. 9
Genotype-specific pathogenicity of hepatitis E virus at the human maternal-fetal interface. Graphical abstract summarizing the differences observed between HEV-1 and HEV-3 infection in the maternal decidua basalis (D) and fetal placenta (P). Heatmap was generated using mean values for the different parameters analyzed in each study group

References

    1. Purdy MA, et al. ICTV virus taxonomy profile: hepeviridae. J. Gen. Virol. 2017;98:2645–2646. doi: 10.1099/jgv.0.000940. - DOI - PMC - PubMed
    1. Kamar N, Dalton HR, Abravanel F, Izopet J. Hepatitis E virus infection. Clin. Microbiol. Rev. 2014;27:116–138. doi: 10.1128/CMR.00057-13. - DOI - PMC - PubMed
    1. Lee GH, et al. Chronic infection with camelid hepatitis E virus in a liver transplant recipient who regularly consumes camel meat and milk. Gastroenterology. 2016;150:355–357. doi: 10.1053/j.gastro.2015.10.048. - DOI - PubMed
    1. Pérez-Gracia María Teresa, Suay-García Beatriz, Mateos-Lindemann María Luisa. Hepatitis E and pregnancy: current state. Reviews in Medical Virology. 2017;27(3):e1929. doi: 10.1002/rmv.1929. - DOI - PubMed
    1. Goldenberg RL, Hauth JC, Andrews WW. Intrauterine infection and preterm delivery. N. Engl. J. Med. 2000;342:1500–1507. doi: 10.1056/NEJM200005183422007. - DOI - PubMed

Publication types