. 2018 Nov 12;9(1):4749.
doi: 10.1038/s41467-018-07176-z.

Human adipose glycerol flux is regulated by a pH gate in AQP10

Affiliations

Human adipose glycerol flux is regulated by a pH gate in AQP10

Kamil Gotfryd et al. Nat Commun. .

Abstract

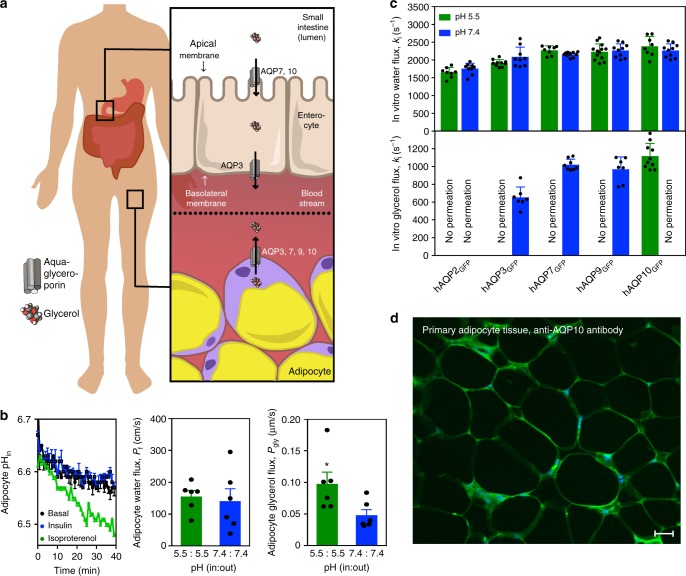
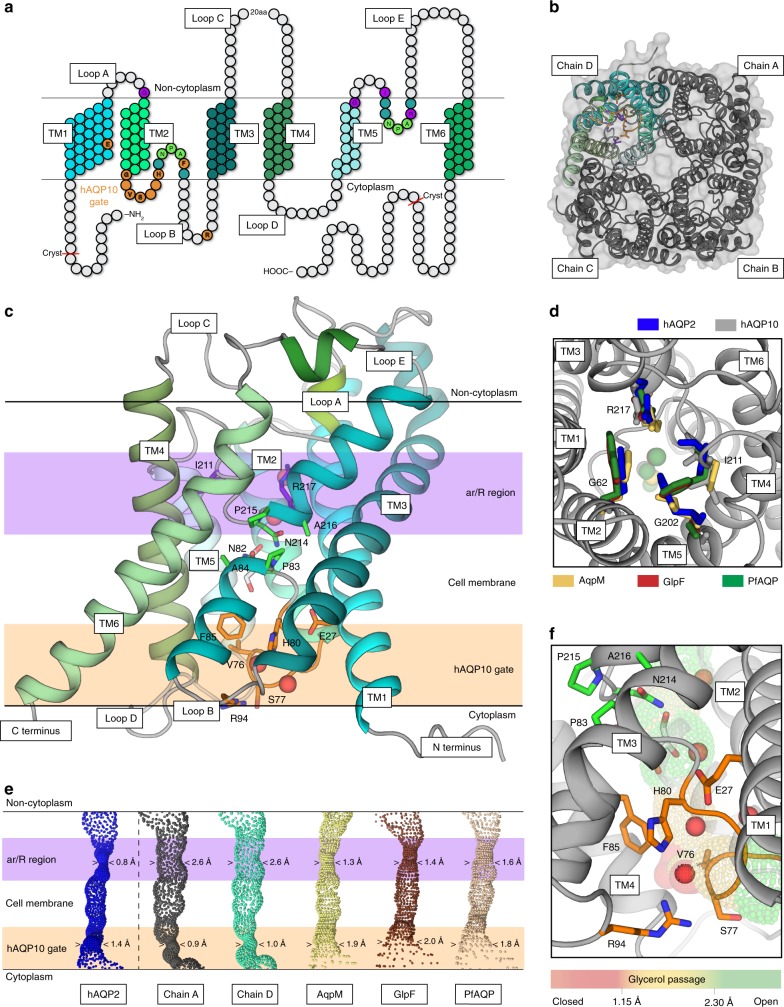
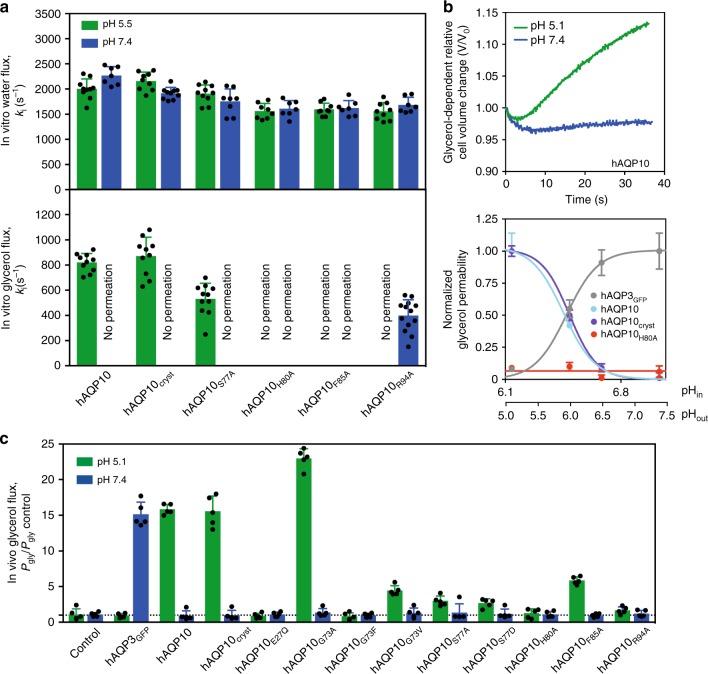
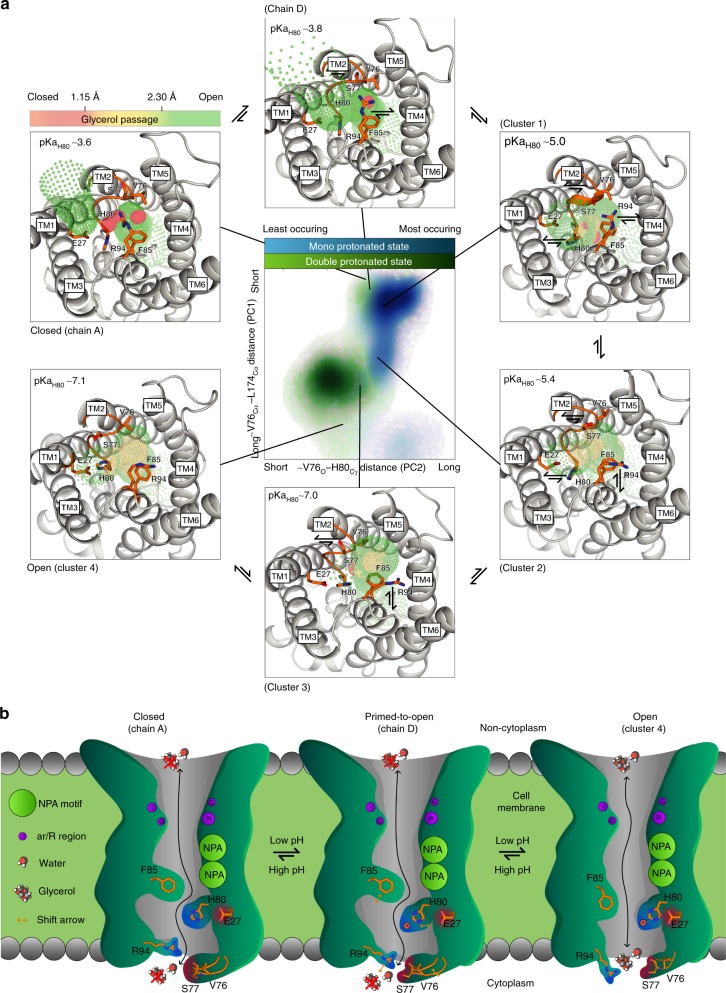
Obesity is a major threat to global health and metabolically associated with glycerol homeostasis. Here we demonstrate that in human adipocytes, the decreased pH observed during lipolysis (fat burning) correlates with increased glycerol release and stimulation of aquaglyceroporin AQP10. The crystal structure of human AQP10 determined at 2.3 Å resolution unveils the molecular basis for pH modulation-an exceptionally wide selectivity (ar/R) filter and a unique cytoplasmic gate. Structural and functional (in vitro and in vivo) analyses disclose a glycerol-specific pH-dependence and pinpoint pore-lining His80 as the pH-sensor. Molecular dynamics simulations indicate how gate opening is achieved. These findings unravel a unique type of aquaporin regulation important for controlling body fat mass. Thus, targeting the cytoplasmic gate to induce constitutive glycerol secretion may offer an attractive option for treating obesity and related complications.


Conflict of interest statement

S.K., M.S., C.H.N., and P.A.P. have interests in Aquaporin A/S. The remaining authors declare no competing interests.

Figures

Fig. 1
Fig. 1
Low pH stimulates human adipocyte glycerol flux through aquaglyceroporin AQP10. a Simplified overview of aquaglyceroporin-mediated regulation of human body glycerol homeostasis. Glycerol absorption in the small intestine (enterocytes) occurs through AQP7 and 10, and via AQP3-mediated excretion into the bloodstream, whereas release into the circulation from fat tissue (adipocytes) involves AQP3, 7, 9 and 10. b Intracellular pH changes in human adipocytes under basal (control, black), lipogenic (insulin, blue) and lipolytic (isoproterenol, green) conditions. Results are given as mean ± SEM. P < 0.001 isoproterenol vs. control and insulin (ANOVA followed by Newman–Keuls’s Q test; N = 3). Water and glycerol permeability of human adipocyte plasma membrane vesicles exposed to glycerol gradient. Flux was measured using identical pH inside and outside: pH 7.4 (blue) or 5.5 (green). Water (Pf) and glycerol (Pgly) permeability coefficients were calculated as described in Methods. Results are given as mean ± SEM. *P = 0.037 vs. 7.4:7.4 (Student’s t-test; N = 6). c Water and glycerol permeability of GFP-fused human aquaporins reconstituted into polymersomes. ki rate constants (s−1) were obtained at pH 7.4 (blue) and pH 5.5 (green). Each bar shows mean ± SD of N = 7–13 measurements performed for the same proteopolymersome sample. Data for shrinking proteopolymersomes indicate lack of glycerol flux and are not shown. See Supplementary Table 2 for a summary of the activity. d AQP10 is membrane-localized to subcutaneous human adipose tissue used for vesicle preparation. Representative immunofluorescence confocal microscopy images with anti-hAQP10 antibody (green) and DAPI staining for nuclei (blue). Scale bar: 200 µm
Fig. 2
Fig. 2
Architecture of human AQP10 and the glycerol-specific gate a Topology of hAQP10 monomer with six transmembrane helices (TM1-6) and five connecting stretches (loops A–E). Residues at the NPA-motifs, the classical ar/R selectivity filter and the cytoplasmic gate are indicated in green, purple and orange (throughout); hAQP10-specific residues in bold. The length of the crystallized form is also highlighted. b The hAQP10 tetramer from the cytoplasmic side, with chains A–C shown in gray and chain D in cyan tones. c Side-view of the primed-to-open monomer (chain D). A single glycerol (sticks) and four water (red spheres) molecules were identified. d The unusually wide ar/R selectivity region of hAQP10 (chain A, gray) compared to those in hAQP2 (blue, pdb-id 4NEF), AqpM (yellow, pdb-id 2F2B), GlpF (brown, pdb-id 1FX8) and PfAQP (wheat, pdb-id 3C02). View from the non-cytoplasmic side. Glycerol molecules in the structures are shown as spheres in equivalent colors. e The channel profiles of selected aquaporins calculated using the software HOLE. hAQP10 chains A (gray) and D (cyan) are compared with increasing minimal diameter from left to right. The cytoplasmic gate and ar/R regions are marked in light orange and purple, respectively. f Close-view of the cytoplasmic and glycerol-specific gate. H80 forms an interaction network work with E27, F85, R94, V76 and S77
Fig. 3
Fig. 3
Functional characterization of human AQP10. a Water and glycerol permeability of hAQP10 forms reconstituted into polymersomes. ki rate constants (s−1) were obtained at pH 7.4 (blue) and pH 5.5 (green). Each bar shows mean ± SD of N = 7–13 measurements performed for the same proteopolymersome sample. Data for shrinking proteopolymersomes indicate lack of glycerol flux and are not shown. See Supplementary Table 2 for a summary of the activity. b Upper plot: Representative time course of the relative cell volume (V/V0) changes after glycerol osmotic shock at pH 5.1 (green) and 7.4 (blue) in hAQP10 expressing yeast cells. Lower plot: pH-dependence of glycerol permeability (Pgly) measured in cells expressing hAQP3GFP (gray) or different hAQP10 forms (cyan, blue and red). Pgly is normalized for each dataset ((Pgly-Pgly control)/Pgly max) and fitted with a Hill equation. Corresponding internal pH (pHin) is also shown (lower axis). Results are given as mean ± SD of at least N = 3 independent experiments. c Glycerol permeability (Pgly) ratio of yeast cells expressing hAQP3GFP or hAQP10 forms measured at pH 5.1 (green) and pH 7.4 (blue). Results are normalized to Pgly of the control strain at the respective pH. Data for hAQP10F85V are not shown due to the uncertainty of precise Pgly estimation at pH 5.1 (Pgly/Pgly control > 30). See Supplementary Fig. 6e for the equivalent water flux data. Results are given as mean ± SD of N = 5 independent experiments
Fig. 4
Fig. 4
Human AQP10 gate opening mechanism. a Cluster and principal component (PC) analysis of membrane-embedded hAQP10 molecular dynamics (MD) simulations with mono (mimicking a relatively high pH) and double (relatively low pH) protonation states of H80 yielding four main clusters (#1–4) of arrangements of the cytoplasmic gate region. A population distribution heat map of the principal components is shown in the central panel, with mono and double protonated frames shown in light blue-to-light blue and green-to-light green gradients, respectively. Simplified, PC1 and PC2 represent the pore-width distances between V76 and L174, and between V76 and H80 (see also Supplementary Figs. 8 and 9). Surroundings panels display crystal structure chains A and D, and representative structures of the MD-predicted clusters (#1–4), from closed to fully open with calculated HOLE profiles shown in traffic-light colors (red-to-green gradient). Indicative pKaH80 values were calculated using PropKa. b Proposed hAQP10 pH-gated glycerol flux mechanism in adipocytes and likely other cell types. Glycerol, but not water, permeation is decreased at pH 7.4. AQP10 glycerol-specific opening is stimulated by pH reduction, triggering H80 protonation that renders the residue to interact with E27. Concerted structural changes of the nearby F85 and the cytoplasmic V76–S77 loop thereby allow glycerol passage

References

    1. Scheen AJ, Van Gaal LF. Combating the dual burden: therapeutic targeting of common pathways in obesity and type 2 diabetes. Lancet Diabetes Endocrinol. 2014;2:911–922. doi: 10.1016/S2213-8587(14)70004-X. - DOI - PubMed
    1. Czech MP. Insulin action and resistance in obesity and type 2 diabetes. Nat. Med. 2017;23:804–814. doi: 10.1038/nm.4350. - DOI - PMC - PubMed
    1. Rosen ED, Spiegelman BM. Adipocytes as regulators of energy balance and glucose homeostasis. Nature. 2006;444:847–853. doi: 10.1038/nature05483. - DOI - PMC - PubMed
    1. Meisner H, Tenney K. pH as an indicator of free fatty acid release from adipocytes. J. Lipid Res. 1977;18:774–776. - PubMed
    1. Civelek VN, Hamilton JA, Tornheim K, Kelly KL, Corkey BE. Intracellular pH in adipocytes: effects of free fatty acid diffusion across the plasma membrane, lipolytic agonists, and insulin. Proc. Natl. Acad. Sci. USA. 1996;93:10139–10144. doi: 10.1073/pnas.93.19.10139. - DOI - PMC - PubMed

Publication types