. 2018 Nov 12;9(11):1125.
doi: 10.1038/s41419-018-1180-y.

Brain injury induces HIF-1α-dependent transcriptional activation of LRRK2 that exacerbates brain damage

Affiliations

Brain injury induces HIF-1α-dependent transcriptional activation of LRRK2 that exacerbates brain damage

Yun-Hee Bae et al. Cell Death Dis. .

Abstract

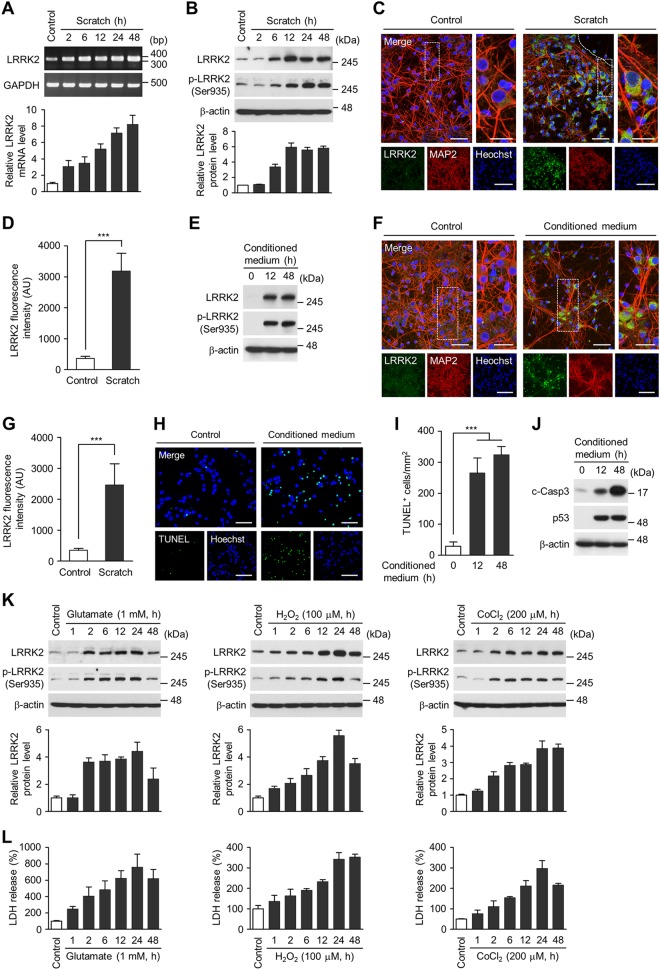
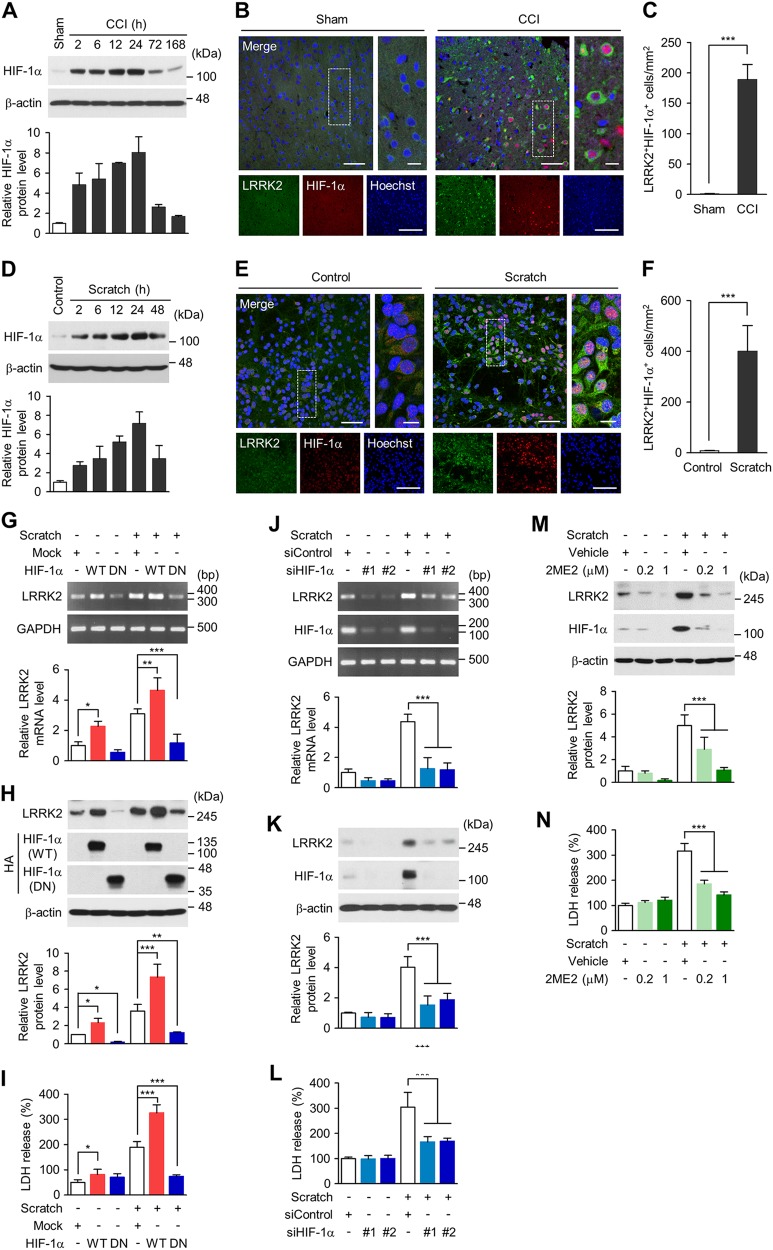
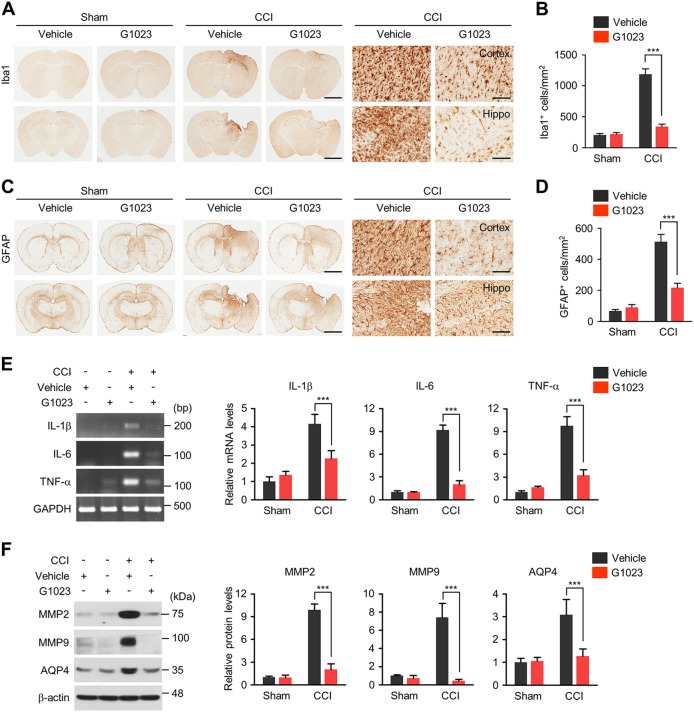
Leucine-rich repeat kinase 2 (LRRK2), originally identified as a causative genetic factor in Parkinson's disease, is now associated with a number of pathologies. Here, we show that brain injury induces a robust expression of endogenous LRRK2 and suggest a role of LRRK2 after injury. We found that various in vitro and in vivo models of traumatic brain injury (TBI) markedly enhanced LRRK2 expression in neurons and also increased the level of hypoxia-inducible factor (HIF)-1α. Luciferase reporter assay and chromatin immunoprecipitation revealed direct binding of HIF-1α in LRRK2 proximal promoter. We also found that HIF-1α-dependent transcriptional induction of LRRK2 exacerbated neuronal cell death following injury. Furthermore, application of G1023, a specific, brain-permeable inhibitor of LRRK2, substantially prevented brain tissue damage, cell death, and inflammatory response and alleviated motor and cognitive defects induced by controlled cortical impact injury. Together, these results suggest HIF-1α-LRRK2 axis as a potential therapeutic target for brain injury.


Conflict of interest statement

The authors declare that they have no conflict of interest.

Figures

Fig. 1
Fig. 1. LRRK2 induction in in vivo TBI models.
Levels of LRRK2 mRNA (a) and total and phospho-S935 (pS935) LRRK2 protein (b) in brain lysates from the ipsilateral side of sham and CCI group. Shown are representative gel images (a, top) or blots (b, top) and quantification of LRRK2 mRNA (a, bottom) and LRRK2 and pS935 LRRK2 protein levels (b, bottom) relative to sham. Bar graph shows means ± s.d. (n = 3). c Nissl staining (upper row) and LRRK2 immunostaining (middle and lower rows) from coronal brain sections of sham and CCI group at 24 h post-injury. Scale bar = 1 mm (upper and middle rows) and 50 μm (lower row). d Numbers of LRRK2-positive cells (per mm2) in pericontusion area of CCI and corresponding area of sham group. Bar graph shows mean ± s.d. (n = 3). Pericontusion areas in the injured brain used for quantification of LRRK2 are shown in right. Scale bar = 1 mm. e–g Sham (left) and CCI-injured (right, at 24 h post-injury) brain sections immunostained with LRRK2 and NeuN (e), Iba1 (f), or GFAP (g) antibodies. Scale bar = 50 μm (left merge), 5  μm (right merge), and 100 μm (lower row). h TUNEL staining and LRRK2 immunostaining in sham (left) and CCI-injured (right, at 24 h post-injury) brain sections. Scale bar = 25  μm (left merge), 5 μm (right merge), and 50 μm (lower low). i Level of LRRK2 mRNA was analyzed by quantitative real-time PCR from postmortem brains of normal subjects (n = 7) and CTE patients (n = 7). Quantification of LRRK2 mRNA level relative to normal is presented as means ± s.d. j Densitometry analysis of LRRK2 immunostaining in neurons (n = 29) of CTE postmortem brain and neurons (n = 26) of normal brain. Means ± s.d. Student t test was performed for all experiments. ***p < 0.001
Fig. 2
Fig. 2. LRRK2 induction in in vitro TBI models.
Levels of LRRK2 mRNA (a) and total and phospho-S935 (pS935) LRRK2 protein levels (b) in control and scratch-injured neurons. Shown are representative gel images (a, top) or blots (b, top) and quantification of LRRK2 mRNA (a, bottom) and LRRK2 and pS935 protein levels (b, bottom) relative to control. Bar graph shows means ± s.d. (n = 3). c Representative images of control (left) and scratch-injured (right, at 48 h post-injury) cortical neurons immunostained with LRRK2 and MAP2 antibodies. Scale bar = 50 μm (left merge), 10 μm (right merge), and 25 μm (lower low). d Quantification of LRRK2 fluorescence intensity in MAP2-positive cells. Bar graph shows mean ± s.d. (n = 3). e–j Conditioned medium was collected from scratch-injured cortical neurons at 6 h post-injury and applied to intact cortical neurons at DIV 10. Intact cortical neurons treated with the conditioned medium were subjected to western blot analysis (e, j) or immunocytochemistry (f, g). e Levels of total and pS935 LRRK2 in cortical neurons after treatment with conditioned medium for 0, 12, and 48 h. f Control (left) and conditioned medium-treated (right) cortical neurons immunostained with LRRK2 and MAP2 antibodies. Scale bar = 50 μm (left merge), 10 μm (right merge), and 20 μm (lower low). g Quantification of LRRK2 fluorescence intensity in MAP2-positive cells. Bar graph shows mean ± s.d. (n = 3). b TUNEL staining in control (left) and conditioned medium-treated (right) cortical neurons. i Numbers of TUNEL-positive cells (per mm2) after treatment with conditioned medium for 0, 12, and 48 h. Bar graph shows mean ± s.d. (n = 3). j Levels of cleaved caspase-3 and p53 after treatment with conditioned medium for 0, 12, and 48 h. k Levels of total and pS935 LRRK2 in cortical neurons treated with 1 mM glutamate, 100 μM H2O2, and 200 μM CoCl2. Shown are representative immunoblots (top) and quantification of LRRK2 protein level (bottom). (l) LDH release assay. Bar graph shows mean ± s.d. (n = 3). Student t test was performed for (d) and (g) and One-way ANOVA followed by Dunnett’s post hoc test was performed for (i). ***p < 0.001. Images presented are representative of at least three independent experiments
Fig. 3
Fig. 3. HIF-1α dependent upregulation of LRRK2.
a Level of HIF-1α protein in brain lysates from the ipsilateral side of sham and CCI group. Shown are representative blots (top) and quantification of HIF-1α protein level (bottom) relative to sham. Bar graph shows means±s.d. (n = 3). b Representative images of sham (left) and CCI-injured (right, at 48 h post-injury) brain sections immunostained with LRRK2 and HIF-1α antibodies. Scale bar = 50 μm (left merge), 5 μm (right merge), and 25 μm (lower low). c Numbers of LRRK2 and HIF-1α double-positive cell (per mm2) in sham and CCI-injured brain sections. Bar graph shows mean ± s.d. (n = 3). d Level of HIF-1α protein in control and scratch-injured cortical neurons. Representative immunoblots (top) and quantification of HIF-1α level relative to control (bottom) are shown. Bar graph shows means ± s.d. (n = 3). e Representative images of control (left) and scratch-injured (right, at 24 h post-injury) cortical neurons immunostained with LRRK2 and HIF-1α antibodies. Scale bar = 50  μm (left merge), 5 μm (right merge), and 25 μm (lower low). f Numbers of LRRK2 and HIF-1α double-positive cells (per mm2) in control and scratch-injured cortical neurons. Mean  ± s.d. (n = 3). gn Cortical neurons were transfected with wild-type (WT) or dominant-negative (DN) of HA-tagged HIF-1α or with two different siRNA against HIF-1α at DIV 8, and cortical neurons were scratched at DIV 10. Levels of LRRK2 mRNA (g, j) and LRRK2 protein (h, k) were examined at 24 h post-injury and normalized to those of mock (g, h) or control siRNA-transfected neurons (j, k). Bar graph shows means ± s.d. (n = 3). i, l LDH release assay. Bar graph shows mean ± s.d. (n = 3). m, n 2ME2 (0.2 and 1 μM) or vehicle (0.05% DMSO) was treated at 1 h post-injury. m Levels of LRRK2 and HIF-1α in cortical neurons treated with 2ME2. Bar graph shows means ± s.d. (n = 3).n LDH release assay. Bar graph shows means ± s.d. (n = 3). Student t test was performed for c and f and One-way ANOVA followed by Newman–Keuls post hoc test was performed for g to n. *p < 0.01; **p < 0.005; ***p < 0.001
Fig. 4
Fig. 4. Transcriptional regulation of LRRK2 by HIF-1α.
a Schematic linear maps of mouse LRRK2 promoter, indicating location and nucleotide sequence of four putative HRE sites and mutagenesis information of each HRE sites. b At DIV 8, pGL3-mLRRK2-Luc was transfected into primary cortical neurons, followed by scratch injury at DIV 10, and luciferase activity was measured at 48 h post-injury. Bar graph shows means ± s.d. (n = 3). c, d Primary cortical neurons were co-transfected with pGL3-mLRRK2-Luc and wild-type (WT) or dominant-negative (DN) of HIF-1α (c) or with two different siRNA against HIF-1α (d) at DIV 8. Neurons were scratched at DIV 10, and luciferase assay was performed with cell lysates at 48 h post-injury. Bar graph shows means ± s.d. (n = 4). e Primary cortical neurons were transfected with pGL3-mLRRK2-Luc or HRE mutant constructs which harbor mutations in one of the four HRE sites. Bar graph shows means ± s.d. (n = 3). f Control and scratch-injured cortical neurons were processed for chromatin immunoprecipitation (ChIP) with anti-HIF-1α or IgG control antibodies. One-way ANOVA followed by Newman–Keuls post hoc test was performed for all experiments. ***p < 0.001
Fig. 5
Fig. 5. LRRK2-mediated neuronal cell death after scratch injury.
a-f Lentivirus (pLL3.7-shControl, shLRRK2 #1 or #2) was infected into cortical neurons at DIV 8, followed by scratch injury at DIV 10. After 48 h, the analyses described below were performed. a, b Levels of LRRK2 protein in control and scratch-injured cortical neurons infected with shControl or shLRRK2-lentivirus. Representative immunoblots (a) and quantification (b) of LRRK2 protein levels are shown. Bars in b show means ± s.d. (n = 3). c LDH release assay. LDH release level relative to control neurons infected with shControl-lentivirus. Bar graph shows means ± s.d. (n = 3). d, e TUNEL assay. Numbers of TUNEL-positive cells (per mm2) in control and scratch-injured cortical neurons infected with shControl or shLRRK2-lentivirus (d) and representative images (e) are presented. Bar graph in d shows means ± s.d. (n = 3). Scale bar in e = 50 μm (merge) and 100 μm (right column). f Immunoblots of control and scratch-injured cortical neurons infected with shLRRK2 or shControl, using antibodies against Bcl-2, cleaved caspase-3, total and cleaved PARP, and p53. β-actin antibodies were used as a loading control. g-l Cortical neurons were pretreated with LRRK2 kinase inhibitors (1 μM G1023 or 1 μM GSK2578215A) for 1 h prior to scratch injury at DIV 10. After 48 h, the analyses described below were performed. g, h Levels of total and phospho-S935 LRRK2 protein in control and scratch-injured cortical neurons treated with G1023, GSK2578215A, or vehicle control. Representative immunoblots (g) and quantification (h) of phospho-LRRK2 are shown. Bars in (h) show means ± s.d. (n = 3). i LDH release assay. LDH release level relative to control neurons treated with vehicle control. Bar graph shows means ± s.d. (n = 3). j, k TUNEL assay. Numbers of TUNEL-positive cells (per mm2) in control and scratch-injured cortical neurons treated with LRRK2 inhibitors or vehicle control (d) and representative images (k) are presented. Bar graph in J shows means ± s.d. (n = 3). Scale bar in k = 50 μm (merge) and 100 μm (right column). l Immunoblots of control and scratch-injured cortical neurons treated with LRRK2 inhibitors or vehicle control, using antibodies against Bcl-2, cleaved caspase-3, total and cleaved PARP, and p53. β-actin antibodies were used as a loading control. One-way ANOVA followed by Newman-Keuls post hoc test was performed for all experiments. ***p < 0.001
Fig. 6
Fig. 6. LRRK2 inhibition alleviates CCI-induced brain lesions and neuronal loss.
a Experiment scheme for drug application, behavioral tests, and brain preparation. b, c Levels of total and phospho-S935 LRRK2 in brain lysates from each experiment group. β-actin antibodies were used as a loading control. Representative immunoblots (c) and quantification of total and phospho-LRRK2 levels relative to vehicle-injected sham group are presented. Bar graph in C shows means ± s.d. (n = 4–5). d Representative whole brain images of sham and CCI group. e Nissl staining of coronal brain sections from sham and CCI group. Scale bar = 2 mm. f Quantification of lesion volume, which is presented as percentage of total ipsilateral hemisphere. Bar graph shows means ± s.d. (n = 4–5). g Coronal brain sections from sham and CCI group treated with G1023 or vehicle control immunostained with NeuN antibodies. Magnified images of cortical and hippocampal regions are presented in right. Scale bar = 2 mm (whole brain sections) and 50 μm (magnified images). h Numbers of NeuN-positive cells (per mm2) in brain sections from sham and CCI groups treated with G1023 or vehicle control. Bar graphs show means ± s.d. (n = 4–5). i, j TUNEL assay. Representative image (i) and numbers (j) of TUNEL-positive cells (per mm2) in sham and CCI groups treated with G1023 or vehicle control are presented. Bar graph in (j) shows means ± s.d. (n = 4–5). Scale bar in i = 50 μm. k Immunoblots of sham and CCI groups treated with G1023 or vehicle control, using antibodies against Bcl-2, cleaved caspase-3, total and cleaved PARP, and p53. β-actin antibodies were used as a loading control. One-way ANOVA followed by Newman–Keuls post hoc test was performed for (c), (h), and (j) and Student t test was performed for (f). ***p < 0.001
Fig. 7
Fig. 7. LRRK2 inhibition reduces CCI-induced brain pathologies.
a, c Representative images of brain sections from sham or CCI groups treated with G1023 or vehicle control, using antibodies against Iba1 (a) or GFAP (c). Scale bar = 2 mm. Magnified images of cortical and hippocampal regions are presented in right. Scale bar = 50 μm. Numbers of Iba1 (b) or GFAP (d) positive cells (per mm2) in each experiment group are presented. Bar graphs in (b) and (d) show means ± s.d. (n = 4–5). e Levels of proinflammatory cytokine mRNAs (IL-1β, IL-6, and TNF-α) in each experiment group was analyzed by RT-PCR. Quantification of mRNA level relative to vehicle-injected sham control is presented as mean ± s.d. (n = 4–5). f Levels of MMP2, MMP9 and AQP4 proteins in each experiment group. Quantification of each protein level relative to vehicle-injected sham group is presented as mean ± s.d. (n = 4–5). One-way ANOVA followed by Newman–Keuls post hoc test was performed for all experiments. ***p < 0.001
Fig. 8
Fig. 8. LRRK2 inhibition ameliorates motor and cognitive deficits induced by CCI injury.
Beam balance test and novel objective recognition (NOR) test were performed at 7 and 9 days post-injury, respectively. a Beam balance score in each experimental group. Means ± s.e.m. (n = 8). b Schematic diagram of NOR test. c Exploration time for a familiar and a novel object and (d) discrimination index in NOR test in each experimental group. Means ± s.e.m. (n = 8). Two-way ANOVA followed by Bonferroni post hoc test was performed for (a) and (c) and Mann Whitney test was performed for (b). *p < 0.05; **p < 0.01; ***p < 0.001

References

    1. Biskup S, et al. Localization of LRRK2 to membranous and vesicular structures in mammalian brain. Ann. Neurol. 2006;60:557–569. doi: 10.1002/ana.21019. - DOI - PubMed
    1. Han BS, et al. Expression of the LRRK2 gene in the midbrain dopaminergic neurons of the substantia nigra. Neurosci. Lett. 2008;442:190–194. doi: 10.1016/j.neulet.2008.06.086. - DOI - PMC - PubMed
    1. Zimprich A, et al. Mutations in LRRK2 cause autosomal-dominant parkinsonism with pleomorphic pathology. Neuron. 2004;44:601–607. doi: 10.1016/j.neuron.2004.11.005. - DOI - PubMed
    1. Di Fonzo A, et al. A frequent LRRK2 gene mutation associated with autosomal dominant Parkinson’s disease. Lancet. 2005;365:412–415. doi: 10.1016/S0140-6736(05)17829-5. - DOI - PubMed
    1. Gilks WP, et al. A common LRRK2 mutation in idiopathic Parkinson’s disease. Lancet. 2005;365:415–416. - PubMed

Publication types

MeSH terms

Substances