. 2018 Dec;20(12):1389-1399.
doi: 10.1038/s41556-018-0229-6. Epub 2018 Nov 12.

TBK1 and IKKε prevent TNF-induced cell death by RIPK1 phosphorylation

Affiliations

TBK1 and IKKε prevent TNF-induced cell death by RIPK1 phosphorylation

Elodie Lafont et al. Nat Cell Biol. 2018 Dec.

Abstract

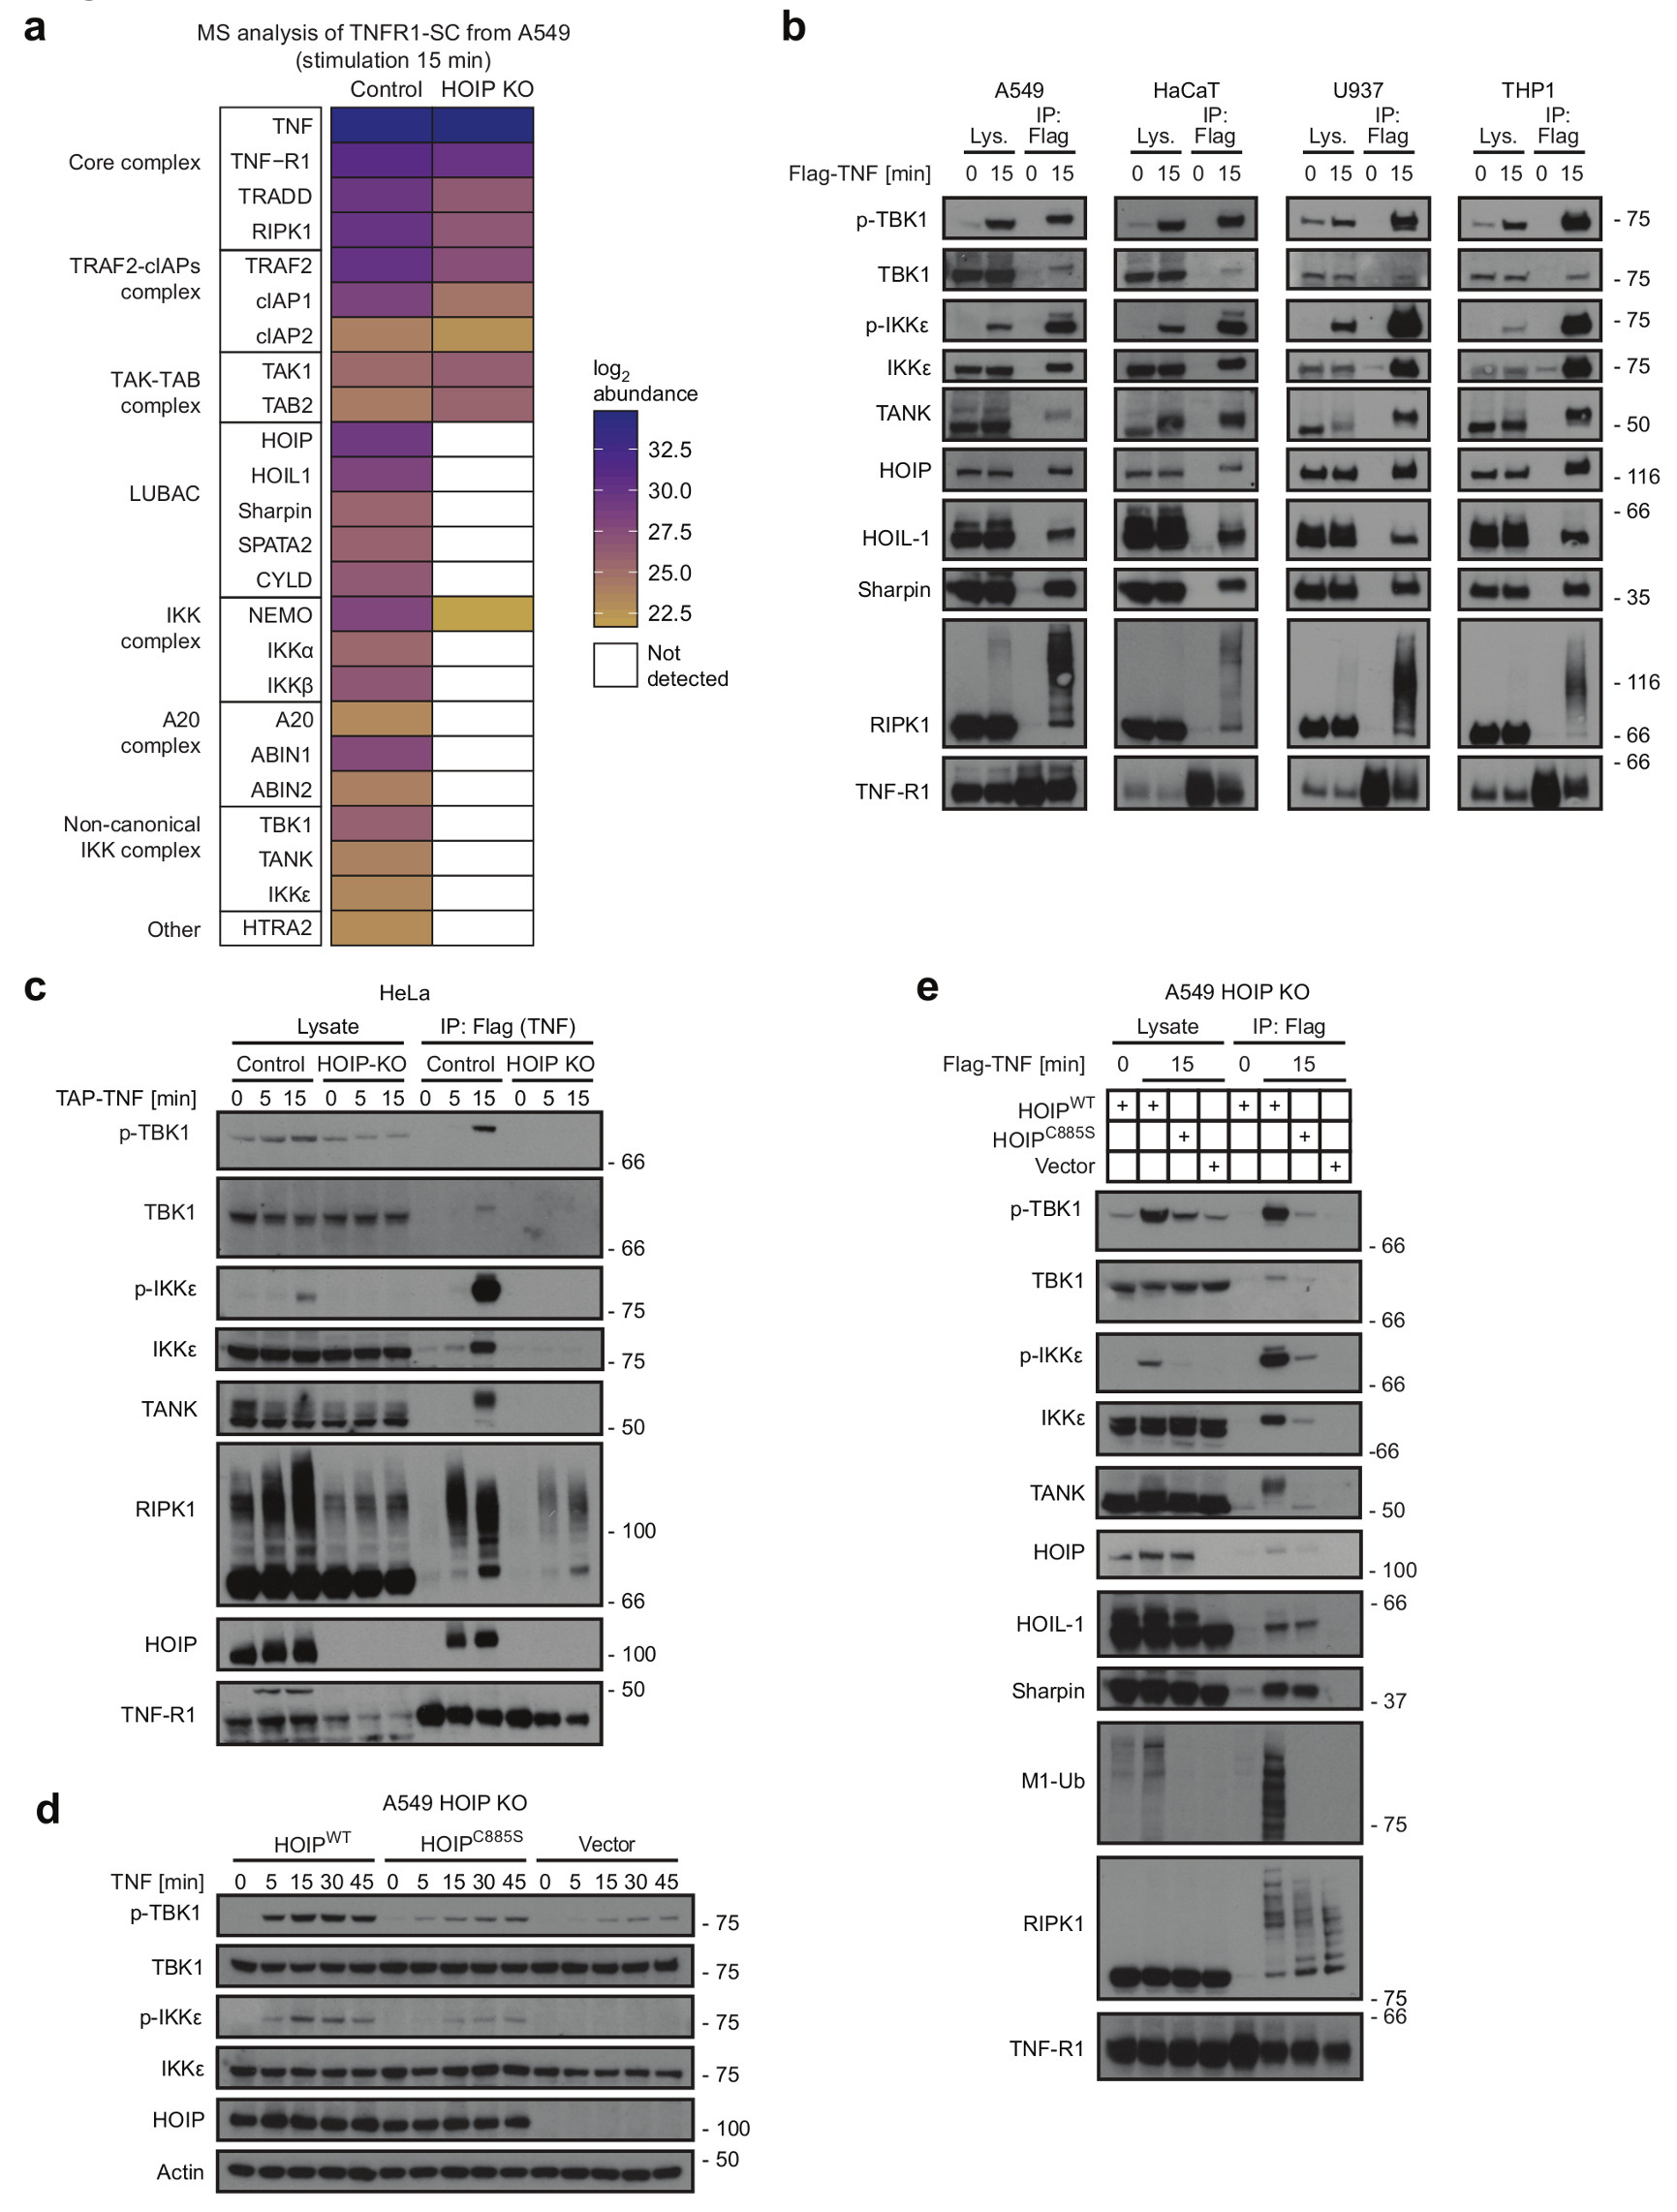
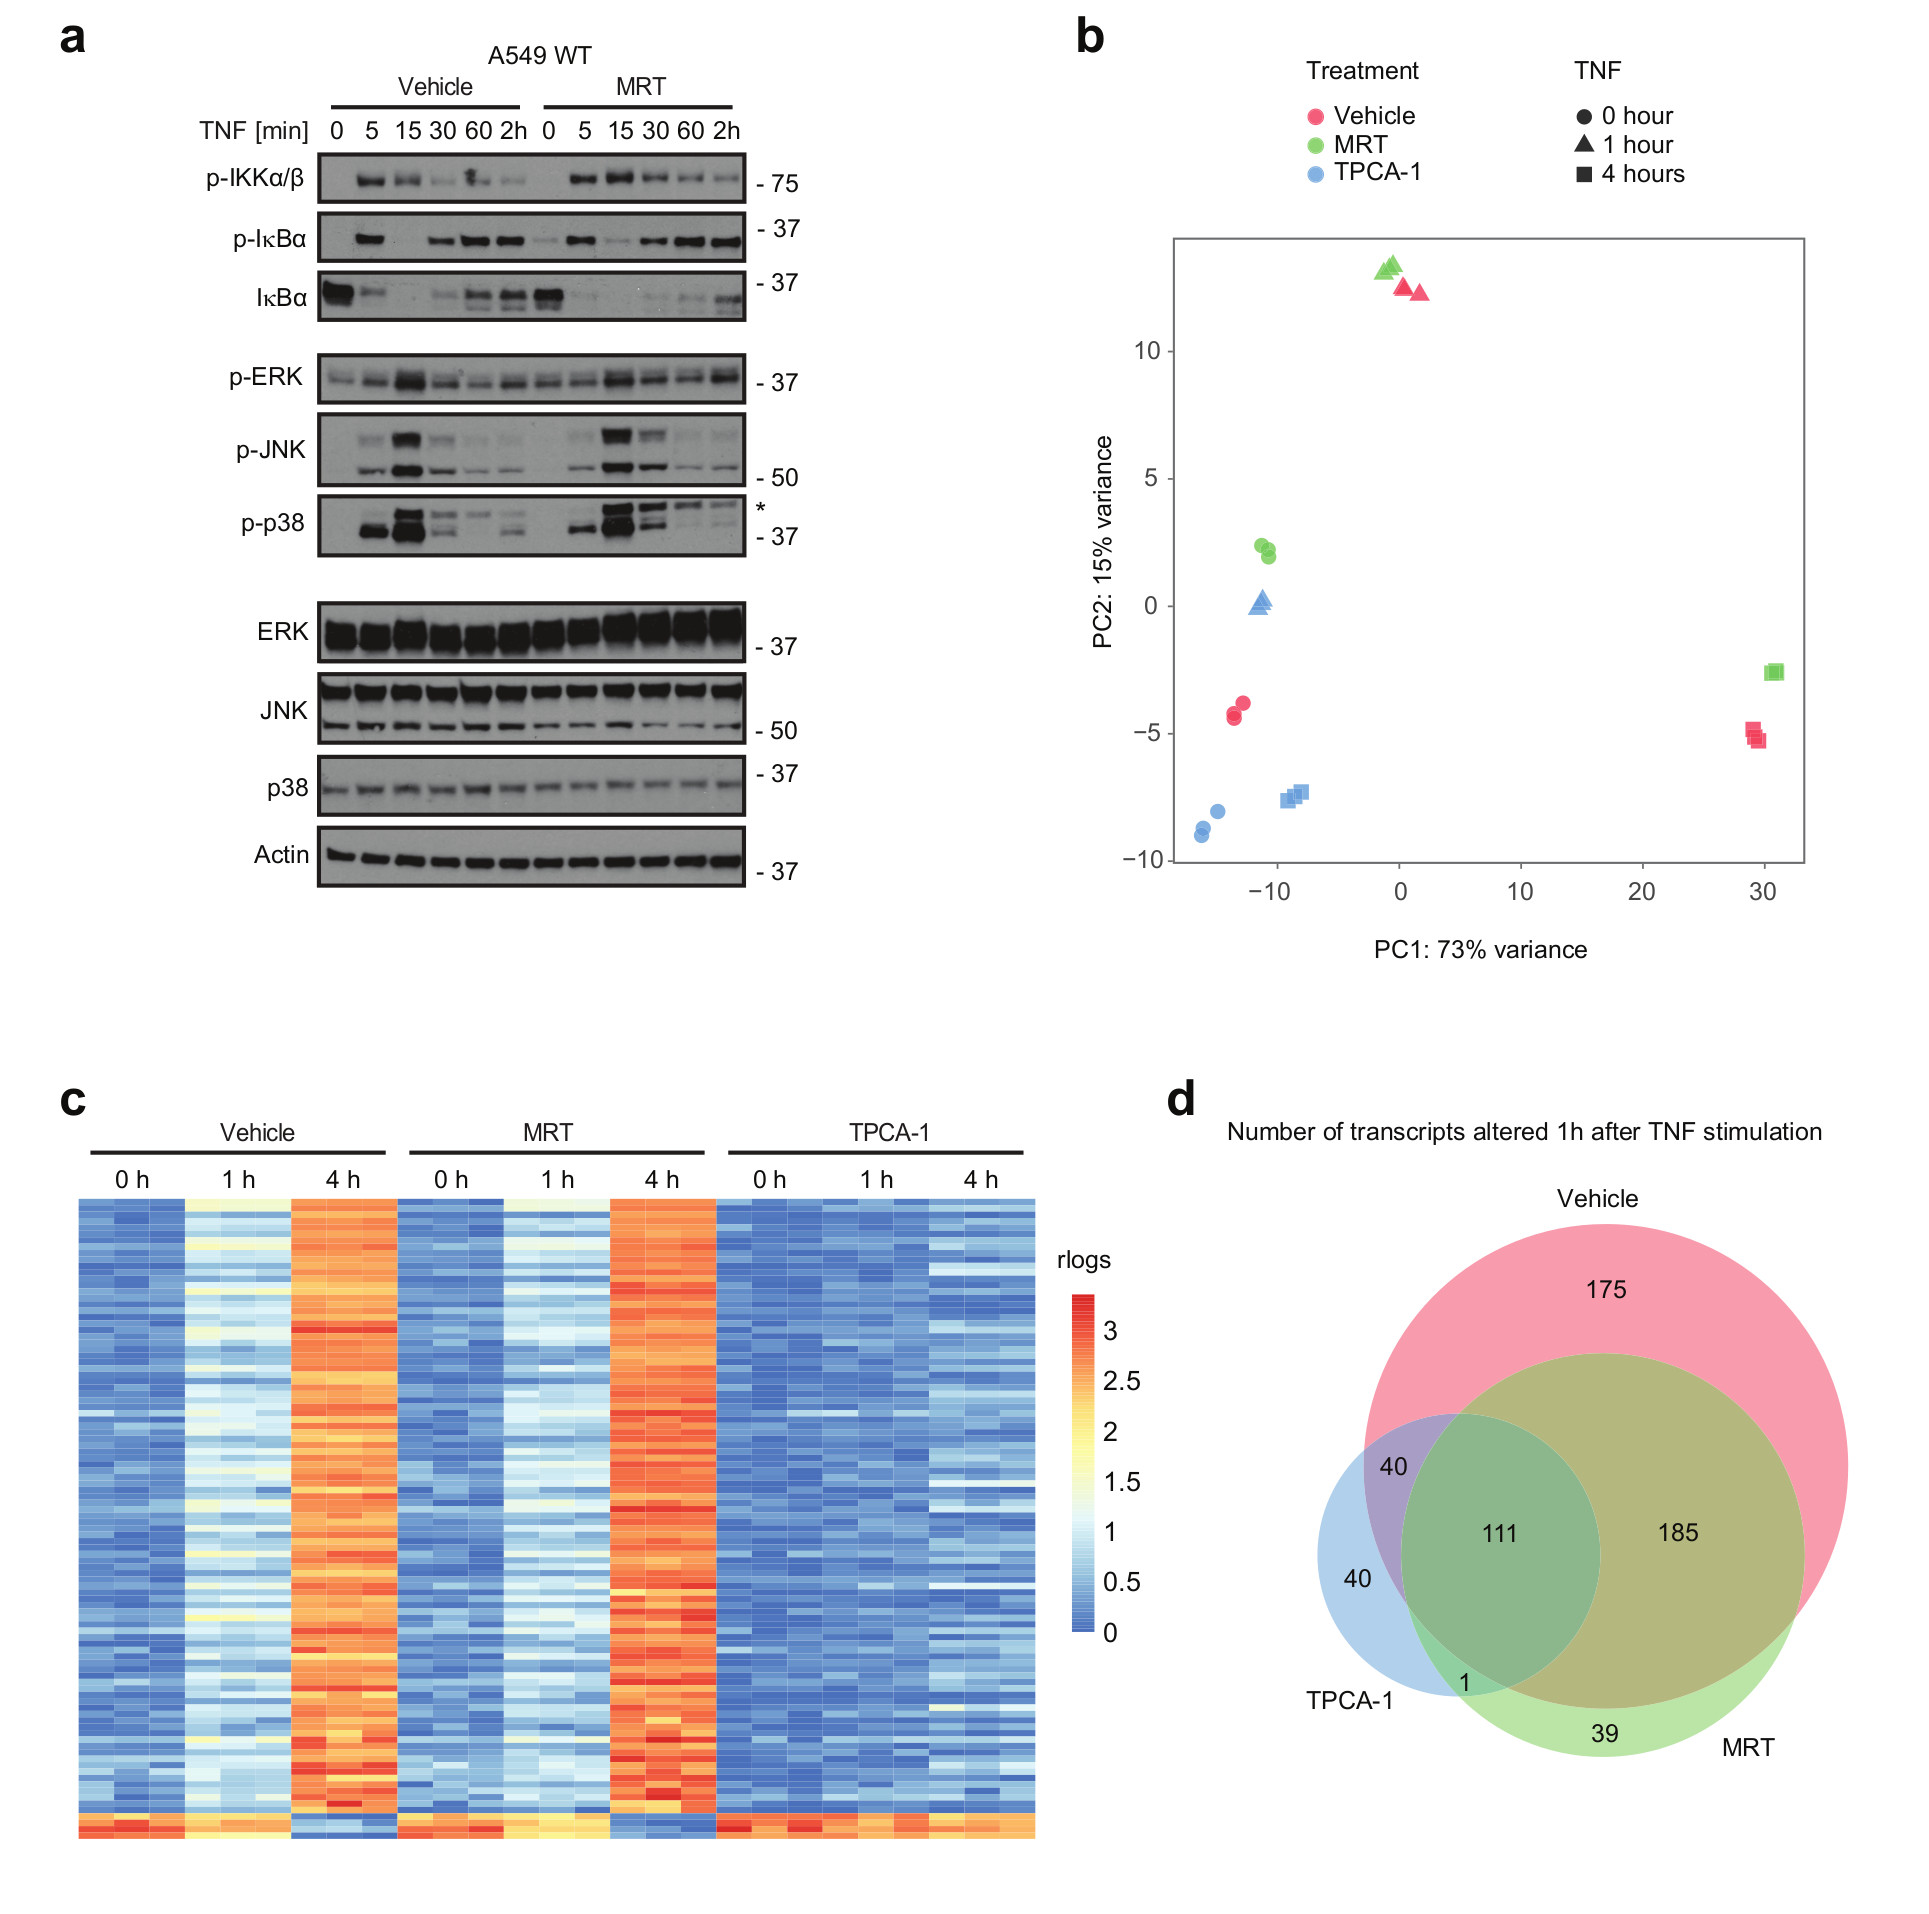
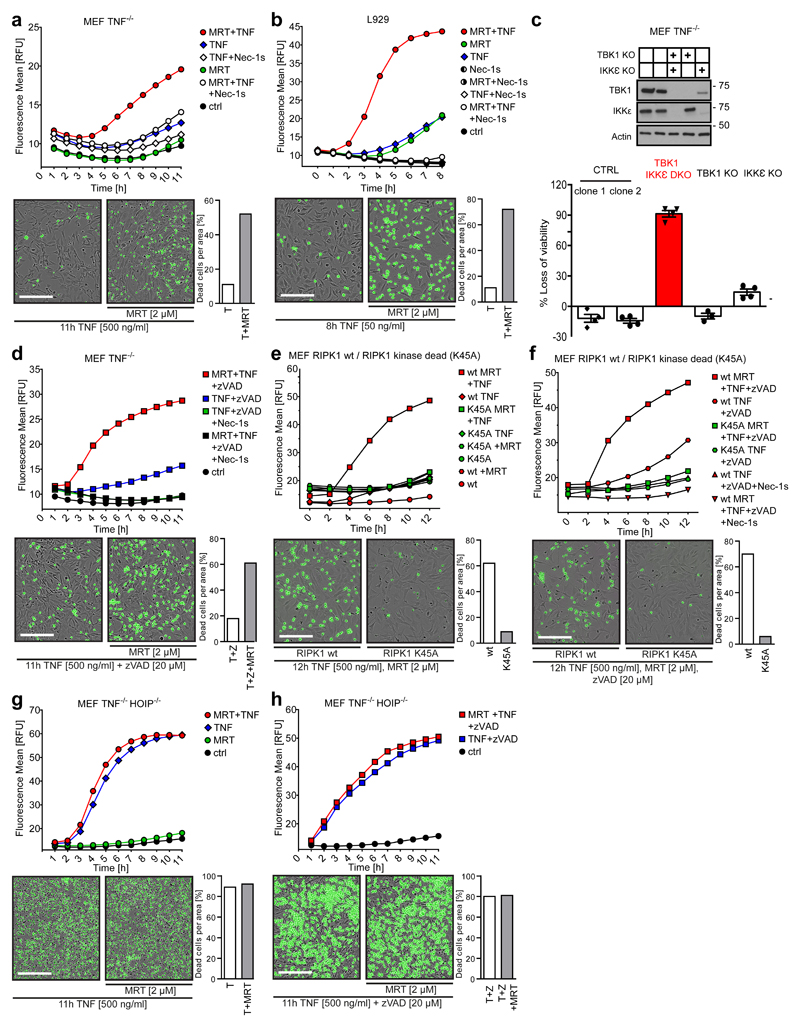
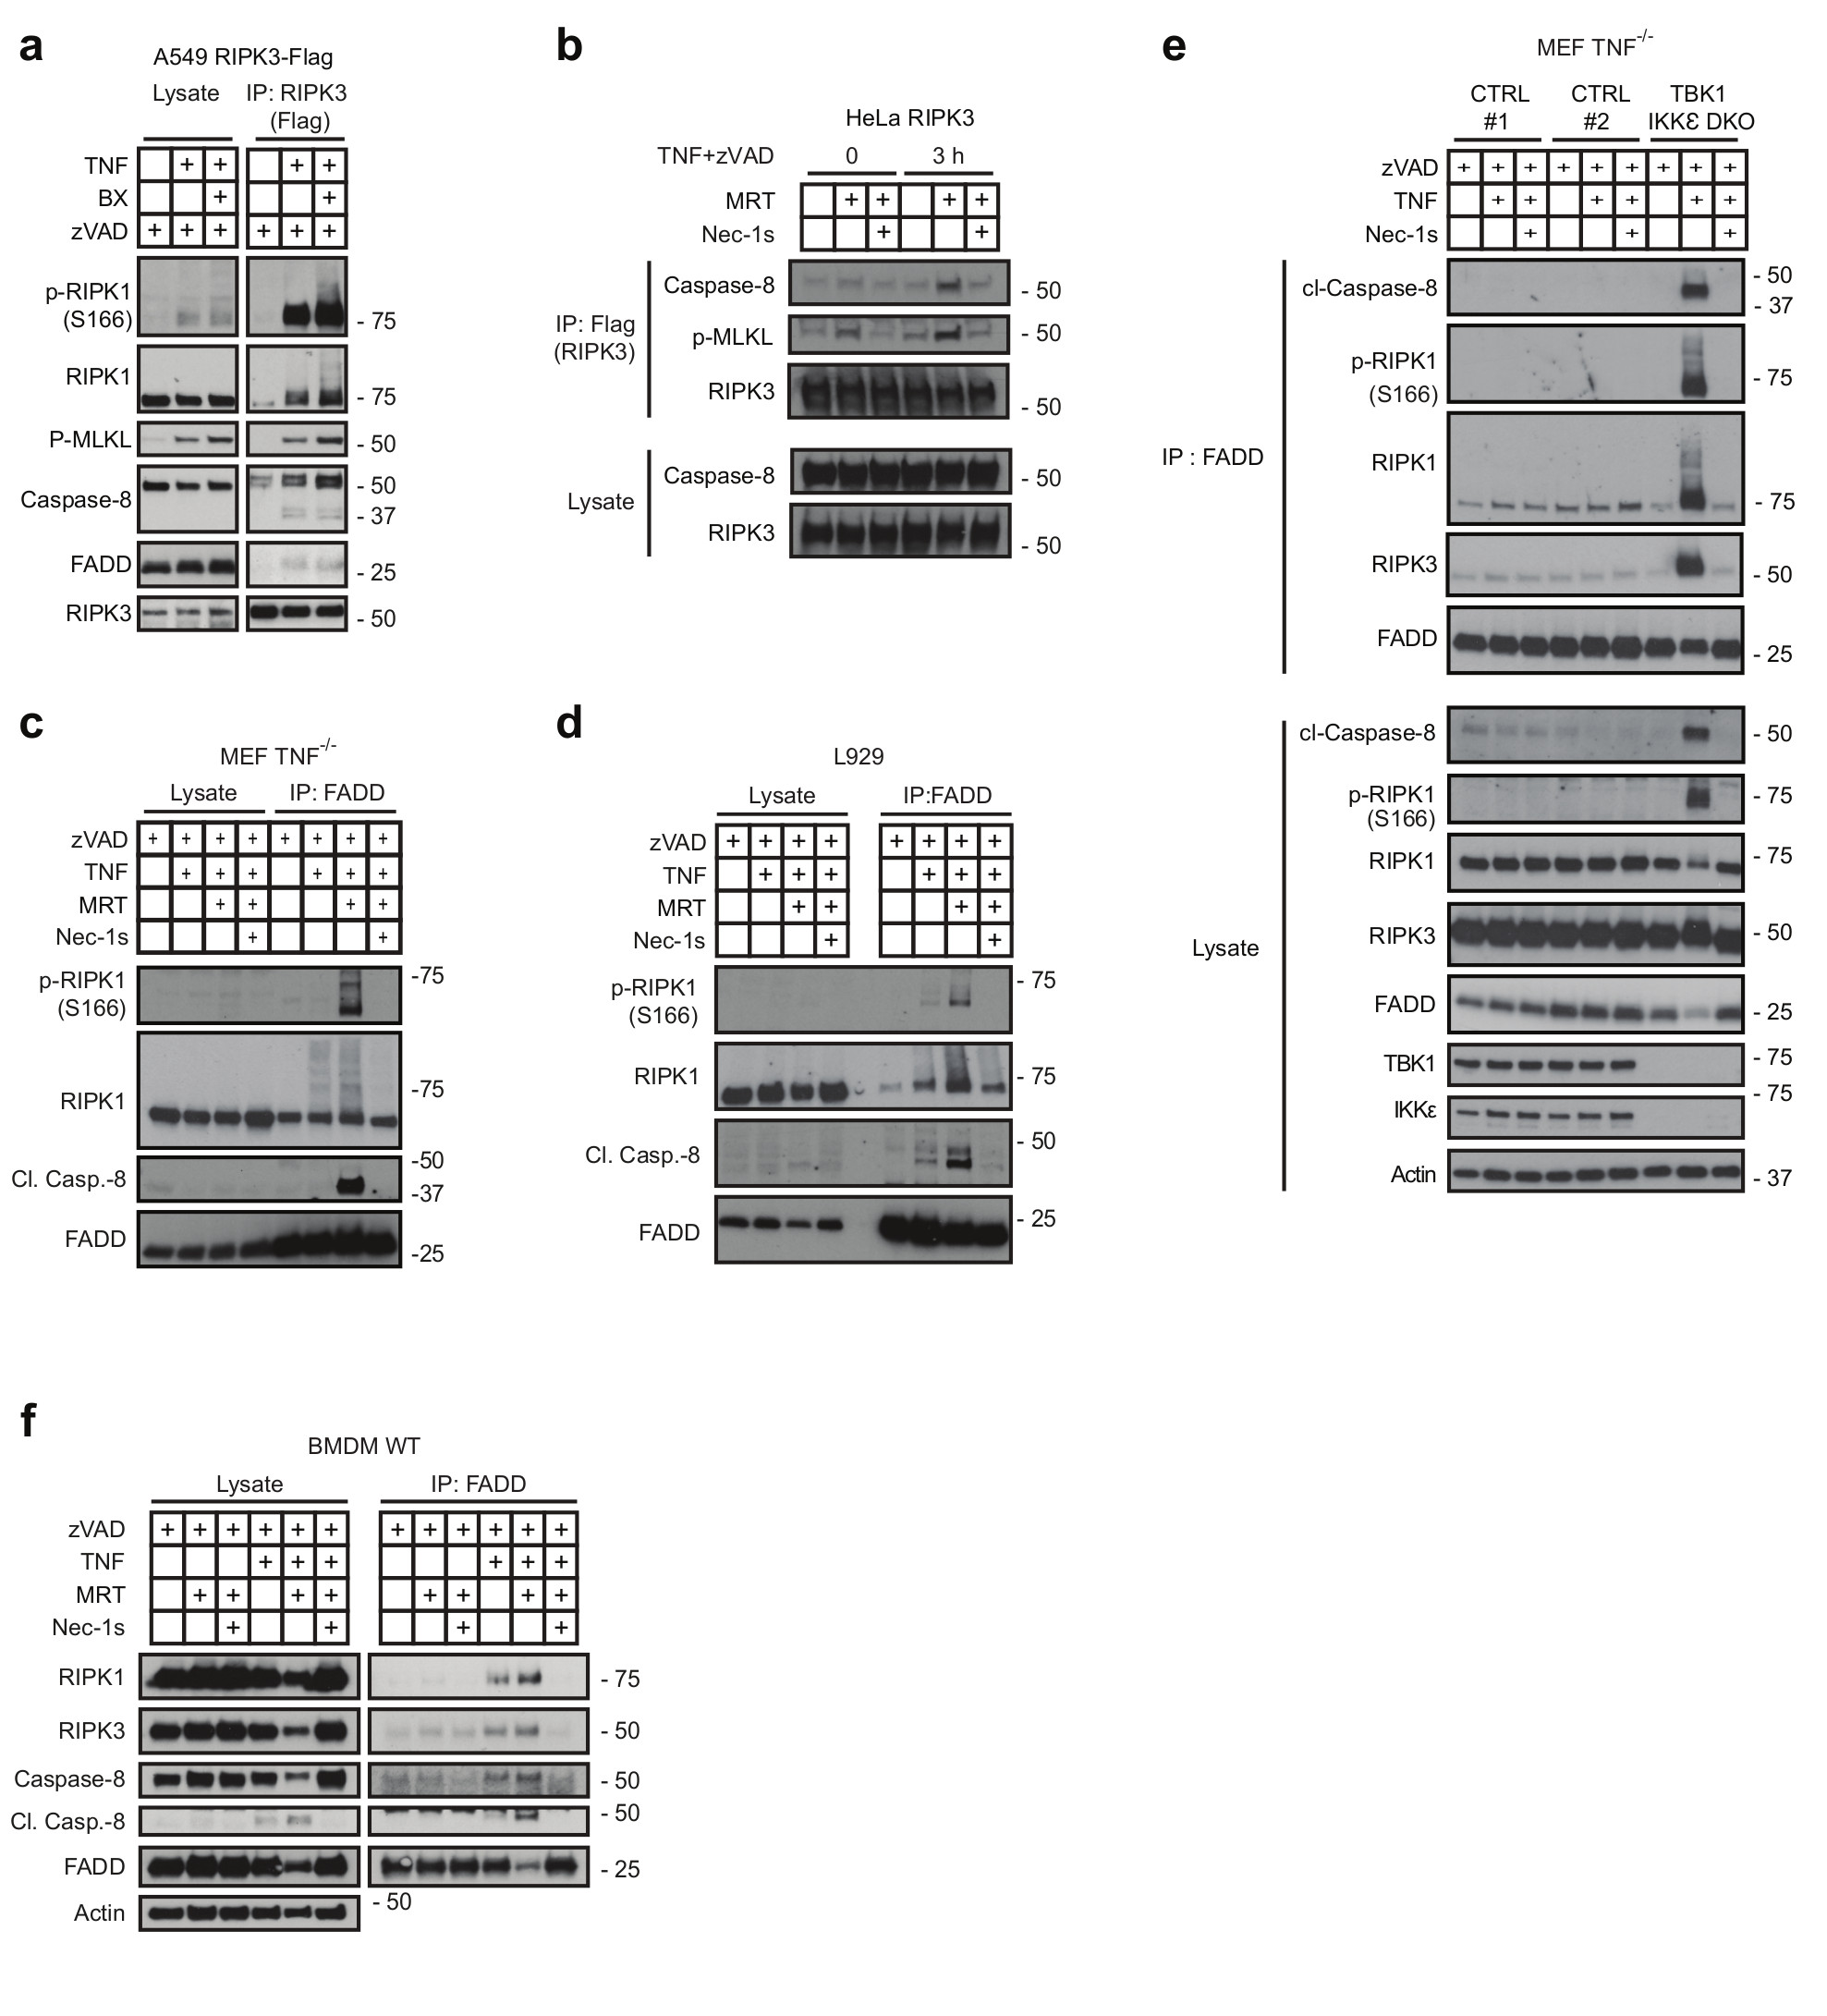
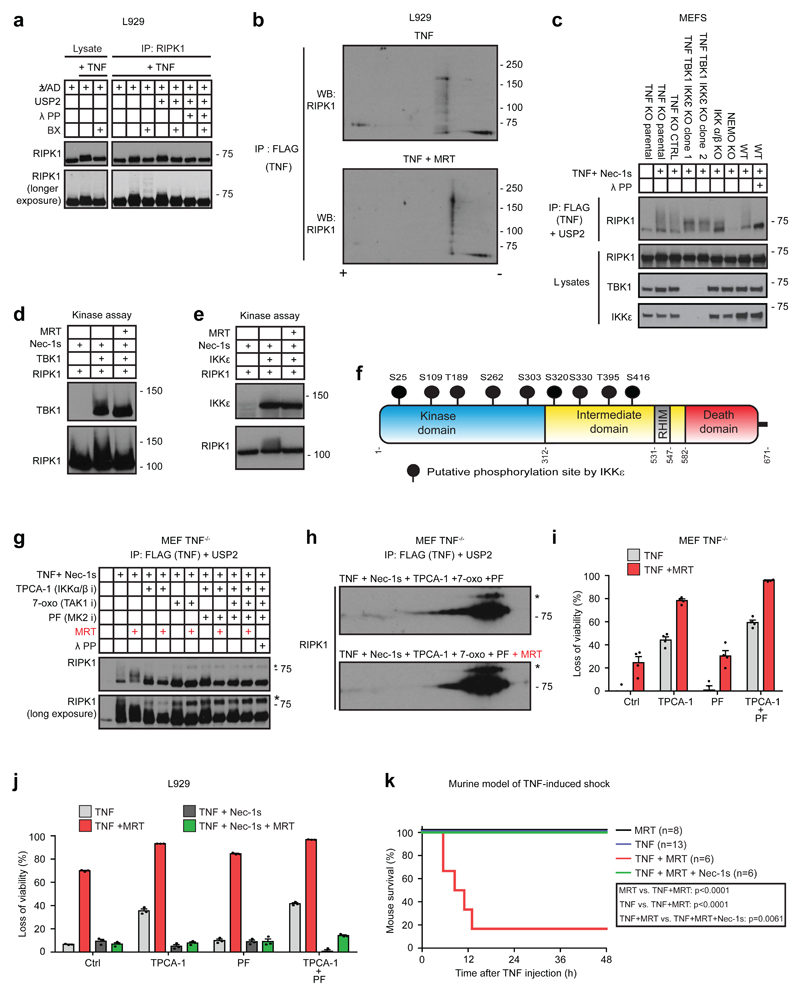
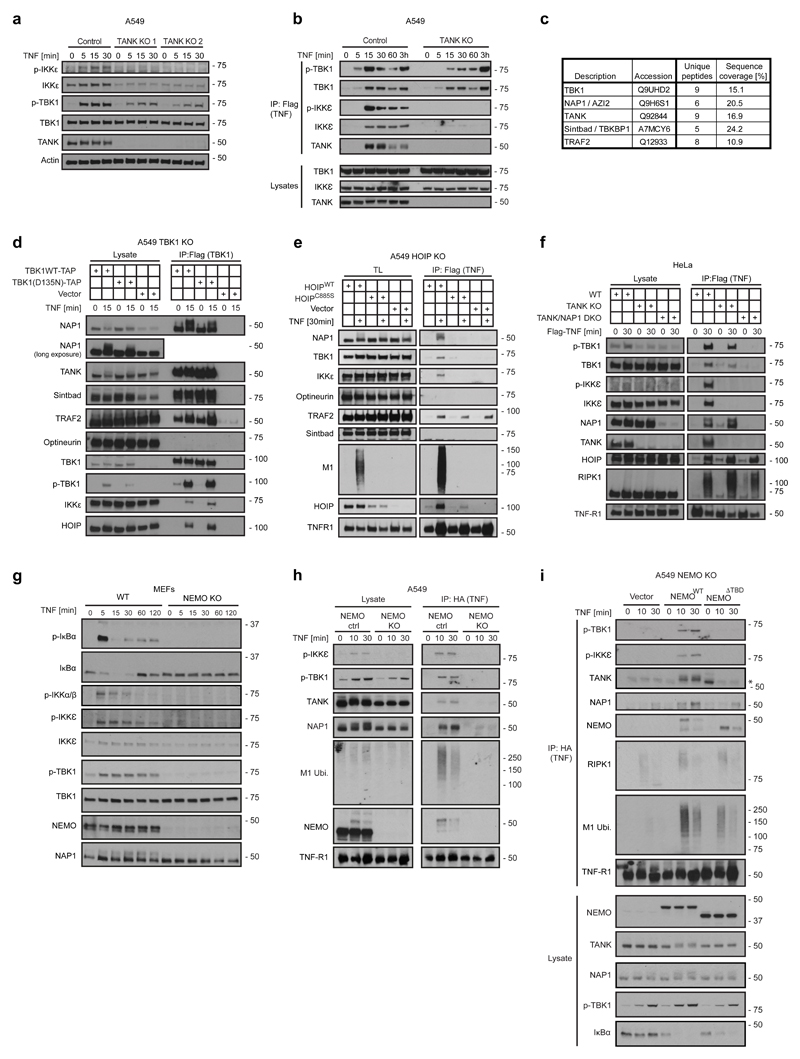
The linear-ubiquitin chain assembly complex (LUBAC) modulates signalling via various immune receptors. In tumour necrosis factor (TNF) signalling, linear (also known as M1) ubiquitin enables full gene activation and prevents cell death. However, the mechanisms underlying cell death prevention remain ill-defined. Here, we show that LUBAC activity enables TBK1 and IKKε recruitment to and activation at the TNF receptor 1 signalling complex (TNFR1-SC). While exerting only limited effects on TNF-induced gene activation, TBK1 and IKKε are essential to prevent TNF-induced cell death. Mechanistically, TBK1 and IKKε phosphorylate the kinase RIPK1 in the TNFR1-SC, thereby preventing RIPK1-dependent cell death. This activity is essential in vivo, as it prevents TNF-induced lethal shock. Strikingly, NEMO (also known as IKKγ), which mostly, but not exclusively, binds the TNFR1-SC via M1 ubiquitin, mediates the recruitment of the adaptors TANK and NAP1 (also known as AZI2). TANK is constitutively associated with both TBK1 and IKKε, while NAP1 is associated with TBK1. We discovered a previously unrecognized cell death checkpoint that is mediated by TBK1 and IKKε, and uncovered an essential survival function for NEMO, whereby it enables the recruitment and activation of these non-canonical IKKs to prevent TNF-induced cell death.


Conflict of interest statement

Competing interests

The authors declare that they have no financial and non-financial competing interests.

Conflict of interest

H.W. is co-founder and shareholder of Apogenix AG. Otherwise the authors declare that they have no conflict of interest.

Figures

Figure 1
Figure 1. LUBAC mediates recruitment and activation of the non-canonical kinases TBK1 and IKKε in the TNFR1-SC
(a) A549 HOIP Control or HOIP KO cells were stimulated with TAP-TNF (500 ng/mL). TNFR1-SC was purified in a two-step immunoprecipitation via TAP-Tag and analysed by LC-MS/MS. Mean protein abundance for two independent experiments and two LC-MS analyses is plotted as indicated. Raw data can be accessed on the ProteomeXchange Consortium via the PRIDE partner repository with the dataset identifier PXD008497, analysed data is available in Supplementary table 2 (b) A549, HaCaT, U937 and THP-1 cells were stimulated with FLAG-TNF (1 µg/mL) for the indicated times. TNFR1-SC was purified and analysed by western blotting. (c) HeLa HOIP control or HOIP KO cells were stimulated with TAP-TNF (500 ng/mL) and subjected to TNFR1-SC isolation and western blot analysis. (d) HOIP-deficient A549 -KO cells were reconstituted with empty vector, HOIPWT or enzymatically inactive HOIPC885S and were stimulated with TNF (200 ng/mL) for the indicated times and lysates were analysed by western blotting. (e) HOIP-deficient A549 reconstituted with empty vector, HOIPWT or enzymatically inactive HOIPC885S were stimulated with FLAG-TNF (1 µg/mL) for the indicated time. Lysates and TNFR1-SC were analysed by western blot. (b-e) One representative experiment out of two is shown. Unprocessed original scans of blots are shown in Supplementary Figure 7.
Figure 2
Figure 2. Inhibition of TBK1/IKKε exerts only minor effects on TNF-induced gene-activatory signalling
(a-d) A549 WT cells were pre-incubated with either vehicle (DMSO) or MRT for 30 min, followed by stimulation with TNF (200 ng/mL) for the indicated times. (a) Lysates were analysed by western blotting. One representative experiment out of two is shown. * staining from previous p-JNK. Unprocessed original scans of blots are shown in Supplementary Figure 7 (b-d) Cells were then lysed, their total RNA extracted and RNA-Seq analysis performed. Samples from three independent experiments were obtaineded and analysed. (b) Principal-component analysis (PCA) of A549 samples based on transcriptome-wide expression level data is shown. (c) The heatmap illustrates the major change of expression across the dataset. The genes selected to be shown were the 100 most highly correlated with PC1 (see Fig 2b). For clarity of comparison the 'rlog' expression data of each row was zeroed at time-point 0 hr and then scaled by the standard deviation. The RNA-Seq raw dataset for b and c are available in the SRA repository and can be accessed by using the following BioProject accession: PRJNA422567 or SRA accession: SRP126844 (https://www.ncbi.nlm.nih.gov/Traces/study/?acc=SRP126844). (d) The Venn diagram represents the number of all transcripts significantly regulated upon 1 hr of TNF-stimulation in vehicle, MRT- or TPCA-1 -treated samples and the transcript overlap between those three groups. Corresponding transcripts can be found in supplementary table 3. Differential RNA-seq expression statistics (p-values) on contrasting biological triplicates, corresponding to samples obtained from three independent experiments (groups as in b-d) were estimated using DESeq2. Adjusted p-value statistics were calculated with the Benjamoni-Hochberg and IHW adjustment.
Figure 3
Figure 3. Inhibition of TBK1/IKKε sensitises cells to TNF-induced RIPK1 activity-dependent cell death downstream of LUBAC
(a) MEF TNF-/- and (b) L929 cells were treated with TNF (500 ng/mL and 50 ng/mL, respectively) in the presence or absence of MRT and Nec-1s. (c) MEF TNF-/- cells of the indicated genotype were stimulated with TNF (500 ng/mL) for 6h. Loss of cell viability was determined using the Cell Titer Glo (CTG) assay. Mean +/- SEM of n=3 independent experiments. Lysates of untreated cells were analysed by Western blot. Unprocessed original scans of blots are shown in Supplementary Figure 7. (d-h) MEFs of the indicated genotype were treated with TNF (500 ng/mL) in the presence or absence of the indicated compounds. (a, b and d-h) Cell death was measured in function of time by SytoxGreen positivity. The RFU mean of 4 technical replicates of one representative experiment out of three independent experiments is represented. Representative images of indicated measurements are depicted with corresponding percentage of dead cells. Cell counting was performed manually using ImageJ. White bar in microscopy images equals 200 µm. Raw data are provided in Supplementary table 1.
Figure 4
Figure 4. Inhibition of TBK1/IKKε leads to TNF-induced RIPK1 activation and increased complex II formation
(a) A549 and (b) HeLa cells both overexpressing FLAG-tagged RIPK3 were treated with or without BX-795 and zVAD (a) or MRT, zVAD and Nec-1s (b) and were stimulated with TNF (500 ng/mL) for 3 hours. Complex II was then FLAG-immunoprecipitated and analysed by western blot. (c-e) MEFs (c), L929 (d), MEF TNF-/- ;TBK1/IKKε DKO cells and corresponding MEF TNF-/- control cells (e) and primary BMDMs (f) were pre-treated with MRT in combination with zVAD and Nec-1s as indicated and stimulated with TNF (500 ng/mL), for either 6 hours (c, e, f) or 4 hours (d), respectively. Complex II was then immunoprecipitated with a FADD antibody and analysed by western blot. (a-f) One representative experiment is shown out of two independent experiments. Unprocessed original scans of blots are shown in Supplementary Figure 7.
Figure 5
Figure 5. TBK1 and IKKε phosphorylate RIPK1 both in vitro and at the TNFR1-SC, providing a physiologically relevant cell death checkpoint
(a) L929 pre-treated +/- BX-795 were stimulated with TNF (1 µg/mL)/zVAD for 15 minutes before RIPK1-pulldown. RIPK1-IP treated with USP2 and Lambda-phosphatase as indicated was analysed by western blot. (b) L929 cells were stimulated with TAP-TNF for 15 minutes (1 µg/mL) +/- MRT. TNFR1-SC was FLAG-immunoprecipitated. Samples were first separated by pI on IPG-strips pH 3-10 NL, followed by SDS-PAGE and western blot analysis. (c) Indicated MEFs were treated with FLAG-TNF (1 µg/mL)/Nec-1s, followed by FLAG-IP. TNFR1-SC treated with USP2 and Lambda-phosphatase as indicated was analysed by western blot. (d,e) GST-tagged TBK1 (d) and IKKε (e) were incubated with GST-tagged RIPK1 in a kinase assay +/- indicated inhibitors before western blot analysis. (f) Phosphosites identified by LC-MS/MS from one kinase assay using GST-tagged RIPK1,Nec-1s and IKKε. Raw data is accessible on ProteomeXchange Consortium via PRIDE partner repository with dataset identifier PXD008518, analysed data in Supplementary table 4.(g) MEFs TNF-/- pre-treated with indicated inhibitors were stimulated with FLAG-TNF (1 µg/mL)/Nec-1s for 15 minutes, followed by FLAG-IP. TNFR1-SCs treated with USP2 and Lambda-phosphatase as indicated were analysed via western blotting. * unspecific bands (h) MEFs TNF-/- pre-treated with indicated inhibitors were stimulated with FLAG-TNF (1 µg/mL)/Nec1-s for 15 minutes, followed by FLAG-IP. TNFR1-SCs treated with USP2 were first separated by pI on IPG-strips pH 4-7 followed by SDS-PAGE and western blot analysis. (i) MEFs TNF-/- stimulated with indicated inhibitors for 30 minutes were treated with TNF (500 ng/mL) for 7 hours. (j) L929 pre-incubated with Nec-1s for 15 minutes and further incubated with indicated inhibitors for 30 minutes were treated with TNF (50 ng/mL) for 4 hours. (i,j) Loss of cell viability was determined by CTG assay. Mean +/-SEM of n=4 (i) or mean +/-SEM of n=3 (j) independent experiments. (k) Cumulative survival rates of mice following TNFα-induced shock in presence of indicated inhibitors were compared using log-rank Mantel-Cox test. MRT vs TNF+MRT: p<0.001; TNF vs TNF+MRT: p<0.0001; TNF+MRT vs TNF+MRT+Nec-1s: p=0.0061. Unprocessed blots are shown in Supplementary Figure 7, raw data in Supplementary table 1. One experiment representative of two (a-c, g, h) or three (d, e) independent experiments is shown.
Figure 6
Figure 6. NEMO acts upstream of the adaptors TANK and NAP1 which recruit TBK1 and IKKε, or TBK1-only, respectively, to the TNFR1-SC
(a) TANK-deficient A549 cell clones and control cells were treated with TNF (200 ng/mL) for the indicated times. Lysates were analysed by western blot. (b) TANK KO or corresponding control A549 cells were stimulated with FLAG-TNF (500 ng/mL) for the indicated times. The purified TNFR1-SC and lysates were analysed by western blot. (c) A549 TBK1 KO cells were reconstituted with TBK1WT-TAP. The TBK1 interactome was purified in a two-step immunoprecipitation via TAP-Tag and analysed by LC-MS/MS. One experiment was analysed. Raw data can be accessed on the ProteomeXchange Consortium via the PRIDE partner repository with the dataset identifier PXD010777 and analysed data is available in Supplementary table 5. (d) A549 TBK1 KO cells were reconstituted with TBK1WT-TAP or the catalytically inactive mutant TBK1D135N-TAP and treated with 500 ng/mL TNF as indicated. The purified TBK1-associated complex and lysates were analysed by western blot. (e) HOIP-deficient A549 cells reconstituted with HOIP WT, enzymatically inactive HOIP C885S or vector control were stimulated with FLAG-TNF (500 ng/mL) for the indicated times. The purified TNFR1-SC and lysates were analysed by western blot. (f) HeLa cells deficient in TANK, concomitantly deficient in TANK and NAP1 (TANK/NAP1 DKO), or corresponding control cells were stimulated with TAP-TNF (500 ng/mL) and subjected to immunoprecipitation via Flag. The purified TNFR1-SC and lysates were analysed by western blot. (g) NEMO KO and corresponding WT MEFs were stimulated with TNF (200 ng/mL) for the indicated times. Lysates were analysed by western blot. (h) A549 control and NEMO KO cells were stimulated with HA-TNF (1 µg/mL) and subjected to immunoprecipitation via HA. The purified TNFR1-SC and lysates were analysed by western blot. (i) A549 NEMO KO cells reconstituted with NEMOWT, NEMOΔTBD or vector control were stimulated with HA-TNF (1 µg /mL) for the indicated times. The purified TNFR1-SC and lysates were analysed by western blot. One experiment representative of two (a,b, d-g) or three independent experiments (h,i). Unprocessed original scans of blots are shown in Supplementary Figure 7.

Comment in

  • TBK1 and IKKε restrain cell death.
    Heger K, Dixit VM. Heger K, et al. Nat Cell Biol. 2018 Dec;20(12):1330-1331. doi: 10.1038/s41556-018-0239-4. Nat Cell Biol. 2018. PMID: 30482939 No abstract available.

References

    1. Micheau O, Tschopp J. Induction of TNF receptor I-mediated apoptosis via two sequential signaling complexes. Cell. 2003;114:181–190. - PubMed
    1. Kalliolias GD, Ivashkiv LB. TNF biology, pathogenic mechanisms and emerging therapeutic strategies. Nature reviews Rheumatology. 2016;12:49–62. - PMC - PubMed
    1. Brenner D, Blaser H, Mak TW. Regulation of tumour necrosis factor signalling: live or let die. Nature reviews Immunology. 2015;15:362–374. - PubMed
    1. Hrdinka M, Gyrd-Hansen M. The Met1-Linked Ubiquitin Machinery: Emerging Themes of (De)regulation. Mol Cell. 2017;68:265–280. - PubMed
    1. Shimizu Y, Taraborrelli L, Walczak H. Linear ubiquitination in immunity. Immunological reviews. 2015;266:190–207. - PMC - PubMed

Publication types

MeSH terms

Substances

LinkOut - more resources