

doi: 10.1038/s41467-018-07246-2.
Near-infrared STED nanoscopy with an engineered bacterial phytochrome
Affiliations
- PMID: 30420676
- PMCID: PMC6232180
- DOI: 10.1038/s41467-018-07246-2
Item in Clipboard
Near-infrared STED nanoscopy with an engineered bacterial phytochrome
Nat Commun.
.
Abstract
The near infrared (NIR) optical window between the cutoff for hemoglobin absorption at 650 nm and the onset of increased water absorption at 900 nm is an attractive, yet largely unexplored, spectral regime for diffraction-unlimited super-resolution fluorescence microscopy (nanoscopy). We developed the NIR fluorescent protein SNIFP, a bright and photostable bacteriophytochrome, and demonstrate its use as a fusion tag in live-cell microscopy and STED nanoscopy. We further demonstrate dual color red-confocal/NIR-STED imaging by co-expressing SNIFP with a conventional red fluorescent protein.
Conflict of interest statement
The authors declare no competing interests.
Figures
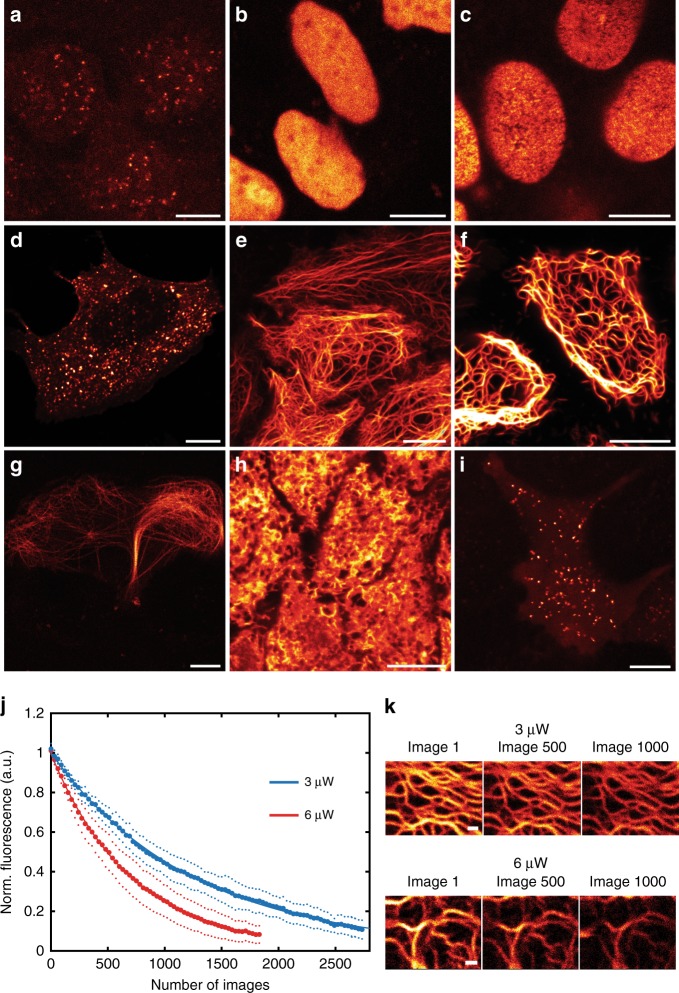
Confocal recordings of SNIFP in living HeLa and U2OS cells. a–i Images of SNIFP targeted to different subcellular structures. Fluorescence was excited at 633 nm. a Kinetochore, SNIFP-CENPC, b nucleus, SNIFP-HIST1H2bn, c nuclear pore, SNIFP-NUP50, d caveolae, CAV1-SNIFP, e keratin, KRT18-SNIFP, f vimentin, VIM-SNIFP, g microtubule associated protein, SNIFP-MAP2, h ER, ER-SNIFP, and i peroxisomes, SNIFP-PTS. j–k Bleaching of SNIFP in living human cells at 676 nm irradiation. j Confocal images of living Hela cells expressing VIM-SNIFP were continuously recorded at the same site using two different light intensities (3 or 6 µW, as indicated, measured in the back aperture of the objective lens). Each data point (large dots) represents the average of five measurements (blue, 3 µW) or six measurements (red, 6 µW). Small dots indicate the standard deviation. Only every 30th data point is displayed for better visualization. Solid line: single exponential fit to the data. The characteristic decay times (decay to 1/e of the initial signal) were 1280 ± 225 images (at 3 µw) and 726 ± 167 images (at 6 µW). k Representative confocal images, recorded with the indicated light intensities. Imaging parameters are listed in Supplementary Table 3. a–k 25 µM biliverdin was added to the medium ~2 h before imaging. Scale bars: 10 µm (a–i) and 1 µm (k)
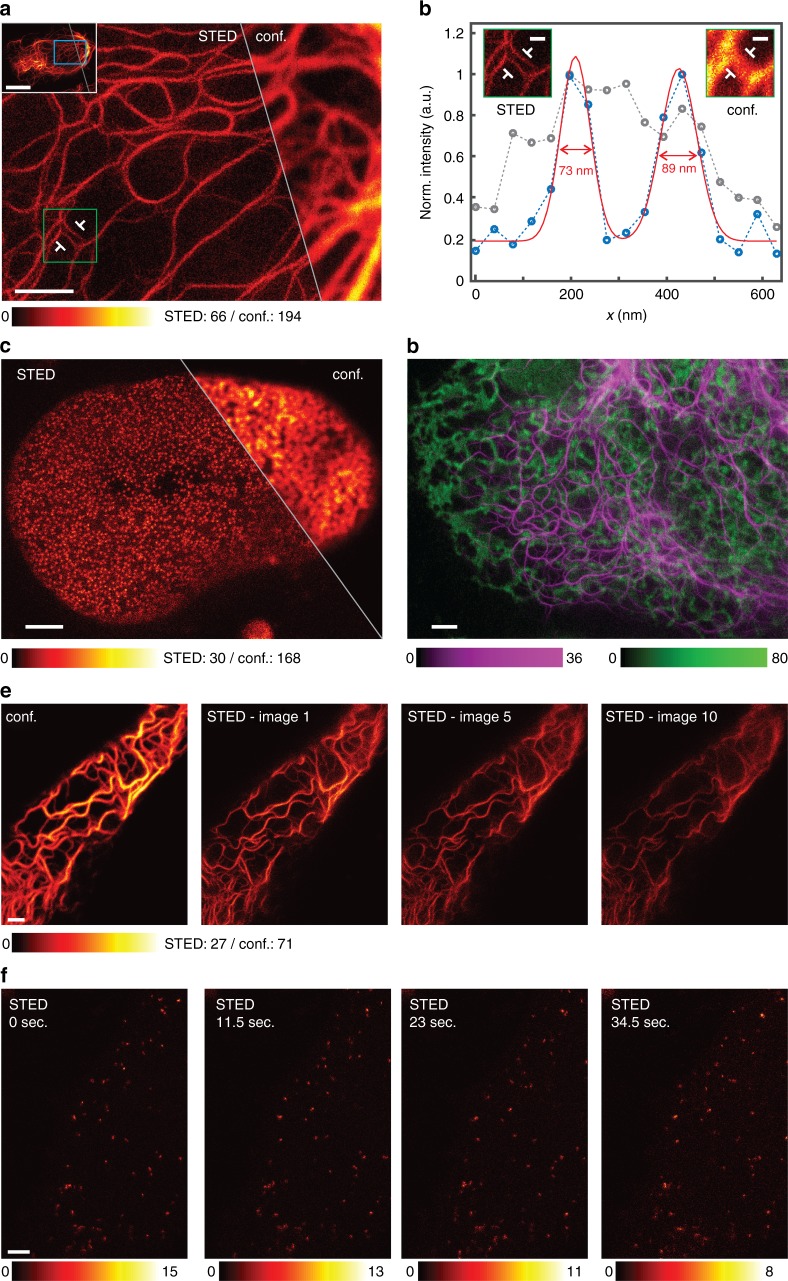
NIR STED nanoscopy of living human cells expressing SNIFP fusion proteins. a STED nanoscopy of a HeLa cell expressing VIM-SNIFP. Large image: magnification of the region indicated in the inset showing the STED image of a whole cell (see also Supplementary Fig. 5). Left: STED nanoscopy, right: confocal microscopy. b Line profiles taken at the position indicated in a. The line width for averaging was 90 nm (three pixels). Blue circles: STED; gray circles: confocal; the averaged data were fitted with a Gaussian function (solid line). The FWHM values were determined on the fitted function. For more line profiles see Supplementary Figs. 5 and 6. c Live cell recording of the nucleus of a HeLa cell expressing SNIFP-NUP50. Left: STED nanoscopy, right: confocal microscopy. d Red confocal/NIR STED dual color imaging. VIM-SNIFP (magenta) was recorded in the STED mode, and the ER targeted mCherry (green) in the confocal mode. e, f Photostability of SNIFP during STED imaging. e Thirty consecutive STED images (recordings were started every 11 s) of a living Hela cell expressing Vim-SNIFP. Shown is a confocal image and three STED images, as indicated. (see Supplementary Fig. 7 for photostability analysis and comparison with mGarnet2). f Consecutive STED images recorded at the same site of a living HeLa cell expressing SNIFP-PTS to target the peroxisomes (recordings were started every 10.5 s). Shown are the first four images. a–f 25 µM biliverdin was added to the medium ~2 h before imaging. All images display raw data. Imaging parameters are listed in Supplementary Table 3. Scale bars: 10 µm (inset a), 2 µm (a, c–f), and 400 nm (b)
References
Publication types
MeSH terms
Substances
LinkOut - more resources
Full Text Sources
Research Materials
Miscellaneous
