. 2018 Nov 12;9(1):4746.
doi: 10.1038/s41467-018-07021-3.

Pathway-based subnetworks enable cross-disease biomarker discovery

Affiliations

Pathway-based subnetworks enable cross-disease biomarker discovery

Syed Haider et al. Nat Commun. .

Abstract

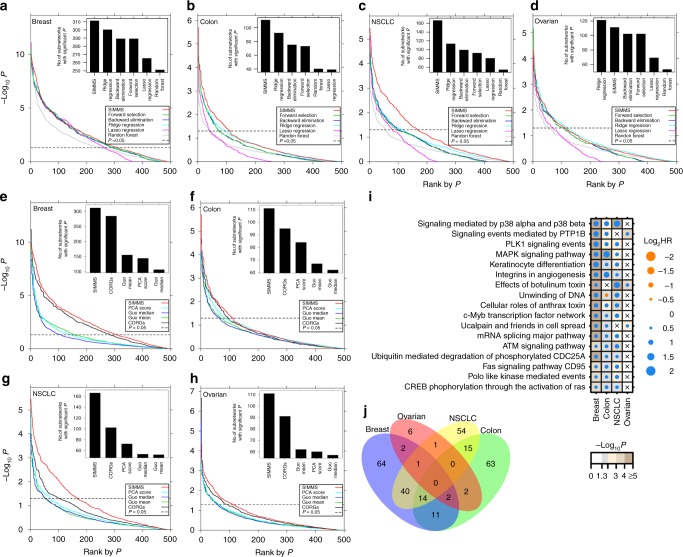
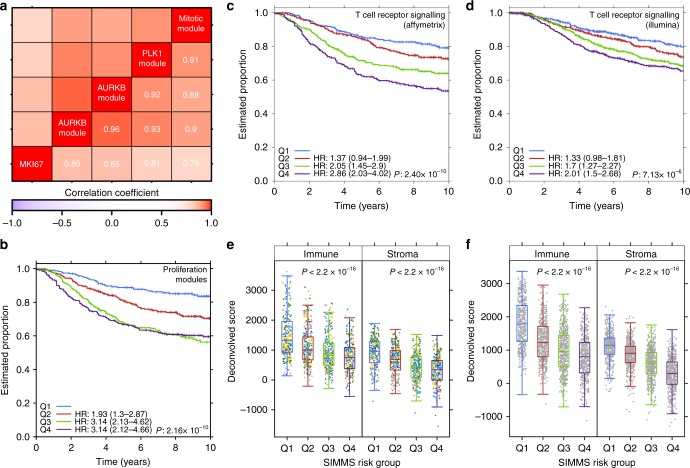
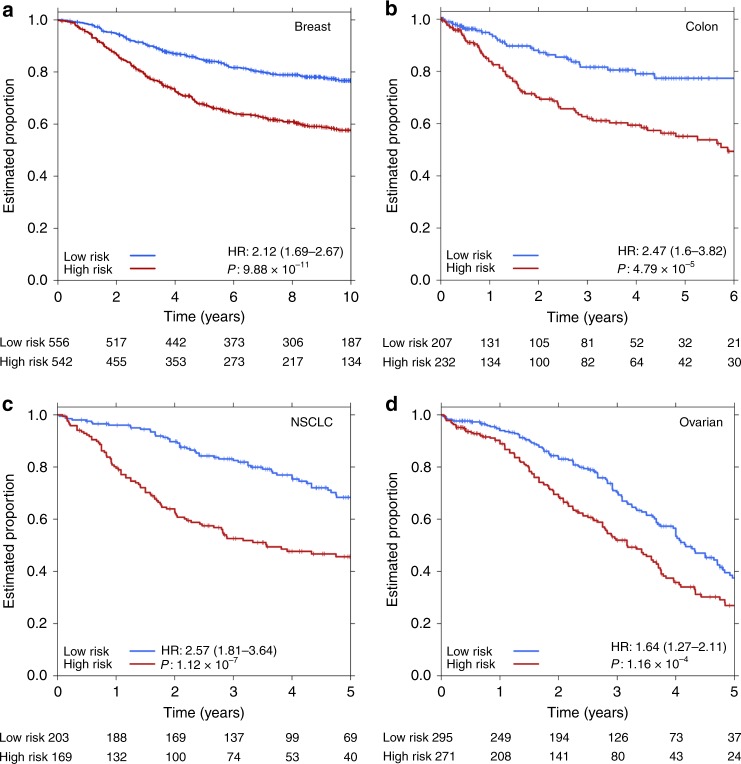
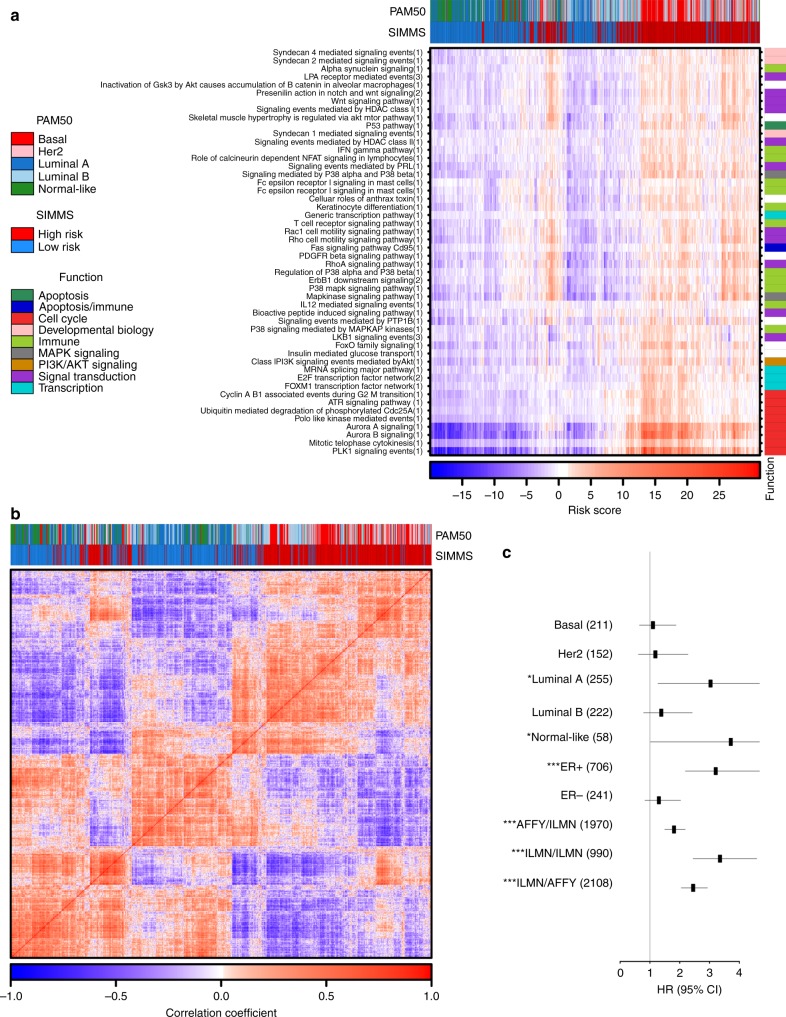
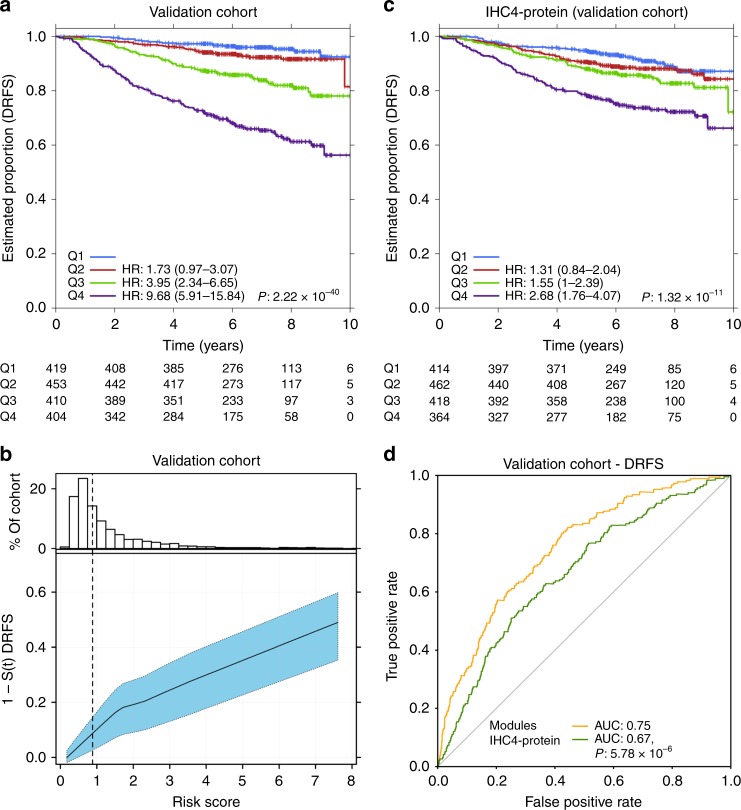
Biomarkers lie at the heart of precision medicine. Surprisingly, while rapid genomic profiling is becoming ubiquitous, the development of biomarkers usually involves the application of bespoke techniques that cannot be directly applied to other datasets. There is an urgent need for a systematic methodology to create biologically-interpretable molecular models that robustly predict key phenotypes. Here we present SIMMS (Subnetwork Integration for Multi-Modal Signatures): an algorithm that fragments pathways into functional modules and uses these to predict phenotypes. We apply SIMMS to multiple data types across five diseases, and in each it reproducibly identifies known and novel subtypes, and makes superior predictions to the best bespoke approaches. To demonstrate its ability on a new dataset, we profile 33 genes/nodes of the PI3K pathway in 1734 FFPE breast tumors and create a four-subnetwork prediction model. This model out-performs a clinically-validated molecular test in an independent cohort of 1742 patients. SIMMS is generic and enables systematic data integration for robust biomarker discovery.


Conflict of interest statement

The authors declare no competing interests.

Figures

Fig. 1
Fig. 1
Benchmarking prognostic subnetworks. a Comparison of prognostic ability of subnetworks in validation sets of breast cancer using SIMMS and five machine learning algorithms. For each algorithm, Wald P values were ranked in increasing order. The number of validated subnetworks identified by each algorithm (P < 0.05, above horizontal dashed line) are shown as barplots. bd Same visualization as (a) using data for colon, NSCLC and ovarian cancers. e Comparison of SIMMS against other pathway/subnetwork scoring methods. For each method, ranked P values and total number of significant subnetworks are shown following prognostic assessment in breast cancer validation sets. f–h Same as (e) using data for colon, NSCLC and ovarian cancers. i Dot plot of univariate hazard ratios and P values (Wald-test) for each of the top n subnetworks significantly associated with patient outcome (|log2 HR| > 0.584, P < 0.05) in at least 3/4 cancer types. A Cox proportional hazards model was fitted to dichotomized risk scores across the entire validation cohort. Crosses represent absence of a module from a particular cancer type. j Overlap of candidate subnetwork markers across breast, colon, NSCLC and ovarian cancers
Fig. 2
Fig. 2
Proliferation and immuno subnetworks. a Heatmap of correlation (Spearman) and cluster analysis of patient’s risk scores of proliferation modules in breast cancer, alongside mRNA abundance of a proliferation marker MKI67. Ward’s method was used for hierarchical clustering. Data shown for validation cohorts. b Kaplan–Meier analysis of predicted proliferation scores (validation cohorts) using SIMMS-derived proliferation biomarker. Groups (Q1-Q4) were established using quartiles derived from the training set. Groups Q2-Q4 were compared to Q1 using Cox proportional hazards model. P value was estimated using Log-rank test assessing heterogeneity across the four groups. c Kaplan–Meier analysis of tumor immune microenvironment driver subnetwork (BioCarta pathway: T cell receptor signaling) in Affymetrix based validation cohorts. Quartile based risk groups (thresholds derived from training set), demonstrating linear increase in the likelihood of recurrence/event. Test statistics same as in b. d Kaplan–Meier analysis of tumor immune microenvironment driver subnetwork (BioCarta pathway: T cell receptor signaling) in Metabric breast cancer cohort (Illumina platform). e Assessment of computationally inferred immune system infiltration and stromal estimates against SIMMS predicted risk groups (Q1-Q4 i.e., low to high) in Affymetrix validation cohorts (test statistic: ANOVA P value). Color of dots represent respective validation cohort (Supplementary Table 2). f Same as e using Metabric cohort (Illumina platform)
Fig. 3
Fig. 3
Multi-subnetwork biomarkers for multiple cancer types. ad Kaplan–Meier survival plots using Model N over the entire validation cohort with subnetwork selection performed through Cox model using generalized linear models (L1-regularization) on the training cohort. Final model resulted in 23/50, 5/75, 23/25, and 23/50 subnetworks for breast, colon, NSCLC and ovarian cancers, respectively (Supplementary Tables 10–13). P values were estimated using Wald-test
Fig. 4
Fig. 4
Clinical association of breast cancer biomarkers. a Heatmap of patients’ risk scores estimated using top nBreast=50 subnetworks in the Metabric validation cohort. Column covariates show patient classifications based on PAM50-based molecular subtypes and SIMMS predicted risk groups. Row covariates indicate functional class of subnetwork’s originating pathway. Columns and rows were clustered using divisive clustering. Number in parenthesis of y-axis labels represents subnetwork number from a given pathway; with details in subnetwork database (SIMMS R package). ‘Fc Epsilon Receptor I Signaling in Mast Cells’ is repeated twice because it is represented by two different pathways in the database (ID = 100165 and ID = 200003 in subnetworks database; SIMMS R package). b Clustered (divisive) heatmap of correlation (Spearman) between patients using their subnetwork risk score profiles (top nBreast=50 subnetworks) in the Metabric validation cohort with covariates as detailed in a. c Forest plot showing HR and 95% CI (multivariate Cox proportional hazards model) of the breast cancer subtype-specific markers, as well as cross-platform validation. Datasets originating from Illumina (ILMN) and Affymetrix (AFFY) were used in turn for cross platform training and validation. Due to limited availability of clinical annotations on Affymetrix based cohorts, only the Illumina dataset (Metabric) was used for subtype-specific models. For these, the Metabric-published training and validation cohorts were maintained for training and validation purposes. Numbers in parenthesis indicate the size of the validation cohort. Asterisks represent statistical significance of differential outcome between the predicted low-risk and high-risk groups (*P < 0.05, **P < 0.01, ***P < 0.001, Wald-test)
Fig. 5
Fig. 5
PIK3CA signaling predictor of breast cancer recurrence. a Independent validation of prognostic model trained on SIMMS’ risk scores and clinical covariates (N and tumor size). Risk score estimates were grouped into quartiles derived from the TEAM training cohort; each group was compared against Q1. Hazard ratios were estimated using Cox proportional hazards model and significance of survival difference was estimated using the log-rank test assessing heterogeneity across the four groups. b Distribution of patient risk scores in the TEAM Validation cohort (top panel). Bottom panel shows the predicted 5-year recurrence probabilities (solid line) and 95% CI (dashed lines) as a function of patient risk score. Vertical dashed black line indicates training set median risk score. c Risk prediction by the IHC4 protein model in the TEAM validation cohort. Quartiles were defined in the training cohort and applied to the validation cohort. Quartiles Q2-Q4 were compared against Q1, with adjustment for age, nodal status, tumor size and grade using Cox proportional hazards modeling and the log-rank test. d Comparison of SIMMS’ modules model (PIK3CA risk predictor) and IHC4-protein model using area under the receiver operating characteristic (AUC) curve as performance indicator.

References

    1. de Bono JS, Ashworth A. Translating cancer research into targeted therapeutics. Nature. 2010;467:543–549. doi: 10.1038/nature09339. - DOI - PubMed
    1. Galvan A, Ioannidis JP, Dragani TA. Beyond genome-wide association studies: genetic heterogeneity and individual predisposition to cancer. Trends Genet. 2010;26:132–141. doi: 10.1016/j.tig.2009.12.008. - DOI - PMC - PubMed
    1. Veltman JA, Brunner HG. De novo mutations in human genetic disease. Nat. Rev. Genet. 2012;13:565–575. doi: 10.1038/nrg3241. - DOI - PubMed
    1. McClellan J, King MC. Genetic heterogeneity in human disease. Cell. 2010;141:210–217. doi: 10.1016/j.cell.2010.03.032. - DOI - PubMed
    1. Kratz JR, et al. A practical molecular assay to predict survival in resected non-squamous, non-small-cell lung cancer: development and international validation studies. Lancet. 2012;379:823–832. doi: 10.1016/S0140-6736(11)61941-7. - DOI - PMC - PubMed

Publication types

Substances