. 2019 Jan;25(1):141-151.
doi: 10.1038/s41591-018-0221-5. Epub 2018 Nov 12.

Paradoxical effects of obesity on T cell function during tumor progression and PD-1 checkpoint blockade

Affiliations

Paradoxical effects of obesity on T cell function during tumor progression and PD-1 checkpoint blockade

Ziming Wang et al. Nat Med. 2019 Jan.

Abstract

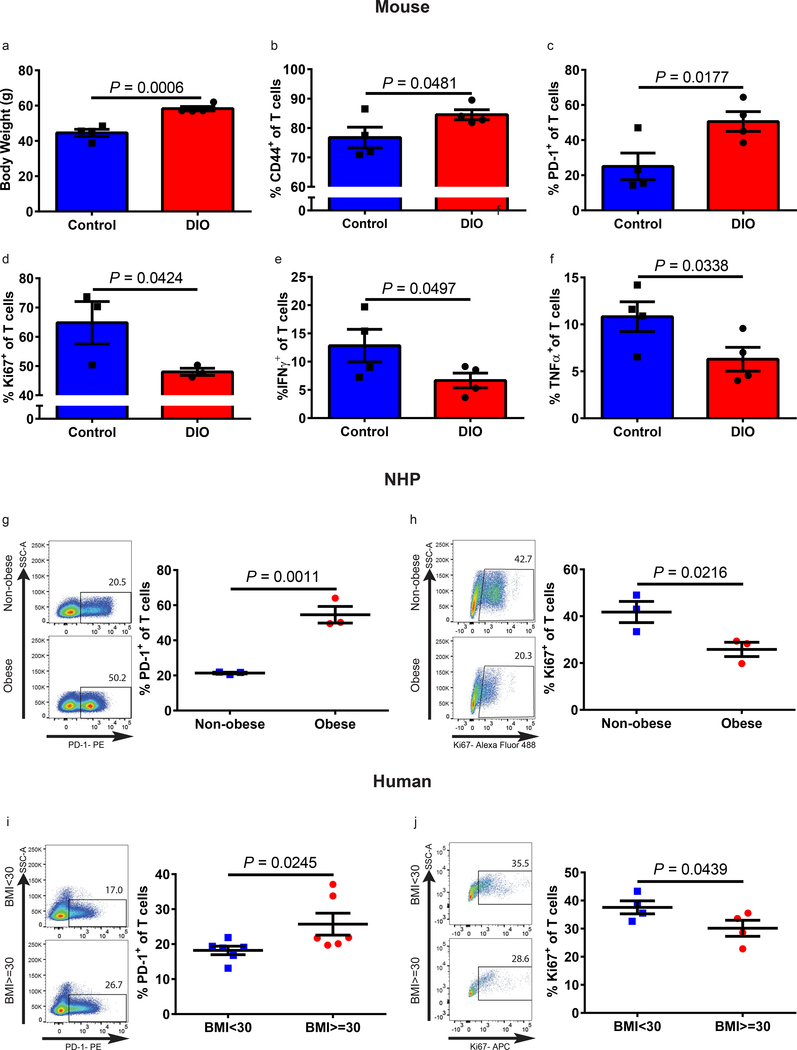
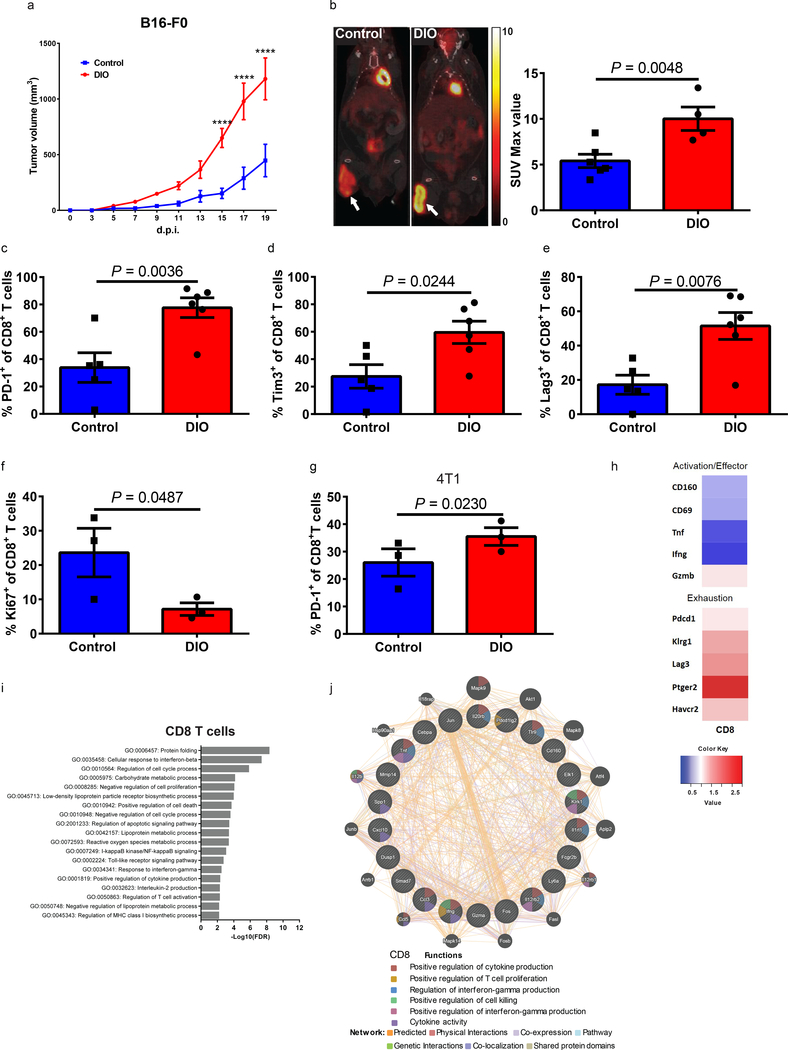
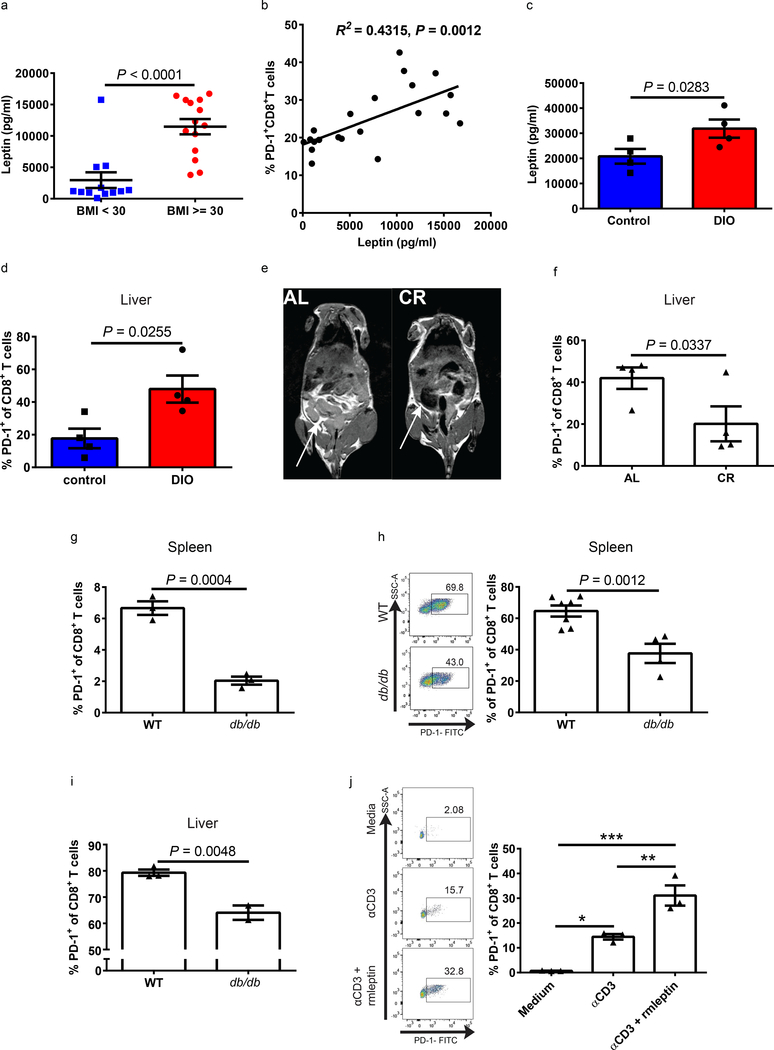
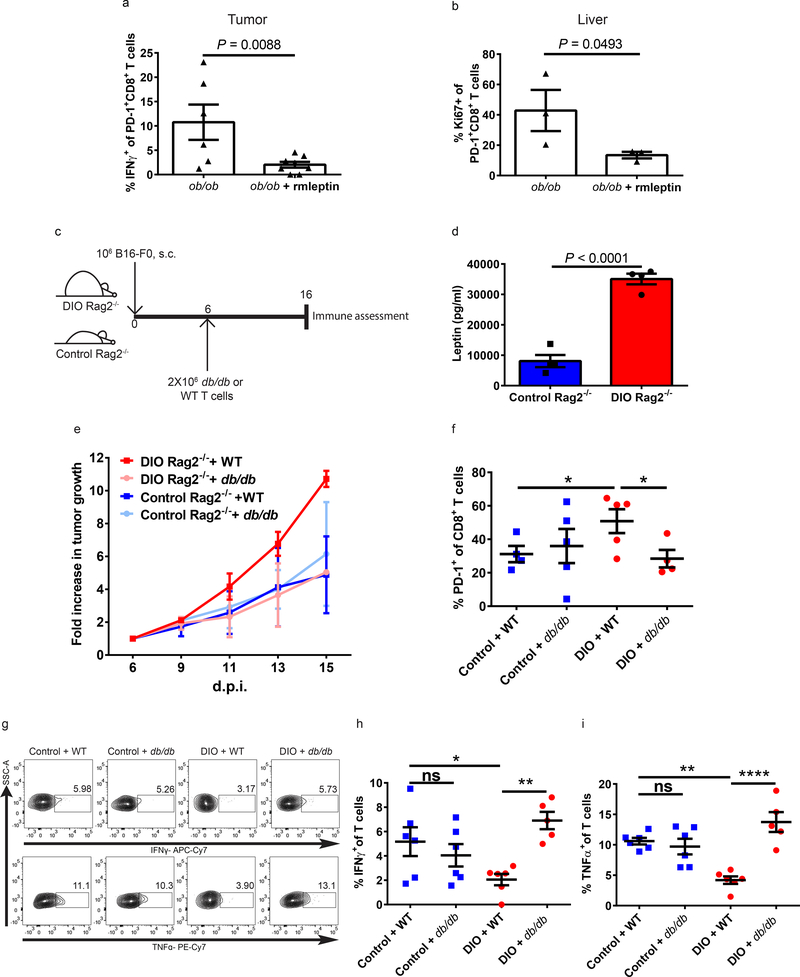
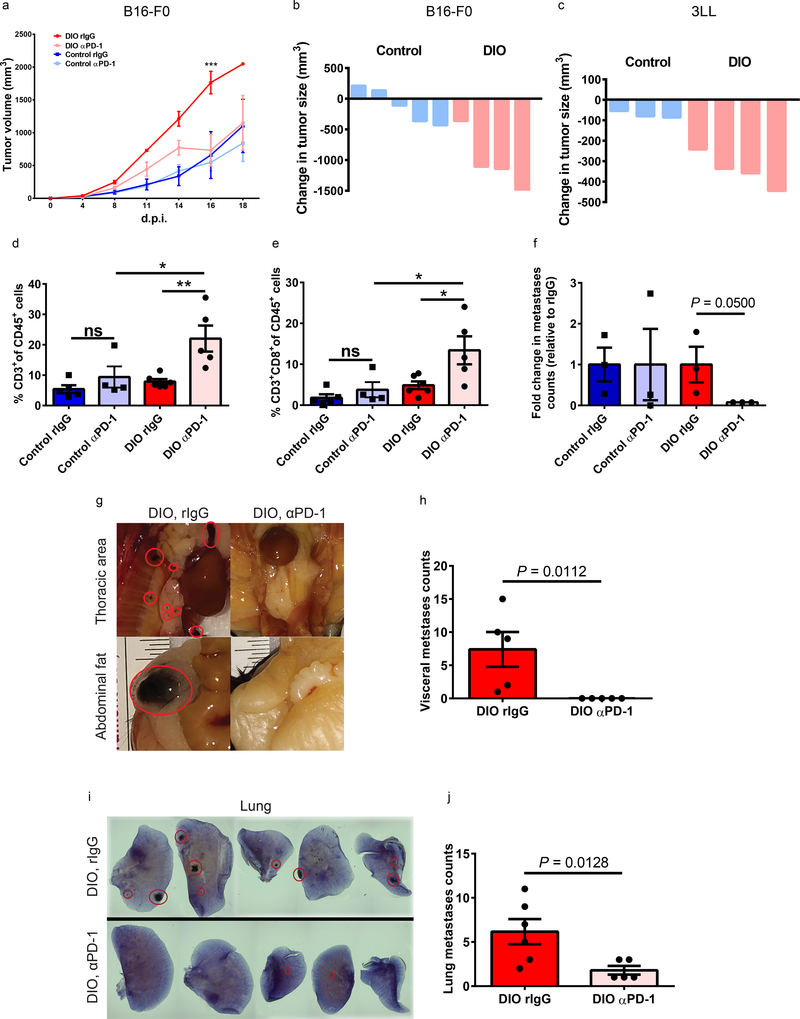
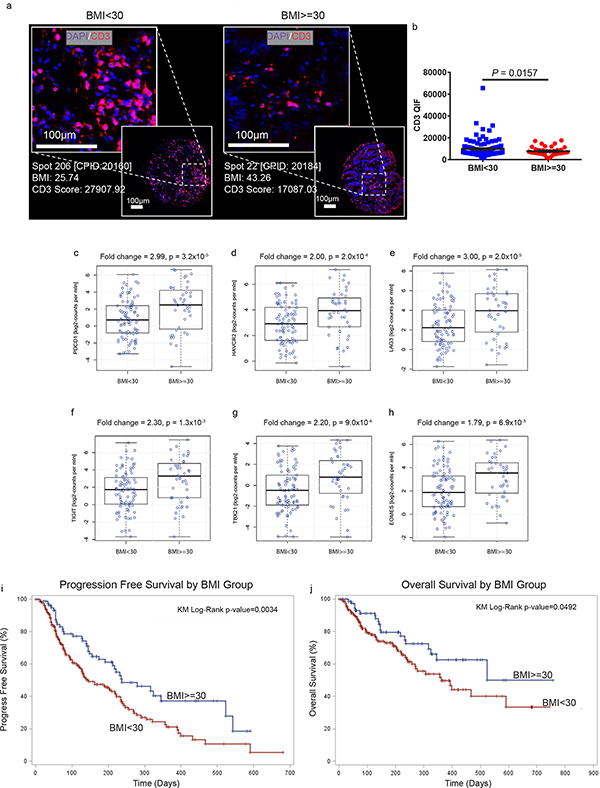
The recent successes of immunotherapy have shifted the paradigm in cancer treatment, but because only a percentage of patients are responsive to immunotherapy, it is imperative to identify factors impacting outcome. Obesity is reaching pandemic proportions and is a major risk factor for certain malignancies, but the impact of obesity on immune responses, in general and in cancer immunotherapy, is poorly understood. Here, we demonstrate, across multiple species and tumor models, that obesity results in increased immune aging, tumor progression and PD-1-mediated T cell dysfunction which is driven, at least in part, by leptin. However, obesity is also associated with increased efficacy of PD-1/PD-L1 blockade in both tumor-bearing mice and clinical cancer patients. These findings advance our understanding of obesity-induced immune dysfunction and its consequences in cancer and highlight obesity as a biomarker for some cancer immunotherapies. These data indicate a paradoxical impact of obesity on cancer. There is heightened immune dysfunction and tumor progression but also greater anti-tumor efficacy and survival after checkpoint blockade which directly targets some of the pathways activated in obesity.


Conflict of interest statement

Competing Interests Statement

The authors have no competing interests to declare.

Figures

Figure 1.
Figure 1.. Obesity-related T cell dysfunction across multiple species.
a) Body weights of 11–12-month-old male control and DIO mice (n=4/group). Frequency of b) CD44+ and c) PD-1+ T cells in the liver of 11–12-month-old male control and DIO mice (n=4/group) assessed by flow cytometry. Frequency of d) Ki67 (n=3/group), e) IFNγ (n=4/group), and f) TNFα (n=4/group) expressing T cells in the liver of 11–12-month-old male control and DIO mice after ex vivo stimulation. g) Representative flow plots and frequency of PD-1+ T cells in the peripheral blood of non-obese and obese rhesus macaques (n=3/group). h) Representative flow plots and frequency of Ki67 expressing T cells following ex vivo stimulation of rhesus macaque PBMCs (n=3/group). i) Representative flow plots and frequency of PD-1+ T cells in the peripheral blood of non-obese (BMI<30) and obese (BMI≥30) human healthy volunteers (n=6/group). j) Representative flow plots and frequency of Ki67 expressing T cells following ex vivo stimulation of healthy human PBMCs (n=4/group). Data in this figure are all depicted as mean ±s.e.m., with all individual points shown. One-tailed unpaired Student’s t-test p values shown.
Figure 2:
Figure 2:. Obesity promotes tumor growth and T cell exhaustion.
a) Tumor volume of B16-F0 melanoma subcutaneously inoculated in 6-month-old control (n=4) and DIO (n=5) C57BL/6 male mice. Tumor volumes depicted as mean ±s.e.m. Two-way ANOVA with Tukey post-hoc test p-values shown. b) Representative PET-CT images and quantification of tumor burden comparing 6-month-old B16-F0-tumor-bearing control (n=6) and DIO (n=4) mice 18 days post inoculation (d.p.i.). Frequency of c) PD-1, d) Tim3, and e) Lag3 on tumor-infiltrating CD8+ T cells from 6-month-old B16-F0-bearing control (n=5) and DIO (n=6) male mice at 16 d.p.i. f) Frequency of Ki67 on tumor-infiltrating CD8+ T cells from 6-month-old B16-F0-bearing control and DIO male mice (n=3/group). g) Frequency of PD-1 on tumor-infiltrating CD8+ T cells from 4T1-bearing control and DIO female mice (n=3/group) at 23 d.p.i. b-g) Data are depicted as mean ±s.e.m., with all individual points shown. One-tailed unpaired Student’s t-test p-values shown. h) Heat maps generated from RNAseq data showing differentially expressed activation/effector and exhaustion genes (≥1.5 fold difference in CD44+CD8+ T cells isolated from the spleens and lymph nodes of 6-month-old B16-F0-bearing control and DIO C57BL/6 male mice at 16 d.p.i. Data shown as fold change over controls (n=3/group). i) Candidate genes based on FDR cut-off of 1.5-fold change functionally categorized. The most significant pathways of candidate genes were analyzed using G:Profiler by the g:GOST comprehensive method (p<0.05) (n=3/group). j) Network analysis of down-regulated genes (DIO relative to control) in CD8+ T cells from enriched gene sets using GeneMANIA (n=3/group). **** p<0.001
Figure 3.
Figure 3.. Leptin level is correlated with PD-1 expression.
a) Leptin levels in non-obese (BMI<30, n=14) and obese (BMI≥30, n=12) healthy human volunteers. b) Linear regression analysis of leptin levels and PD-1 expression on CD8+ T cells in peripheral blood of human volunteers (n=21). c) Leptin levels and d) PD-1 expression on liver CD8+ T cells in 11–12-month-old control and DIO male mice (n=4/group). e) T1-weighted MRI demonstrating subcutaneous and visceral fat (fat appears bright white, white arrows) in 19-month-old ad-libitum (AL) fed and age-matched calorie restricted (CR) male mice. f) Frequency of PD-1 expressing CD8+ T cells in the liver of 19-month-old AL and CR male mice (n=4/group). g) Frequency of PD-1+CD8+ T cells from spleens of WT and db/db (9-month-old) male mice (n=3/group). Representative flow plots and frequency of PD-1 on h) splenic (n=7 in WT group, n=4 in db/db group) and i) liver (n=3 in WT group, n=2 in db/db group) CD8+ T cells of NSG mice 13 days post-transfer. a, c-d, f-i) Data are depicted as mean ±s.e.m., with all individual points shown. One-tailed unpaired Student’s t-test p-values shown. j) Representative flow plots and frequency of PD-1 expression on splenic CD8+ T cells ex vivo stimulated with αCD3, αCD3 and recombinant mouse leptin (αCD3+rmleptin), or unstimulated for 24 hrs (n=3 technical replicates). Data are depicted as mean ±s.e.m., with all individual points shown. One-way ANOVA with Tukey post-hoc test used to compare groups. *p<0.05, **p<0.01.
Figure 4:
Figure 4:. Lack of leptin signaling rescues T cells from exhaustion in obese mice.
a) Frequency of IFNγ+ tumor-infiltrating CD8+PD-1+ T cells after ex vivo stimulation (n=3/group, 2 technical replicates in ob/ob group, 2–3 technical replicates in ob/ob+rmleptin group) and b) frequency of Ki67 on CD8+PD-1+ T cells in the liver of 3-month-old ob/ob male B16-F0-bearing mice treated with or without rmleptin (n=3/group). c) Schema of C57BL/6 Rag2−/− mice challenged with B16 melanoma cells followed by adoptive transfer of T cells from either WT or db/db C57BL/6 mice. d) Serum leptin levels of 5-month-old control and DIO C57BL/6 Rag2−/− male mice (n=4/group). a-b, d) Data are depicted as mean ± s.e.m., with all individual points shown. One-tailed unpaired Student’s t-test used to compare groups. e) Fold change of B16-F0 tumor growth in control and DIO Rag2−/− mice after adoptive transfer of T cells from either WT or db/db C57BL/6 mice (fold change compared to tumor size at time of adoptive transfer) (n=2/group). f) Frequency of PD-1 expression on tumor-infiltrating CD8+ T cells from B16-F0-bearing control (n=4 in WT group, n=5 in db/db group) and DIO (n=5 in WT group, n=4 in db/db group) Rag2−/− mice with adoptive transfer of T cells from either WT or db/db C57BL/6 mice. g) Representative flow staining and frequency of h) IFNγ and i) TNFα producing tumor-infiltrating T cells after ex vivo stimulation collected from B16-F0-bearing control and DIO Rag2−/− mice with adoptive transfer of T cells from either WT or db/db mice (n=2/group, 2–3 technical replicates). f, h-i) Data are depicted as mean ±s.e.m., with all individual points shown. One-way ANOVA with Tukey post-hoc test used to compare groups. *p<0.05, **p<0.01, **** p<0.001.
Figure 5:
Figure 5:. Improved efficacy of aPD-1 treatment in DIO mice.
a) Volume of B16-F0 melanoma in 6-month-old control and DIO C57BL/6 male mice with and without αPD-1 treatment (n=4 in control and DIO rIgG groups, n=5 in control and DIO αPD-1 groups). Tumor volumes are depicted as mean ±s.e.m. Two-way ANOVA with Tukey post-hoc test used to compare groups. Waterfall plots of the volumes of b) B16-F0 (n=5 in control group, n=4 in DIO group) at 16 d.p.i. and c) 3LL lung carcinoma (n=3 in control group, n=4 in DIO group) at day 11 d.p.i. in 6-month-old control and DIO C57BL/6 male mice with and without αPD-1 treatment (graphed as change in tumor volume compared to non-treatment controls). Frequency of tumor-infiltrating d) CD3+ cells and e) CD8+ T cells as a percentage of CD45+ cells in the tumor (n=6 in DIO rIgG group, n=5 in control rIgG and DIO αPD-1 groups, n=4 in control αPD-1 group). Data are depicted as mean ±s.e.m., with all individual points shown. One-way ANOVA with Tukey post-hoc test used to compare groups. f) Fold change of total metastases in intravenously injected B16-F10-bearing control and DIO mice with and without αPD-1 treatment (graphed as change in tumor metastases counts compared to non-treatment controls) 28 d.p.i. (n=3/group). Data are depicted as mean ±s.e.m., with all individual points shown. Mann-Whitney test used to compare DIO rIgG and αPD-1 groups. g) Representative pictures and h) quantification of metastases in visceral fat of non-treated and treated B16-F10-bearing DIO mice (n=5/group). Data are depicted as mean ±s.e.m., with all individual points shown. One-tailed unpaired Student’s t-test p-value shown. i) Representative staining and j) quantification of lung metastases in non-treated and treated B16-F10-bearing DIO mice (n=6 in rIgG group, n=5 in αPD-1 group). Data are depicted as mean ±s.e.m., with all individual points shown. One-tailed unpaired Student’s t-test p-value shown. *p<0.05, **p<0.01, ***p<0.005.
Figure 6:
Figure 6:. T cell profile and improved efficacy of aPD-(L)1 immunotherapy in obese cancer patients.
a) Representative immunofuorescent staining and b) bar graph of CD3+ infiltrates in the TME of human CRCs (n=113 in BMI<30 group, n=39 in BMI>=30 group). Data are depicted as mean ±s.e.m., with all individual points shown. One-tailed unpaired Student’s t-test p-value shown. Human TCGA data analysis of c) PDCD1 (PD-1), d) HAVCR2 (Tim3), e) LAG3, f) TIGIT, g) TBX21 (T-bet), and h) EOMES expression in melanoma tumors in non-obese (n=86) versus obese (n=40) patients. The line within each notch box represents the median. The lower and upper boundaries of the box indicate first and third quartiles respectively. The whiskers indicate the minimum and maximum values. P‐value was calculated via DESeq2 (Wald‐Test) to compare groups. i) PFS and j) OS of 250 human cancer patients treated with PD-(L)1 checkpoint blockade and stratified by BMI (n= 169 in BMI<30, n=81 in BMI>=30). i-j) Kaplan-Meier estimates of PFS and OS.

Comment in

Similar articles

Cited by

References

    1. Robert C et al. Pembrolizumab versus Ipilimumab in Advanced Melanoma. N Engl J Med 372, 2521–2532, doi:10.1056/NEJMoa1503093 (2015). - DOI - PubMed
    1. Garon EB et al. Pembrolizumab for the treatment of non-small-cell lung cancer. N Engl J Med 372, 2018–2028, doi:10.1056/NEJMoa1501824 (2015). - DOI - PubMed
    1. Powles T et al. MPDL3280A (anti-PD-L1) treatment leads to clinical activity in metastatic bladder cancer. Nature 515, 558–562, doi:10.1038/nature13904 (2014). - DOI - PubMed
    1. Wherry EJ & Kurachi M Molecular and cellular insights into T cell exhaustion. Nat Rev Immunol 15, 486–499, doi:10.1038/nri3862 (2015). - DOI - PMC - PubMed
    1. Barber DL et al. Restoring function in exhausted CD8 T cells during chronic viral infection. Nature 439, 682–687, doi:10.1038/nature04444 (2006). - DOI - PubMed

Publication types

MeSH terms