. 2018 Dec;24(12):1837-1844.
doi: 10.1038/s41591-018-0236-y. Epub 2018 Nov 12.

Disease-specific oligodendrocyte lineage cells arise in multiple sclerosis

Affiliations

Disease-specific oligodendrocyte lineage cells arise in multiple sclerosis

Ana Mendanha Falcão et al. Nat Med. 2018 Dec.

Abstract

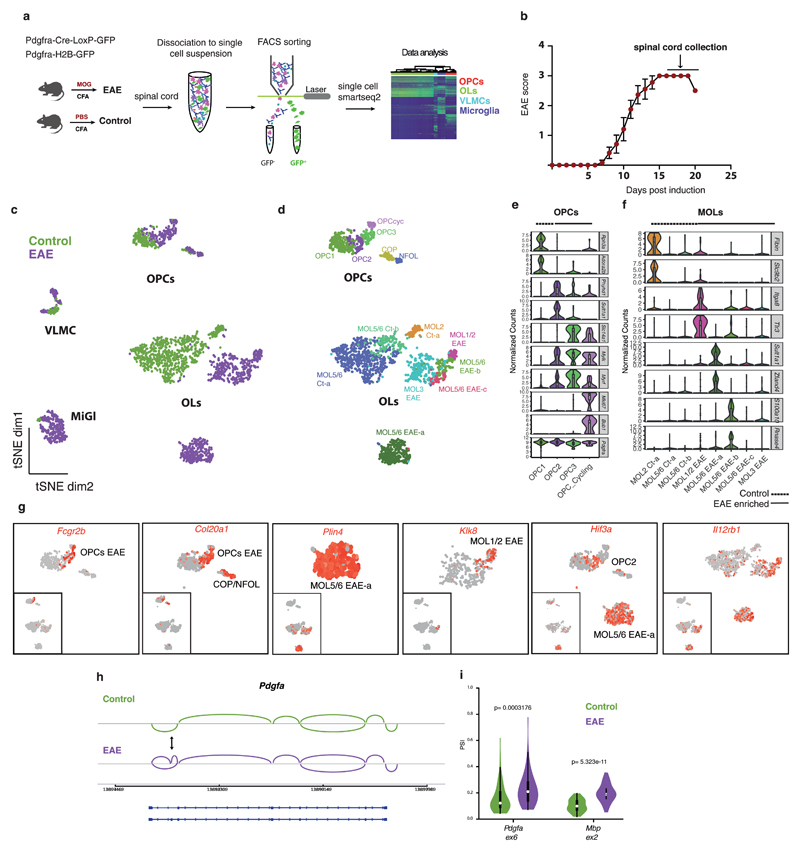
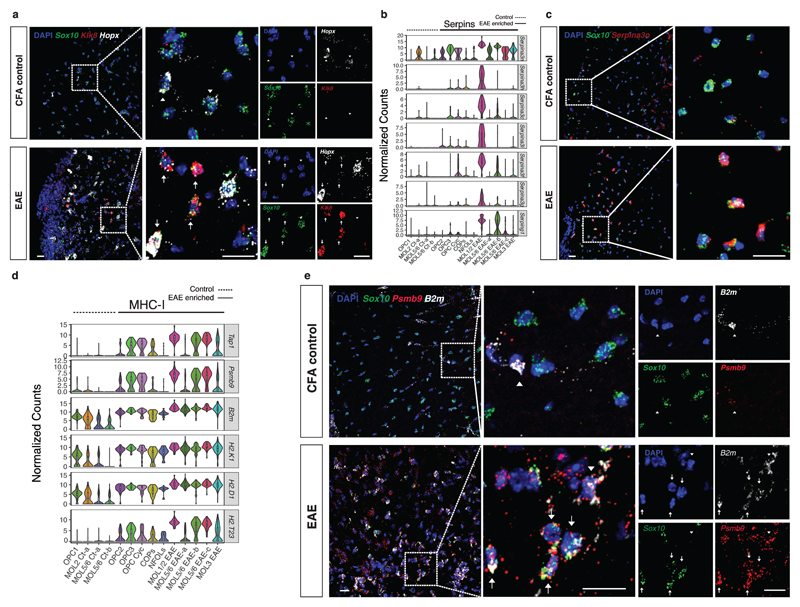
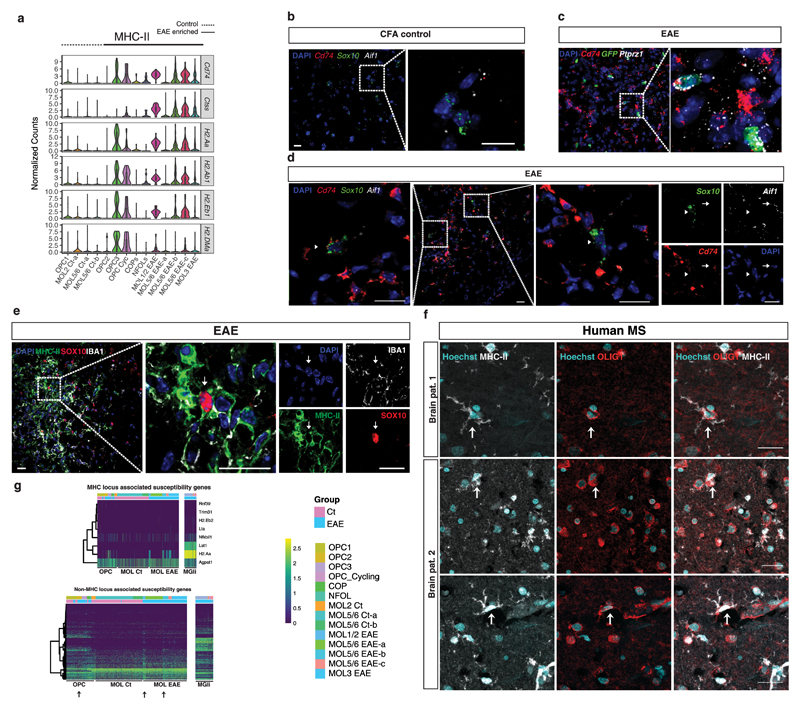
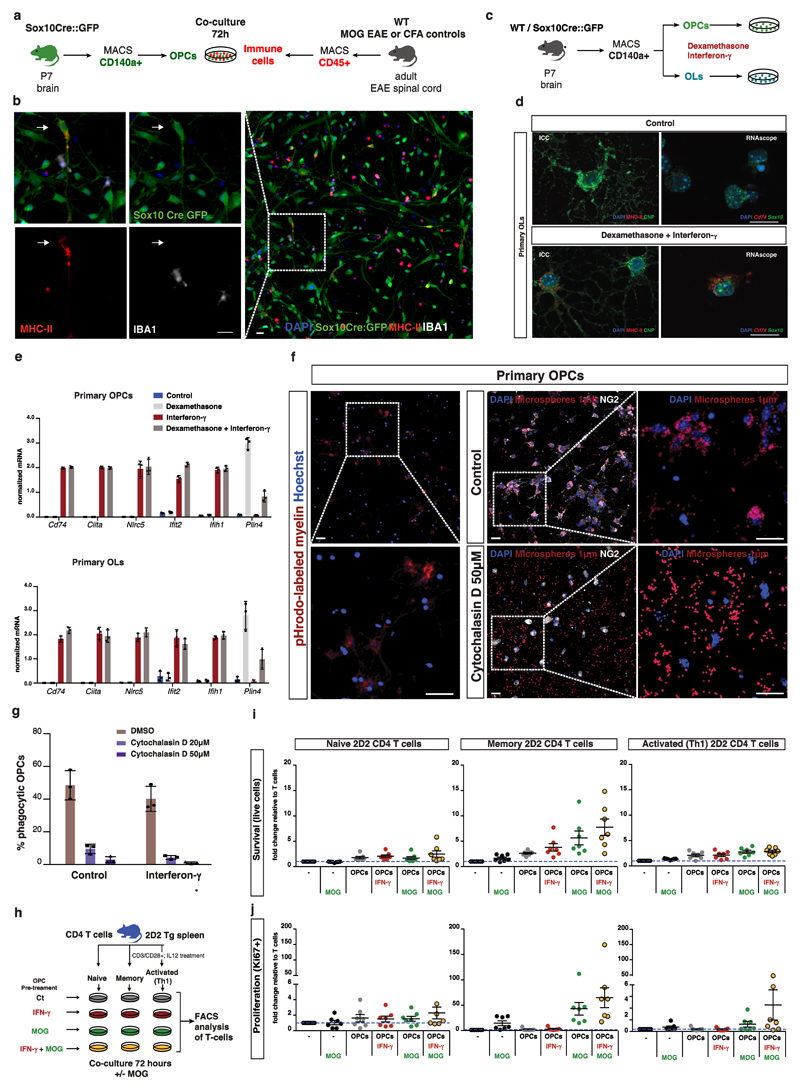
Multiple sclerosis (MS) is characterized by an immune system attack targeting myelin, which is produced by oligodendrocytes (OLs). We performed single-cell transcriptomic analysis of OL lineage cells from the spinal cord of mice induced with experimental autoimmune encephalomyelitis (EAE), which mimics several aspects of MS. We found unique OLs and OL precursor cells (OPCs) in EAE and uncovered several genes specifically alternatively spliced in these cells. Surprisingly, EAE-specific OL lineage populations expressed genes involved in antigen processing and presentation via major histocompatibility complex class I and II (MHC-I and -II), and in immunoprotection, suggesting alternative functions of these cells in a disease context. Importantly, we found that disease-specific oligodendroglia are also present in human MS brains and that a substantial number of genes known to be susceptibility genes for MS, so far mainly associated with immune cells, are expressed in the OL lineage cells. Finally, we demonstrate that OPCs can phagocytose and that MHC-II-expressing OPCs can activate memory and effector CD4-positive T cells. Our results suggest that OLs and OPCs are not passive targets but instead active immunomodulators in MS. The disease-specific OL lineage cells, for which we identify several biomarkers, may represent novel direct targets for immunomodulatory therapeutic approaches in MS.


Conflict of interest statement

Competing interests:

The G.C-B research group has received funding from F. Hoffmann – La Roche, Ltd. for another research project in the area.

Figures

Figure 1
Figure 1. Single cell RNA-sequencing of oligodendrocyte (OL) lineage cells in response to experimental autoimmune encephalomyelitis (EAE) uncovers new disease-specific populations and disease markers.
a, Schematic overview of the methodology used to perform single-cell RNA-seq of the OL lineage cells. b, Clinical score of the diseased animals used in the study (n=12 mice; data represented as mean ± s.e.m.; only animals that reached score 3 and one that reached score 2.5 were used in this study). c, t-SNE plots of all cells sequenced showing the segregation of cells derived from Complete Freund's Adjuvant (CFA) controls and EAE (n=4 biologically independent mouse spinal cord samples per condition; total number of cells is 794 for controls and 971 for EAE). d, t-SNE plots of all cells sequenced representing different cell populations within OL lineage cells. Mature oligodendrocyte (MOL) identities were defined according to marker genes identified in ref. 4 (n=4 biologically independent mouse spinal cord samples per condition; total number of cells is 745 for controls and 707 for EAE). e-f, Violin plots depicting the expression of specific markers for OL precursor cells (OPC) (e) and for MOL clusters (f) (n=4 biologically independent mouse spinal cord samples per condition; total number of cells is 116 for OPC controls and 132 for OPC EAE and 626 for MOL controls and 575 for MOL EAE). Violin plots are centered around the median with interquartile ranges and shape represents cell distribution. g, t-SNE plots of disease-specific markers for OL lineage cells (n=4 biologically independent mouse spinal cord samples per condition; total number of cells is 745 for controls and 707 for EAE). h, Schematic representation of the exon 6 inclusion in the Pdgfa gene in response to EAE. i, Violin plot representing the PSI (proportion of spliced isoform) in controls (MOL2 Ct-a depicted in green) and EAE (MOL1/2 EAE depicted in purple) of the alternative spliced exons in Pdgfa and Mbp genes. PSI=0 means totally excluded and PSI=1 totally included (n=4 biologically independent mouse spinal cord samples per condition; total number of cells is 56 for MOL2 Ct-a and 49 for MOL1/2 EAE; Pdgfa ex6: p=0.0003176 and Mbp ex2: p=5.323e-11 by two-sided Wilcoxon rank sum test with continuity correction; Violin plots are centered around the median with interquartile ranges and shape represents cell distribution. VLMCs - vascular and leptomeningeal cells; MiGl - Microglia-like cells.
Figure 2
Figure 2. Expression of immunoprotective and adaptive immunity genes in response to EAE.
a, RNAscope ISH representing a spinal cord from CFA control and EAE mice marked with probes for Sox10, Klk8 and Hopx, markers of MOL1/2-EAE. Dashed boxes shown at higher magnification highlight regions with higher densities of MOL1/2 cells. Arrows depict triple positive cells in EAE and arrowheads depict Hopx positive OL lineage cells negative for Klk8. Representative images, n=3 biologically independent mouse spinal cord samples. Scale bars - 20μm b, Violin plots representing Serpina3 family of genes in OL lineage cell populations derived from CFA controls and EAE mice. (n=4 biologically independent mouse spinal cord samples per condition; total number of cells is 745 for controls and 707 for EAE). Violin plots are centered around the median with interquartile ranges and shape represents cell distribution. c, RNAscope ISH representing a spinal cord from CFA control and EAE mice marked with probes for Sox10 and Serpina3n. Representative images, n=3 biologically independent mouse spinal cord samples. Scale bars - 20μm. d, Violin plots representing MHC class I related genes in OL lineage cell populations derived from CFA controls and EAE mice. (n=4 biologically independent mouse spinal cord samples per condition; total number of cells is 745 for controls and 707 for EAE). Violin plots are centered around the median with interquartile ranges and shape represents cell distribution. e, RNAscope ISH representing a spinal cord from CFA control and EAE mice marked with probes for Sox10, and MHC-I related genes, Psmb9 and B2m. Arrows depict triple positive cells, arrowheads depict cells double positive for Psmb9/B2m and negative for Sox10 that do not belong to the OL lineage. Representative images, n=3 biologically independent mouse spinal cord samples, scale bars - 20μm.
Figure 3
Figure 3. Expression of MHC class II and MS susceptibility genes in the OL lineage cells in response to EAE and in MS.
a Violin plots representing MHC class II related genes in OL lineage cell populations derived from CFA controls and EAE mice. (n=4 biologically independent mouse spinal cord samples per condition; total number of cells is 745 for controls and 707 for EAE). Violin plots are centered around the median with interquartile ranges and shape represents cell distribution. b-d, RNAscope ISH representing spinal cords from CFA control and EAE mice marked with probes for MHC-II (Cd74), OL lineage cells (Sox10 and Ptprz1/Pdgfra-H2B-GFP specific for OPCs) and microglia (Aif1). Dashed boxes shown at higher magnification represent both OL lineage cells expressing MHC-II (arrowhead), and microglia cells expressing MHC-II (arrow). Representative images, n=3 biologically independent mouse spinal cord samples per condition, scale bars - 20μm. e, Immunohistochemistry showing OL lineage cells (positive for Sox10) co-expressing MHC-II protein, in a lesion in the spinal cord of EAE mice. Representative images, n=3 biologically independent mouse spinal cord samples per condition, scale bars - 20μm. f, Immunohistochemistry in human samples from two MS patients representing OLIG1 positive OLs expressing MHC-II (arrows). Representative images, n=2 biologically independent human brain samples. Scale bars - 25μm. g, Expression-based heat maps for the MS susceptibility genes (from ref. 1) in microglia and OL lineage cells. MHC locus and non-MHC locus related genes are represented in both microglia and all OL lineage cells populations analyzed in this study.
Figure 4
Figure 4. OPCs express MHC-II in response to interferon-γ, exhibit phagocytic capacity and regulate T cell survival and proliferation.
a, Schematic representation of co-culture between OPCs isolated from Sox10-Cre-GFP mice and CD45+ immune cells isolated from EAE mice or CFA controls. b, Immunohistochemistry showing OL lineage cells (positive for Sox10) co-expressing MHC-II protein, but not the microglia marker IBA1, upon co-culture with CD45+ immune cells from EAE mice. Representative images, n=3 independent experiments, scale bars - 20μm. c, Schematic representation of treatment of OPCs and OLs with interferon-γ (100 ng/ml) and dexamethasone (1μM). d, OLs cultured with dexamethasone and interferon-γ for 72h express MHC-II as represented by Cd74/Sox10 and MHC-II/CNP double staining in RNAscope ISH and immunocytochemistry, respectively. Representative images, n=3 independent experiments. Scale bars - 20μm. e, qRT-PCR analysis for MHC and interferon responsive genes on primary OPCs and OLs treated with interferon-γ and dexamethasone, n=3 independent experiments per condition; data represented as mean ± s.d. f, Uptake of pHrodo-labeled myelin and 1μm diameter fluorescent microspheres by primary NG2+ OPCs after 6 and 24 hours, respectively, and upon treatment with 50μM of cytochalasin D. Representative images, n=3 independent experiments. Scale bars - 20μm. g, Quantification of the percentage of OPCs uptaking microspheres in the presence or absence of IFN–γ (100 ng/ml) and upon treatment with 20 and 50μM of cytochalasin D. n=3 independent experiments per condition; data represented as mean ± s.d. h, Schematic representation of co-culture between primary OPCs, treated with interferon-γ and/or MOG 35-55 peptide, and three different types of CD4 lymphocytes (naïve, memory and activated Th1) from 2D2 transgenic mice, where a high proportion of CD4 T-lymphocytes express a T-cell receptor specific for MOG35-55 peptide. i-j, Graph plots obtained from FACS analysis of naïve, memory and activated Th1 2D2 CD4 T cells after 72 hours of co-culture with OPCs. General survival (dead cell exclusion marker) and proliferation (CD4+ Vβ11+ Ki67+) were assessed. Numbers of cells in the live gate as well as in the Ki67+ gate were estimated and reflect survival and proliferation since the same cell numbers were seeded onto different wells. Plots represent the averages of the assessed values for the different conditions divided by the values of the control (T cells only) for fold change differences. n=7 independent experiments; data represented as mean ± s.e.m.

Comment in

References

    1. Patsopoulos N, et al. The Multiple Sclerosis Genomic Map: Role of peripheral immune cells and resident microglia in susceptibility. bioRxiv. 2017 doi: 10.1101/143933. - DOI - PMC - PubMed
    1. Skene NG, Grant SG. Identification of Vulnerable Cell Types in Major Brain Disorders Using Single Cell Transcriptomes and Expression Weighted Cell Type Enrichment. Front Neurosci. 2016;10:16. doi: 10.3389/fnins.2016.00016. - DOI - PMC - PubMed
    1. Marques S, et al. Transcriptional Convergence of Oligodendrocyte Lineage Progenitors during Development. Dev Cell. 2018;46:504–517 e507. doi: 10.1016/j.devcel.2018.07.005. - DOI - PMC - PubMed
    1. Marques S, et al. Oligodendrocyte heterogeneity in the mouse juvenile and adult central nervous system. Science. 2016;352:1326–1329. - PMC - PubMed
    1. Picelli S, et al. Smart-seq2 for sensitive full-length transcriptome profiling in single cells. Nat Methods. 2013;10:1096–1098. doi: 10.1038/nmeth.2639. - DOI - PubMed

Publication types

MeSH terms

Substances