. 2018 Nov 12;8(1):16708.
doi: 10.1038/s41598-018-35058-3.

Correlation between genomic index lesions and mpMRI and 68Ga-PSMA-PET/CT imaging features in primary prostate cancer

Affiliations

Correlation between genomic index lesions and mpMRI and 68Ga-PSMA-PET/CT imaging features in primary prostate cancer

Claudia Kesch et al. Sci Rep. .

Abstract

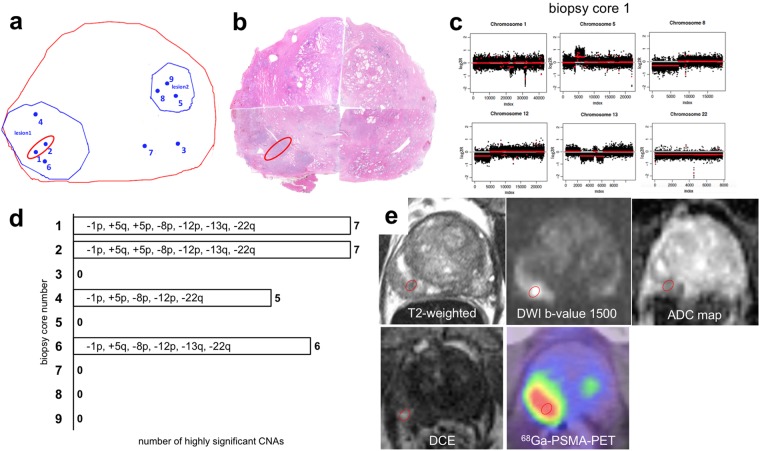
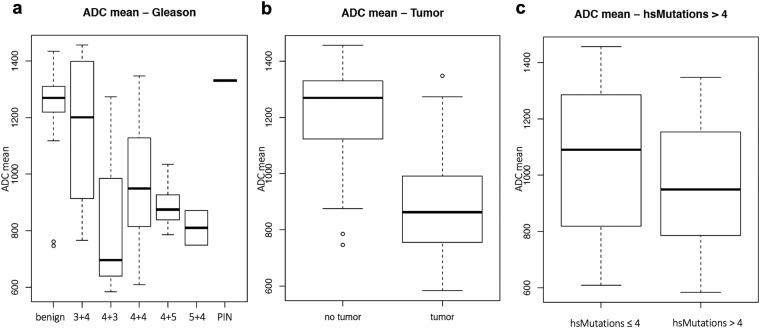
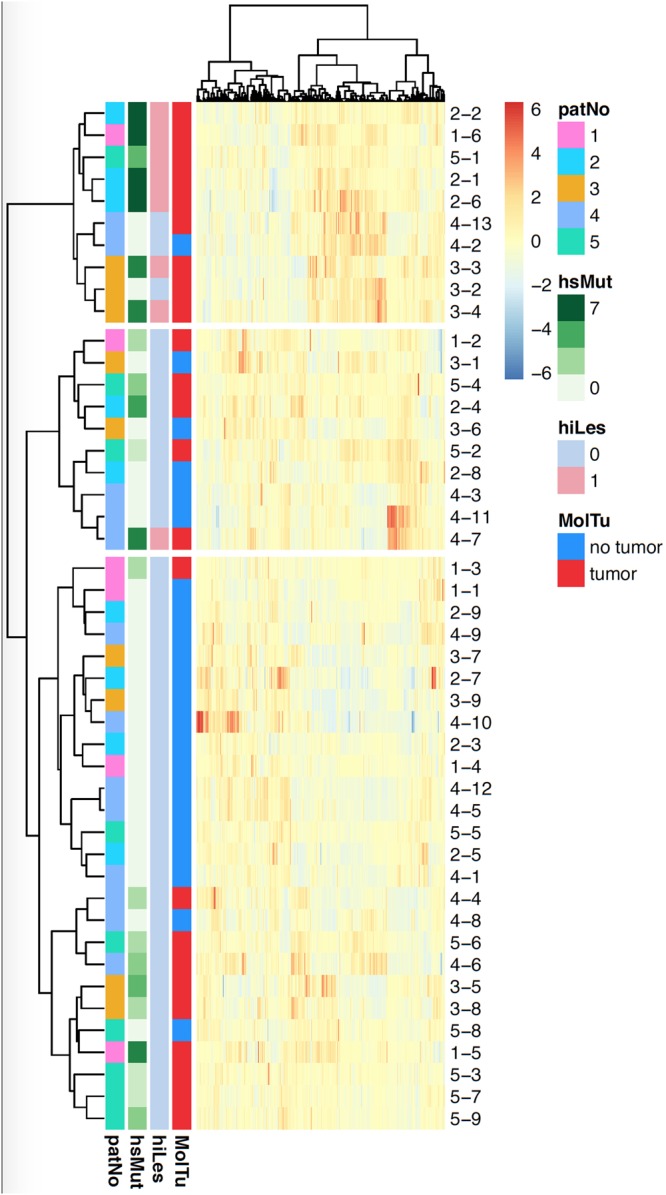
Magnetic resonance imaging (MRI) and prostate specific membrane antigen (PSMA)- positron emission tomography (PET)/computed tomography (CT)-imaging of prostate cancer (PCa) are emerging techniques to assess the presence of significant disease and tumor progression. It is not known, however, whether and to what extent lesions detected by these imaging techniques correlate with genomic features of PCa. The aim of this study was therefore to define a genomic index lesion based on chromosomal copy number alterations (CNAs) as marker for tumor aggressiveness in prostate biopsies in direct correlation to multiparametric (mp) MRI and 68Ga-PSMA-PET/CT imaging features. CNA profiles of 46 biopsies from five consecutive patients with clinically high-risk PCa were obtained from radiologically suspicious and unsuspicious areas. All patients underwent mpMRI, MRI/TRUS-fusion biopsy, 68Ga-PSMA-PET/CT and a radical prostatectomy. CNAs were directly correlated to imaging features and radiogenomic analyses were performed. Highly significant CNAs (≥10 Mbp) were found in 22 of 46 biopsies. Chromosome 8p, 13q and 5q losses were the most common findings. There was an strong correspondence between the radiologic and the genomic index lesions. The radiogenomic analyses suggest the feasibility of developing radiologic signatures that can distinguish between genomically more or less aggressive lesions. In conclusion, imaging features of mpMRI and 68Ga-PSMA-PET/CT can guide to the genomically most aggressive lesion of a PCa. Radiogenomics may help to better differentiate between indolent and aggressive PCa in the future.


Conflict of interest statement

The authors declare no competing interests.

Figures

Figure 1
Figure 1
Correlation between genomic index lesions and imaging parameters in a representative patient. Synopsis of (a) projection map of MRI/TRUS fusion biopsy of patient 2. The prostate margin is shown in red, pre-biopsy mpMRI suspicious lesions in blue and individual biopsy cores that were sent for genomic testing as blue dots. Genomic index lesions are encircled in red; (b) virtual whole mount of the prostatectomy specimen with the red circle matching the genomic index lesion by visual comparison; (c) CNA profiles of the genomic index lesion; (d) overview of CNAs of all biopsies harboring highly significant alterations; (e) mpMRI components (T2w, DWI b-value = 1500 s/mm2, ADC map and early arterial phase of DCE-MRI) and 68Ga-PSMA-11-PET/CT are shown. The visually matched location of the genomic index lesion on individual components is superimposed on the axial slices centered on the mpMRI lesion used during MRI/TRUS biopsy.
Figure 2
Figure 2
Association between ADC and important markers of tumor aggressiveness. Association between mean apparent diffusion (ADC) values and (a) genetic tumor signature, (b) Gleason score, (c) highly significant mutations >4.
Figure 3
Figure 3
Patient-corrected clustering analysis. Patient-corrected clustering analysis of radiomic features using Ward’s D linkage and correlation distance for all radiomic features (patNo = Patient number, hsMut = number of highly significant copy number alterations [CNAs], hiLes = presence of high-aggressiveness pattern, defined as genomic index lesion, MolTu = molecular tumor signature).

References

    1. Siegel RL, Miller KD, Jemal A. Cancer statistics, 2018. CA. Cancer J. Clin. 2018;68:7–30. doi: 10.3322/caac.21442. - DOI - PubMed
    1. Spratt DE, Zumsteg ZS, Feng FY, Tomlins SA. Translational and clinical implications of the genetic landscape of prostate cancer. Nat. Rev. Clin. Oncol. 2016;13:597. doi: 10.1038/nrclinonc.2016.76. - DOI - PMC - PubMed
    1. Taylor BS, et al. Integrative Genomic Profiling of Human Prostate Cancer. Cancer Cell. 2010;18:11–22. doi: 10.1016/j.ccr.2010.05.026. - DOI - PMC - PubMed
    1. Lapointe J, et al. Genomic Profiling Reveals Alternative Genetic Pathways of Prostate Tumorigenesis. Cancer Res. 2007;67:8504–8510. doi: 10.1158/0008-5472.CAN-07-0673. - DOI - PubMed
    1. Williams JL, Greer PA, Squire JA. Recurrent copy number alterations in prostate cancer: an in silico meta-analysis of publicly available genomic data. Cancer Genet. 2014;207:474–488. doi: 10.1016/j.cancergen.2014.09.003. - DOI - PubMed

Publication types

MeSH terms