. 2019 Feb;23(2):1072-1085.
doi: 10.1111/jcmm.14008. Epub 2018 Nov 13.

α-galactosylceramide generates lung regulatory T cells through the activated natural killer T cells in mice

Affiliations

α-galactosylceramide generates lung regulatory T cells through the activated natural killer T cells in mice

Qianhui Chen et al. J Cell Mol Med. 2019 Feb.

Abstract

Our previous study showed that intraperitoneal injection of α-galactosylceramide (α-GalCer) has the ability to activate lung iNKT cells, but α-GalCer-activated iNKT cells do not result in airway inflammation in wild-type (WT) mice. Many studies showed that iNKT cells had the capacity to induce Treg cells, which gave rise to peripheral tolerance. Therefore, we examined the influence of intraperitoneal administration of α-GalCer on the expansion and suppressive activity of lung Treg cells using iNKT cell-knockout mice and co-culture experiments in vitro. We also compared airway inflammation and airway hyperresponsiveness (AHR) after α-GalCer administration in specific anti-CD25 mAb-treated mice. Our data showed that intraperitoneal injection of α-GalCer could promote the expansion of lung Treg cells in WT mice, but not in iNKT cell-knockout mice. However, α-GalCer administration could not boost suppressive activity of Treg cells in WT mice and iNKT cell-knockout mice. Interestingly, functional inactivation of Treg cells could induce airway inflammation and AHR in WT mice treated with α-GalCer. Furthermore, α-GalCer administration could enhance iNKT cells to secrete IL-2, and neutralization of IL-2 reduced the expansion of Treg cells in vivo and in vitro. Thus, intraperitoneal administration of α-GalCer can induce the generation of lung Treg cells in mice through the release of IL-2 by the activated iNKT cells.

Keywords: interleukin -2; invariant natural killer cells; regulatory T cells; α-galactosylceramide.


Figures

Figure 1
Figure 1
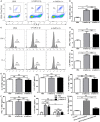
Intraperitoneal administration of α‐galactosylceramide (α‐GalCer) could promote IL‐10 through the activation of iNKT cells in WT mice. A, Lung iNKT cells from WT mice intraperitoneally (ip.) or intravenously (iv.) treated with α‐GalCer or intraperitoneally treated with PBS were determined using flow cytometry. The gating used for lung iNKT cells (PBS‐57/mCD1d+ TCR‐β+) (gate P2) and the corresponding percentages are indicated in each dot plot. B, Percentages of lung iNKT cells in lung MNCs were determined. C, IFN‐γ (top) and IL‐4 (bottom) production in lung iNKT cells from WT mice intraperitoneally or intravenously treated with α‐GalCer or intraperitoneally treated with PBS were determined. The numbers above the parentheses showed the percentage of positive cells. D, Percentages of IFN‐γ‐ and IL‐4‐producing lung iNKT cells of WT mice intraperitoneally or intravenously treated with α‐GalCer or intraperitoneally treated with PBS. E, The levels of IL‐4, IL‐5 and IL‐13 in the bronchoalveolar lavage fluid (BALF) from WT mice intraperitoneally or intravenously treated with α‐GalCer or intraperitoneally treated with PBS. F, The concentration of IFN‐γ in the BALF from WT mice intraperitoneally or intravenously treated with α‐GalCer or intraperitoneally treated with PBS. G, The concentration of IL‐10 in the BALF from WT mice and CD1d−/− mice intraperitoneally or intravenously treated with α‐GalCer or intraperitoneally treated with PBS. H, The effect of intraperitoneal administration of α‐GalCer on the concentration of IL‐10 in the BALF from WT mice with anti‐CD25 mAb or IgG isotype treatment. Data are shown as mean ± SD of three independent experiments (n = 18) and one representative experiment is indicated. **< 0.01. NS, not significant
Figure 2
Figure 2
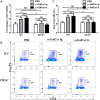
Intraperitoneal administration of α‐GalCer could enhance the expression of FoxP3 mRNA and expansion of CD4+ FoxP3+ Treg cells in the lung through the activation of iNKT cells in mice. A, Expression of FoxP3 mRNA of lung tissues from WT mice and CD1d‐knockout (CD1d−/−) mice intraperitoneally (ip.) or intravenously (iv.) treated with α‐GalCer or intraperitoneally treated with PBS was detected by quantitative RTPCR. B, Lung Treg cells were confirmed by CD4 and FoxP3 staining in WT mice or CD1d−/− mice intraperitoneally or intravenously treated with α‐GalCer or intraperitoneally treated with PBS using flow cytometry. The gating used for Treg cells (CD4+ FoxP3+ Treg cells) (gate P2) and the corresponding percentages are indicated in each dot plot. C, Percentages of lung Treg cells (CD4+ FoxP3+ Treg cells) in WT mice or CD1d−/− mice intraperitoneally or intravenously treated with α‐GalCer or intraperitoneally treated with PBS. Data are shown as mean ± SD of three independent experiments (n = 18), and one representative experiment is indicated. *< 0.05; **< 0.01. NS, not significant
Figure 3
Figure 3
α‐GalCer could not alter IL‐10 production and suppressive activity of Treg cells in vitro. A, Spleen Treg cells from WT mice and CD1d−/− mice treated with intraperitoneal (ip.) or intravenous (iv.) injection of α‐GalCer or intraperitoneal injection of PBS were cultured in vitro for 3 days, and then the concentration of IL‐10 in the supernatants was determined by ELISA. B, CD4+ CD25 T cells co‐cultured with the indicated ratio of Treg cells from WT mice or CD1d−/− mice treated with α‐GalCer or PBS for 3 days. The potency of the Treg‐mediated suppression was expressed as the relative inhibition of cytokine (IFN‐γ and IL‐4) production for each Treg/CD4+ CD25 T ratio. Data are shown as mean ± SD of three independent experiments (n = 15), and one representative experiment is indicated. NS, not significant
Figure 4
Figure 4
Intraperitoneal administration of α‐GalCer could induce airway inflammation and airway hyperresponsiveness (AHR) in WT mice treated with anti‐CD25 mAb. A, Histopathological analysis of lung tissue from anti‐CD25 mAb‐ or IgG isotype mAb‐treated WT mice intraperitoneally administrated with α‐GalCer or PBS using haematoxylin and eosin (HE) staining and periodic acid‐Schiff (PAS) staining. B, Total cell and differential cell counting in the BALF from anti‐CD25 mAb‐ or IgG isotype mAb‐treated WT mice intraperitoneally administrated with α‐GalCer or PBS. Tot, total cell counts; Eos, eosinophils; Neu, neutrophils; Mar, macrophages; Lym, lymphocytes. C, The concentrations of IL‐4, IL‐5, IL‐13, and IFN‐γ in the BALF from anti‐CD25 mAb‐ or IgG isotype mAb‐treated WT mice intraperitoneally administrated with α‐GalCer or PBS. Data are shown as mean ± SD of three independent experiments (n = 18), and one representative experiment is indicated. *< 0.05; **< 0.01. NS, not significant. D, Airway response to increasing concentrations of methacholine (Mch) was examined. Data are expressed as mean ± SD of three independent experiments (n = 5), and one representative experiment is indicated. Significant differences between anti‐CD25 mAb‐ or IgG isotype mAb‐treated WT mice intraperitoneally administrated with α‐GalCer or PBS are shown as *< 0.05 and **< 0.01
Figure 5
Figure 5
Intraperitoneal administration of α‐GalCer could promote IL‐2 production and expression of IL‐2 mRNA through the activation of iNKT cells in mice. A, BALF were collected from WT mice and CD1d−/− mice intraperitoneally treated with α‐GalCer or PBS, and IL‐2 production was analysed by ELISA. B, Culture supernatants of splenocytes were collected and IL‐2 production was analysed by ELISA. C, Cellular components of culture solution were obtained for RNA extracting and the expression of IL‐2 mRNA was detected by quantitative RTPCR. Data are shown as mean ± SD of three independent experiments (n = 18), and one representative experiment is indicated. *< 0.05; **< 0.01. NS, not significant
Figure 6
Figure 6
Anti‐IL‐2 mAb administration could reduce the number of Treg cells, but did not alter the suppressive function of Treg cells in WT mice intraperitoneally treated with α‐GalCer. A, Lung Treg cells were confirmed by CD4 and FoxP3 staining in anti‐IL‐2 mAb‐ or IgG isotype mAb‐treated WT mice intraperitoneally administrated with α‐GalCer or PBS using flow cytometry. The gating used for Treg cells (CD4+ FoxP3+ Treg cells) (gate P2) and the corresponding percentages are shown in each dot plot. B, Percentages of lung Treg cells in anti‐IL‐2 mAb‐ or IgG isotype mAb‐treated WT mice intraperitoneally administrated with α‐GalCer or PBS. C, CD4+ CD25 T cells co‐cultured with the indicated ratio of spleen Treg cells isolated from mice for 3 days. The potency of the Treg‐mediated suppression was expressed as the relative inhibition of cytokine (IFN‐γ and IL‐4) production for each Treg/CD4+ CD25 T ratio. Data are shown as mean ± SD of three independent experiments (n = 18), and one representative experiment is indicated. *< 0.05; **< 0.01
Figure 7
Figure 7
Treg cells induced by α‐GalCer‐activated iNKT cells involved in IL‐2 in vitro. A, Flow cytometry was used to determine the purity of lung iNKT cells, which was stained with both PBS‐57/mCD1d tetramers and a monoclonal antibody against TCR‐β (ie, the proportion of iNKT cells was over 94%). B, Treg cells of cellular components in culture solution were determined by CD4 and FoxP3 staining using flow cytometry. The gating used for Treg cells (CD4+ FoxP3+ Treg cells) (gate P2) and the corresponding percentages are indicated in each dot plot. C, The percentages of Treg cells from cellular components of culture solution. D, Expression of FoxP3 mRNA of cellular components of culture solution was detected by quantitative RTPCR. E, The concentration of IL‐10 in culture supernatants was determined by ELISA. Data are shown as mean ± SD of 3 independent experiments (n = 15), and 1 representative experiment is indicated. *< 0.05; **< 0.01
Figure 8
Figure 8
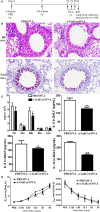
ɑ‐GalCer administration had the capacity to inhibit airway inflammation and AHR induced by ovalbumin (OVA). A, Timeline of the OVA/alum sensitization and OVA challenge protocol and the names of the administration groups (α‐GalCer or PBS). AHR was measured, and then the lung and BALF were obtained 24 h after the final OVA challenge. B, HE and PAS staining of lung sections. C, Total cell, differential cell counting, and the concentrations of cytokines (IL‐4, IL‐5, and IL‐13) in the BALF. Tot, total cell counts; Eos, eosinophils; Neu, neutrophils; Mar, macrophages; Lym, lymphocytes. Data are shown as mean ± SD of 3 independent experiments (n = 18), and 1 representative experiment is indicated. *< 0.05; **< 0.01. D, Airway response to increasing concentrations of Mch was examined. Data are expressed as mean ± SD of three independent experiments (n = 5), and one representative experiment is indicated. Significant differences are shown as *< 0.05 and **< 0.01

Similar articles

Cited by

References

    1. Lantz O, Bendelac A. An invariant T cell receptor alpha chain is used by a unique subset of major histocompatibility complex class I‐specific CD4+ and CD4−CD8− T cells in mice and humans. J Exp Med. 1994;180:1097‐1106. - PMC - PubMed
    1. Rossjohn J, Pellicci DG, Patel O, et al. Recognition of CD1d‐restricted antigens by natural killer T cells. Nat Rev Immunol. 2012;12:845‐857. - PMC - PubMed
    1. Zajonc DM, Cantu C 3rd, Mattner J, et al. Structure and function of a potent agonist for the semi‐invariant natural killer T cell receptor. Nat Immunol. 2005;6:810‐818. - PMC - PubMed
    1. Anderson BL, Teyton L, Bendelac A, Savage PB. Stimulation of natural killer T cells by glycolipids. Molecules. 2013;18:15662‐15688. - PMC - PubMed
    1. Bendelac A, Savage PB, Teyton L. The biology of NKT cells. Annu Rev Immunol. 2007;25:297‐336. - PubMed

Publication types