. 2019 Jan;27(1):30-40.
doi: 10.1002/oby.22316. Epub 2018 Nov 13.

Alcohol Intake and Weight Loss During Intensive Lifestyle Intervention for Adults with Overweight or Obesity and Diabetes

Affiliations

Alcohol Intake and Weight Loss During Intensive Lifestyle Intervention for Adults with Overweight or Obesity and Diabetes

Ariana M Chao et al. Obesity (Silver Spring). 2019 Jan.

Erratum in

Abstract

Objective: This study aimed to assess whether alcohol consumption decreases during an intensive lifestyle intervention (ILI) and whether alcohol consumption is associated with weight loss among participants with overweight or obesity and type 2 diabetes.

Methods: Participants (n = 4,901) were from the Action for Health in Diabetes (Look AHEAD) study, a randomized controlled trial that compared an ILI with a diabetes support and education (DSE) control. Mixed-effects models were used to estimate the effect of the ILI on alcohol consumption and the influence of alcohol consumption on weight loss at year 4.

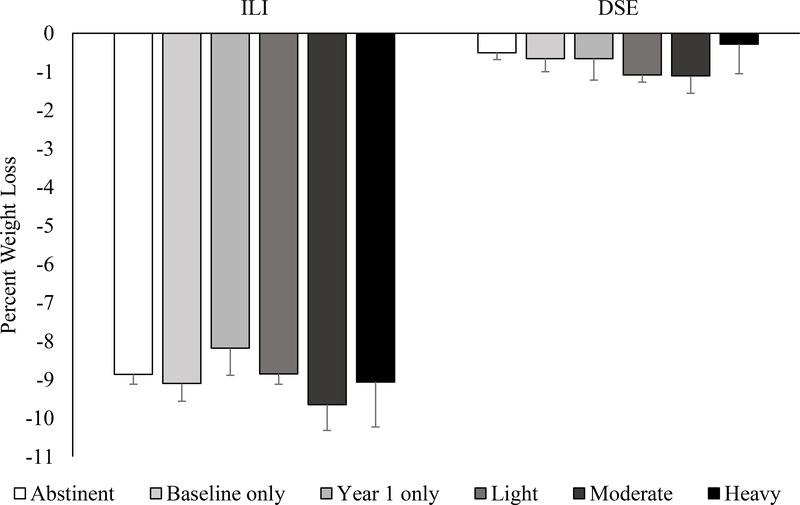
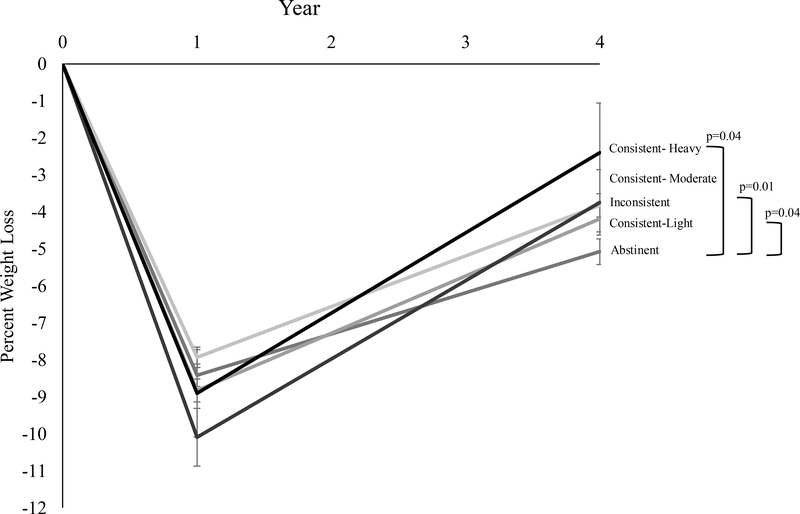
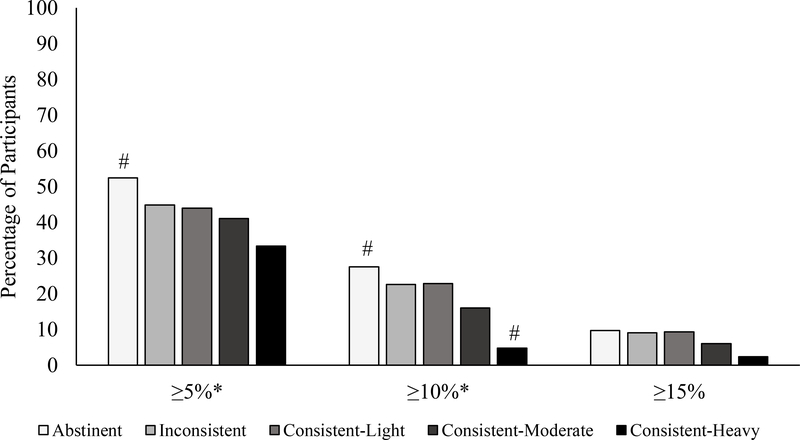
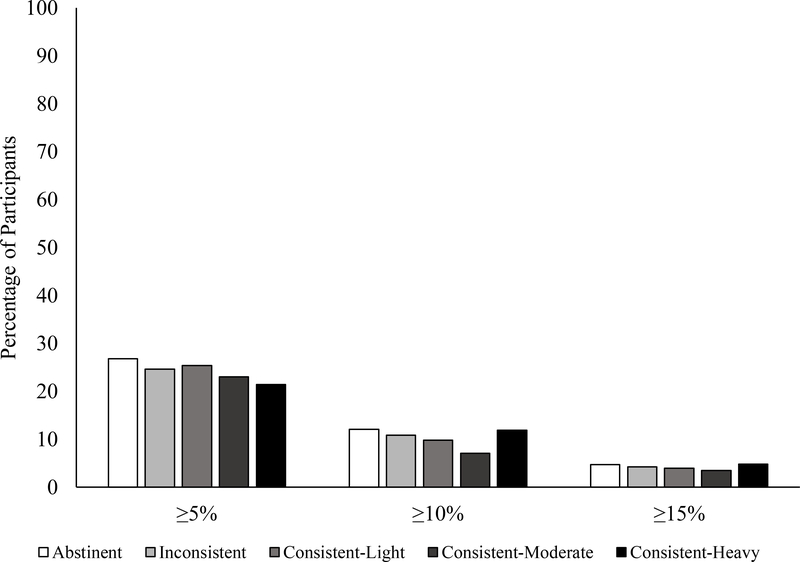
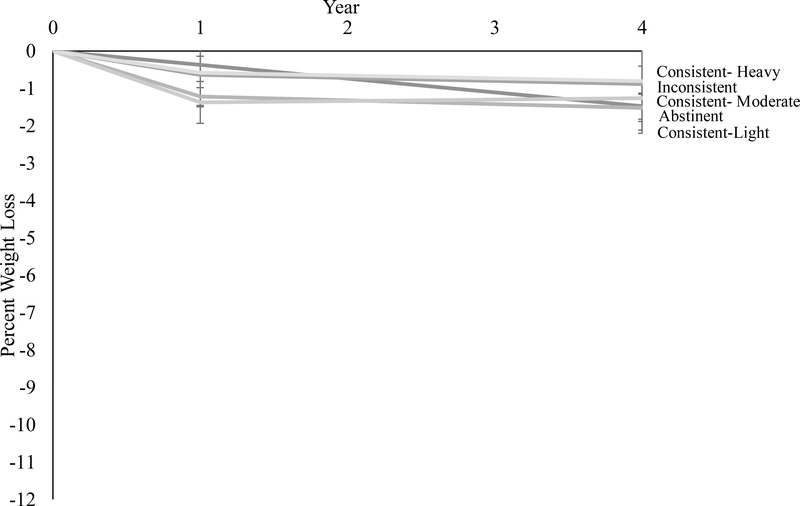
Results: ILI and DSE participants did not differ in changes in alcohol consumption. Alcohol intake was not associated with weight loss at year 1 of the ILI. ILI participants who abstained from alcohol lost 5.1% ± 0.3% of initial weight at year 4 compared with a significantly (P = 0.04) smaller 2.4% ± 1.3% for consistent heavy drinkers. ILI participants who abstained from alcohol consumption over the 4 years lost 1.6% ± 0.5% more weight relative to individuals who drank alcohol at any time during the intervention (P = 0.003). DSE participants did not differ in weight loss by alcohol consumption.

Conclusions: Heavy alcohol drinkers are at risk for suboptimal long-term weight loss. Decreasing alcohol consumption may improve weight management among individuals with diabetes.

Trial registration: ClinicalTrials.gov NCT00017953.


Figures

Figure 1.
Figure 1.
Percent weight change at year 1 by alcohol group (abstinent; baseline only; year 1 only; individuals who drank at both baseline and year 1 averaging to a light amount (<7 drinks/week for men and <4 drinks/week for women); those who drank at both times averaging to a moderate amount (7–14 drinks/week for men and 4–7 drinks/week for women); and participants who drank at both times averaging to a heavy amount (>14 drinks/week for men and >7 drinks/week for women)). DSE=diabetes support and education. ILI=intensive lifestyle intervention.
Figure 2.
Figure 2.
Percent reduction in initial weight at year 4 in the intensive lifestyle intervention group by alcohol consumption trajectory over the 4 years. Values shown are mean (± standard error), and weight losses were estimated by using linear mixed‐effects models controlling for baseline age, race/ethnicity, gender, education, smoking status, BMI, insulin use, diabetes duration, depressive symptoms, and physical and mental health-related quality of life.
Figure 3.
Figure 3.
Percentage of participants in the (a) intensive lifestyle intervention and (b) diabetes support and education groups who at year 4 met different categorical weight losses based on alcohol consumption trajectories. *p<0.05. #adjusted residual is ≤1.96 or ≥1.96.
Figure 3.
Figure 3.
Percentage of participants in the (a) intensive lifestyle intervention and (b) diabetes support and education groups who at year 4 met different categorical weight losses based on alcohol consumption trajectories. *p<0.05. #adjusted residual is ≤1.96 or ≥1.96.
Figure 4.
Figure 4.
Percent reduction in initial weight in the diabetes support and education group by alcohol consumption trajectory. Values shown are mean (± standard error), and weight losses were estimated using linear mixed‐effects models controlling for baseline age, race/ethnicity, gender, education, smoking status, BMI, insulin use, diabetes duration, depressive symptoms, and physical and mental health-related quality of life.
Figure 5.
Figure 5.
Mean self-reported daily caloric intake at baseline, and years 1 and 4 based on 4-year alcohol trajectory in the (a) intensive lifestyle intervention and (b) diabetes support and education groups. Error bars represent the standard error. Grey bars represent non-alcoholic dietary intake. Black bars represent calories from alcohol. *p<0.05 for difference relative to abstinent group in total dietary intake value at baseline, year 1, or year 4. ^p<0.05 for differences relative to abstinent group in non-alcohol dietary intake. The amount of change in total dietary intake from baseline to year 1 and baseline to year 4 did not differ significantly by alcohol trajectory group (ps>0.05). ILI: Each alcohol trajectory group had significant within-group declines in dietary intake from baseline to year 1 and baseline to year 4 (ps<0.05). DSE: Each group had significant declines dietary intake from baseline to year 1 with the exception of the consistent-moderate group which was not significant for either.
Figure 5.
Figure 5.
Mean self-reported daily caloric intake at baseline, and years 1 and 4 based on 4-year alcohol trajectory in the (a) intensive lifestyle intervention and (b) diabetes support and education groups. Error bars represent the standard error. Grey bars represent non-alcoholic dietary intake. Black bars represent calories from alcohol. *p<0.05 for difference relative to abstinent group in total dietary intake value at baseline, year 1, or year 4. ^p<0.05 for differences relative to abstinent group in non-alcohol dietary intake. The amount of change in total dietary intake from baseline to year 1 and baseline to year 4 did not differ significantly by alcohol trajectory group (ps>0.05). ILI: Each alcohol trajectory group had significant within-group declines in dietary intake from baseline to year 1 and baseline to year 4 (ps<0.05). DSE: Each group had significant declines dietary intake from baseline to year 1 with the exception of the consistent-moderate group which was not significant for either.
Figure 6.
Figure 6.
Mean self-reported kcals of physical activity per week at baseline, and years 1 and 4 based on 4-year alcohol trajectory in the (a) intensive lifestyle intervention and (b) diabetes support and education groups. ILI: Each alcohol trajectory group had significant within-group improvement in physical activity from baseline to year 1. Baseline to year 4 changes in physical activity were significant within-group for all except consistent-heavy drinkers (p=0.54). Changes in baseline to year 4 physical activity did not differ significantly (ps>0.05) between those who abstained from alcohol and all other groups. DSE: Consistent-light drinkers had a significant improvement in physical activity from baseline to year 1 (p=0.001) and baseline to year 4 (p=0.02). Compared to abstainers, the other groups did not differ significantly in change in physical activity (ps>0.05).
Figure 6.
Figure 6.
Mean self-reported kcals of physical activity per week at baseline, and years 1 and 4 based on 4-year alcohol trajectory in the (a) intensive lifestyle intervention and (b) diabetes support and education groups. ILI: Each alcohol trajectory group had significant within-group improvement in physical activity from baseline to year 1. Baseline to year 4 changes in physical activity were significant within-group for all except consistent-heavy drinkers (p=0.54). Changes in baseline to year 4 physical activity did not differ significantly (ps>0.05) between those who abstained from alcohol and all other groups. DSE: Consistent-light drinkers had a significant improvement in physical activity from baseline to year 1 (p=0.001) and baseline to year 4 (p=0.02). Compared to abstainers, the other groups did not differ significantly in change in physical activity (ps>0.05).

Similar articles

Cited by

References

    1. Huth PJ, Fulgoni VL, Keast DR, Park K, Auestad N. Major food sources of calories, added sugars, and saturated fat and their contribution to essential nutrient intakes in the US diet: data from the National Health and Nutrition Examination Survey (2003–2006). Nutr J. 2013;12(1):116. - PMC - PubMed
    1. Center for Behavioral Health Statistics and Quality. Behavioral health trends in the United States: results from the 2014 National Survey on Drug Use and Health. Rockville, MD, USA: 2015. HHS Publication No. SMA 15–4927, NSDUH Series H-50.
    1. Grant BF, Chou SP, Saha TD, et al. Prevalence of 12-month alcohol use, high-risk drinking, and DSM-IV alcohol use disorder in the United States, 2001–2002 to 2012–2013: results from the National Epidemiologic Survey on Alcohol and Related Conditions. JAMA Psychiatry. 2017;74(9):911–923. - PMC - PubMed
    1. Butler L, Poti JM, Popkin BM. Trends in energy intake from alcoholic beverages among US adults by sociodemographic characteristics, 1989–2012. J Acad Nutr Diet. 2016;116(7):1087–1100. - PMC - PubMed
    1. Li X-H, Yu F-f, Zhou Y-H, He J. Association between alcohol consumption and the risk of incident type 2 diabetes: a systematic review and dose-response meta-analysis. The American Journal of Clinical Nutrition. 2016;103(3):818–829. - PubMed

Publication types

Associated data