Meta-Analysis
. 2019 Feb;290(2):317-326.
doi: 10.1148/radiol.2018180226. Epub 2018 Nov 13.

Native T1 and Extracellular Volume Measurements by Cardiac MRI in Healthy Adults: A Meta-Analysis

Affiliations
Meta-Analysis

Native T1 and Extracellular Volume Measurements by Cardiac MRI in Healthy Adults: A Meta-Analysis

Matthew Gottbrecht et al. Radiology. 2019 Feb.

Abstract

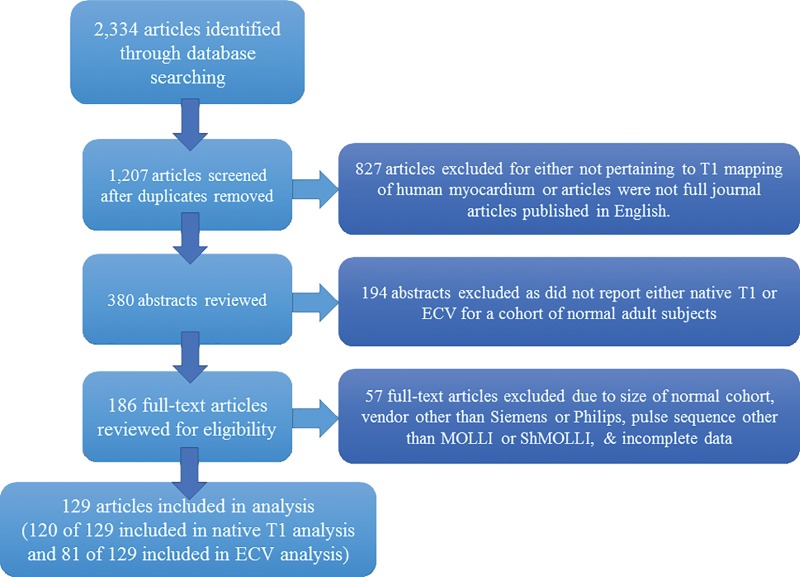
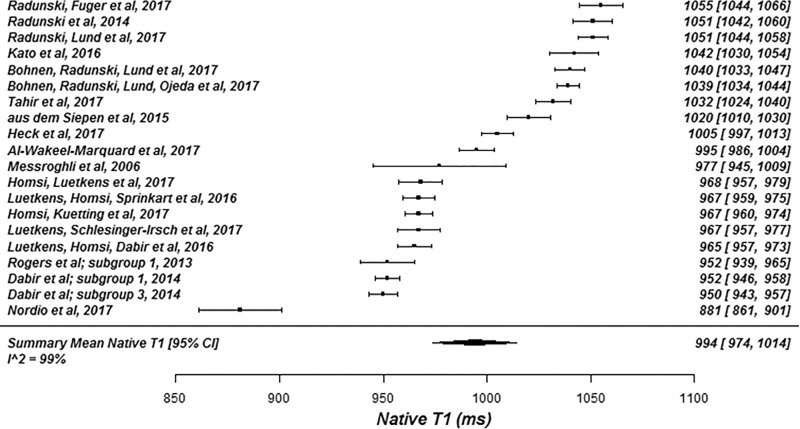
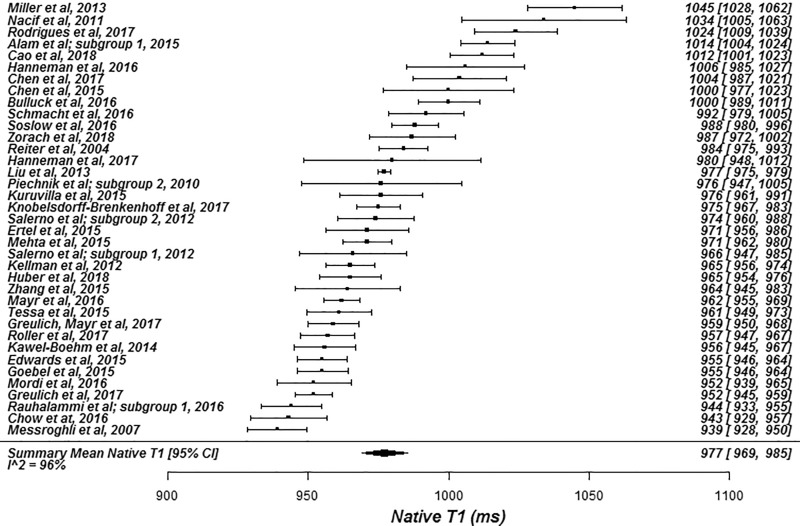
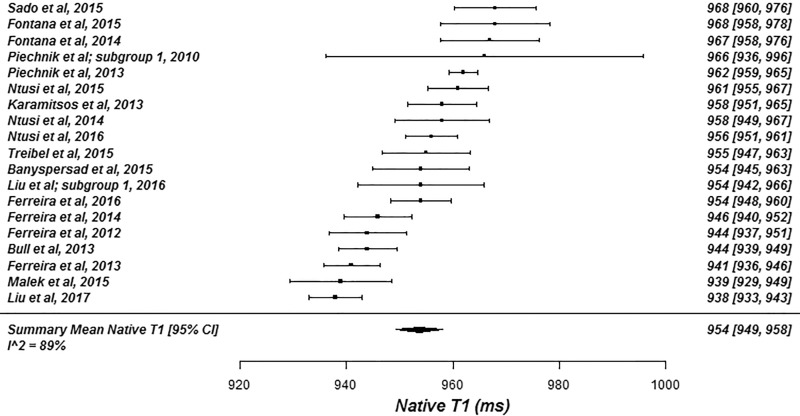
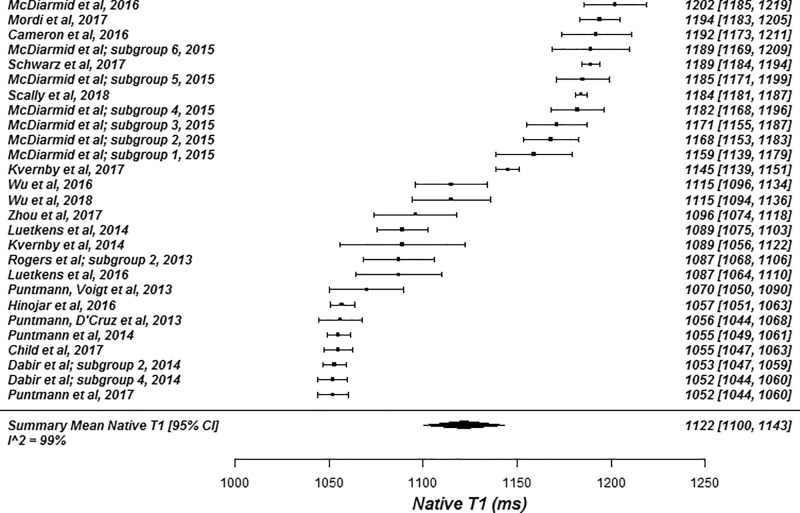
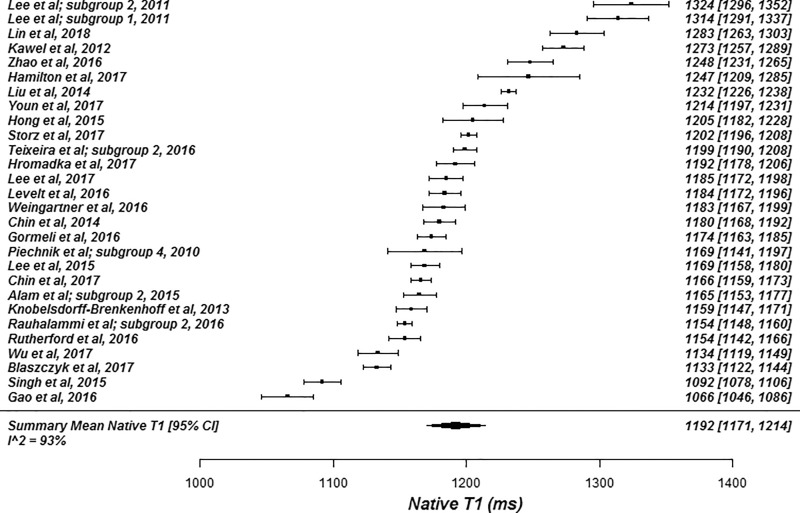
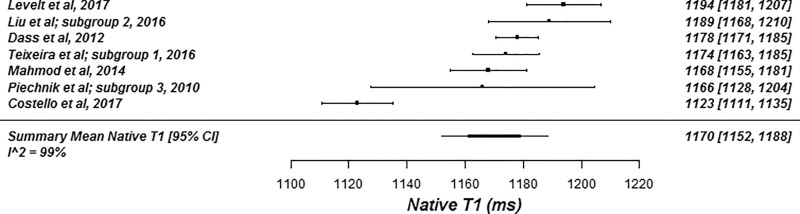
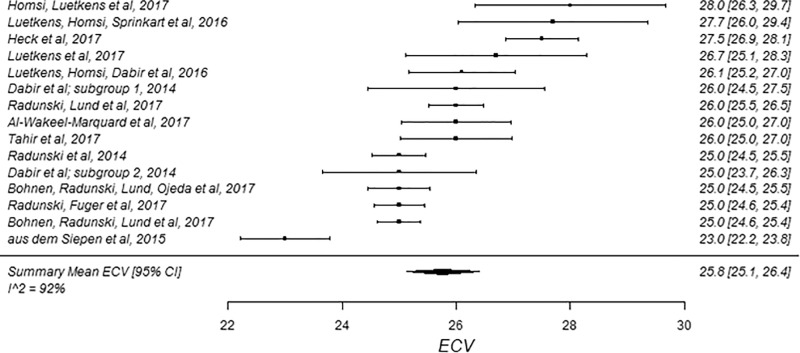
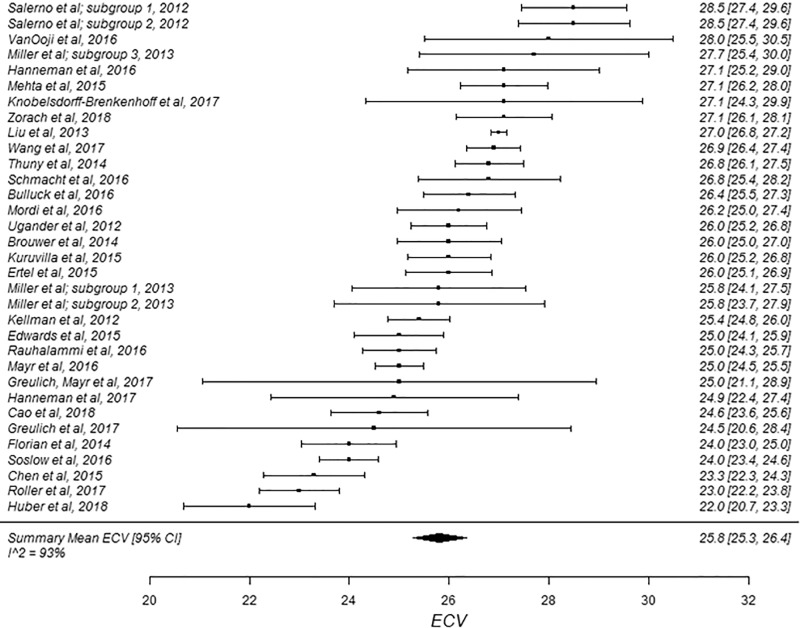
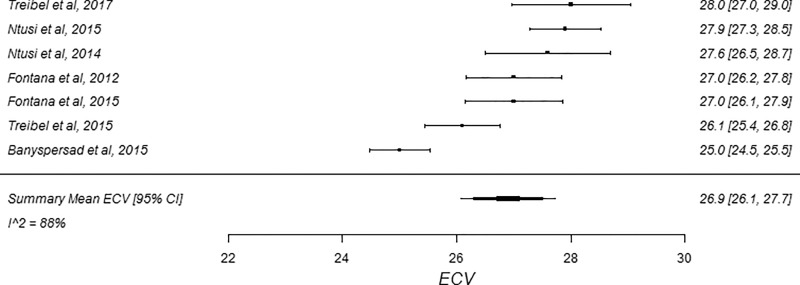
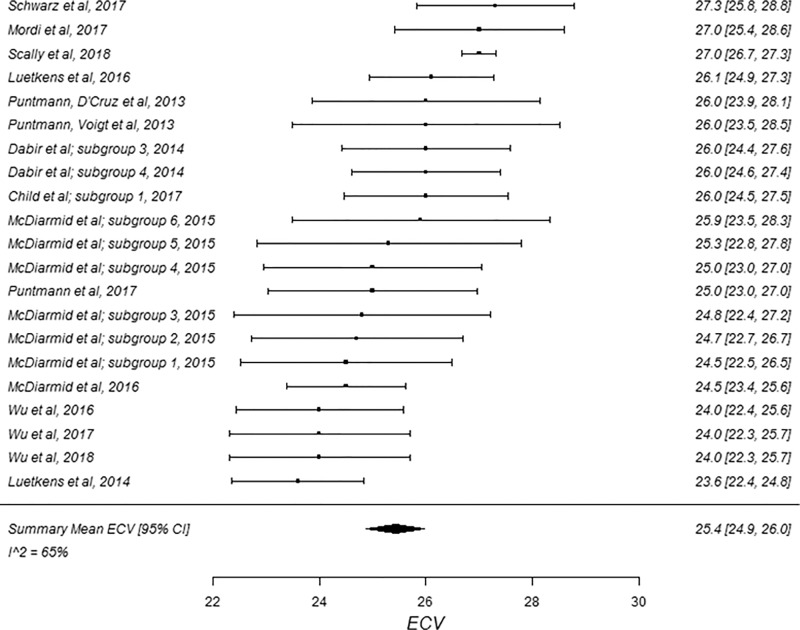
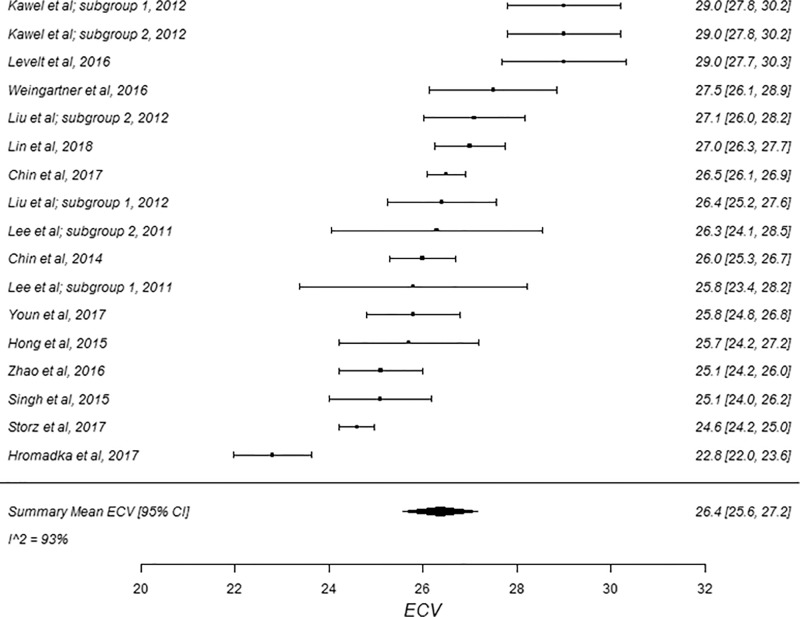
Purpose To summarize the literature by performing a systematic review and pooled analysis of the data, to understand the extent of variability among studies of native T1 and extracellular volume (ECV) measurements, and to identify covariates that account for heterogeneity between studies. Materials and Methods PubMed, Web of Science, and Cochrane Central were searched for native T1 and ECV measurements of the left ventricle in health adult study participants. The search terms used were "T1 mapping heart," "Native T1 heart," and "ECV heart." Summary means were generated with random-effects modeling. Heterogeneity was assessed by using the inconsistency factor (I 2). Subgroup analyses and meta-regression analyses were conducted to identify etiologic causes of heterogeneity. Results This systematic review of native T1 included 120 articles, with 5541 participants (mean age, 50 years; 51.0% men [2826 of 5541]). The pooled mean of native T1 was 976 msec (95% confidence interval [CI]: 969 msec, 983 msec) at 1.5 T and 1159 msec (95% CI: 1143 msec, 1175 msec) at 3.0 T. I 2 was 99% at both field strengths. Eighty-one articles were included in the systematic review of ECV, with 3872 participants (mean age, 52 years; 50.0% men [1936 of 3872]). The pooled mean of ECV was 25.9% at field strength of 1.5 T (95% CI: 25.5%, 26.3%) and 3.0 T (95% CI: 25.4%, 26.5%). I 2 was 94% and 90% at 1.5 and 3.0 T, respectively. Conclusion The pooled means of extracellular volume and native T1 measurements in healthy adult participants are summarized in this analysis. There was significant heterogeneity found among studies, highlighting the importance of standardized cardiac MRI protocols and the derivation of institution specific reference ranges. © RSNA, 2018 Online supplemental material is available for this article. See also the editorial by Dodd and Dewey in this issue.


Figures

Figure 1:
Figure 1:
Preferred Reporting Items for Systematic Reviews and Meta-Analyses (PRISMA) flowchart of the study review process. ECV = extracellular volume, MOLLI = modified Look-Locker inversion recovery, ShMOLLI = shortened modified Look-Locker inversion recovery.
Figure 2a:
Figure 2a:
Forest plots of native T1 studies at 1.5-T cardiac MRI in healthy participants. Studies are grouped by vendor and pulse sequence scheme. (a) Native T1 studies from Philips modified Look-Locker inversion recovery (MOLLI) subgroup, (b) native T1 studies from Siemens MOLLI subgroup, and (c) native T1 studies from Siemens MOLLI subgroup. Studies with multiple subgroups are noted by author last name and year of publication..
Figure 2b:
Figure 2b:
Forest plots of native T1 studies at 1.5-T cardiac MRI in healthy participants. Studies are grouped by vendor and pulse sequence scheme. (a) Native T1 studies from Philips modified Look-Locker inversion recovery (MOLLI) subgroup, (b) native T1 studies from Siemens MOLLI subgroup, and (c) native T1 studies from Siemens MOLLI subgroup. Studies with multiple subgroups are noted by author last name and year of publication..
Figure 2c:
Figure 2c:
Forest plots of native T1 studies at 1.5-T cardiac MRI in healthy participants. Studies are grouped by vendor and pulse sequence scheme. (a) Native T1 studies from Philips modified Look-Locker inversion recovery (MOLLI) subgroup, (b) native T1 studies from Siemens MOLLI subgroup, and (c) native T1 studies from Siemens MOLLI subgroup. Studies with multiple subgroups are noted by author last name and year of publication..
Figure 3a:
Figure 3a:
Forest plots of native T1 studies at 3.0-T cardiac MRI in healthy participants. Studies are grouped by vendor and pulse sequence scheme. (a) Native T1 studies from Philips modified Look-Locker inversion recovery (MOLLI) subgroup, (b) native T1 studies from Siemens MOLLI subgroup, and (c) native T1 studies from Siemens shortened MOLLI subgroup. Studies with multiple subgroups are noted by author last name and year of publication.
Figure 3b:
Figure 3b:
Forest plots of native T1 studies at 3.0-T cardiac MRI in healthy participants. Studies are grouped by vendor and pulse sequence scheme. (a) Native T1 studies from Philips modified Look-Locker inversion recovery (MOLLI) subgroup, (b) native T1 studies from Siemens MOLLI subgroup, and (c) native T1 studies from Siemens shortened MOLLI subgroup. Studies with multiple subgroups are noted by author last name and year of publication.
Figure 3c:
Figure 3c:
Forest plots of native T1 studies at 3.0-T cardiac MRI in healthy participants. Studies are grouped by vendor and pulse sequence scheme. (a) Native T1 studies from Philips modified Look-Locker inversion recovery (MOLLI) subgroup, (b) native T1 studies from Siemens MOLLI subgroup, and (c) native T1 studies from Siemens shortened MOLLI subgroup. Studies with multiple subgroups are noted by author last name and year of publication.
Figure 4a:
Figure 4a:
Forest plots of extracellular volume (ECV) studies at 1.5-T cardiac MRI in healthy participants. Studies are grouped by vendor and pulse sequence scheme. (a) ECV studies from Philips modified Look-Locker inversion recovery (MOLLI) subgroup, (b) ECV studies from Siemens MOLLI subgroup, and (c) ECV studies from Siemens shortened MOLLI subgroup. Studies with multiple subgroups are noted by author last name and year of publication.
Figure 4b:
Figure 4b:
Forest plots of extracellular volume (ECV) studies at 1.5-T cardiac MRI in healthy participants. Studies are grouped by vendor and pulse sequence scheme. (a) ECV studies from Philips modified Look-Locker inversion recovery (MOLLI) subgroup, (b) ECV studies from Siemens MOLLI subgroup, and (c) ECV studies from Siemens shortened MOLLI subgroup. Studies with multiple subgroups are noted by author last name and year of publication.
Figure 4c:
Figure 4c:
Forest plots of extracellular volume (ECV) studies at 1.5-T cardiac MRI in healthy participants. Studies are grouped by vendor and pulse sequence scheme. (a) ECV studies from Philips modified Look-Locker inversion recovery (MOLLI) subgroup, (b) ECV studies from Siemens MOLLI subgroup, and (c) ECV studies from Siemens shortened MOLLI subgroup. Studies with multiple subgroups are noted by author last name and year of publication.
Figure 5a:
Figure 5a:
Forest plots of extracellular volume (ECV) studies at 3.0-T cardiac MRI in healthy participants. Studies are grouped by vendor and pulse sequence scheme. (a) ECV studies from Philips modified Look-Locker inversion recovery (MOLLI) subgroup and (b) ECV studies from Siemens MOLLI subgroup. Studies with multiple subgroups are noted by author last name and year of publication.
Figure 5b:
Figure 5b:
Forest plots of extracellular volume (ECV) studies at 3.0-T cardiac MRI in healthy participants. Studies are grouped by vendor and pulse sequence scheme. (a) ECV studies from Philips modified Look-Locker inversion recovery (MOLLI) subgroup and (b) ECV studies from Siemens MOLLI subgroup. Studies with multiple subgroups are noted by author last name and year of publication.

Comment in

Similar articles

Cited by

References

    1. Messroghli DR, Radjenovic A, Kozerke S, Higgins DM, Sivananthan MU, Ridgway JP. Modified Look-Locker inversion recovery (MOLLI) for high-resolution T1 mapping of the heart. Magn Reson Med 2004;52(1):141–146. - PubMed
    1. Messroghli DR, Greiser A, Fröhlich M, Dietz R, Schulz-Menger J. Optimization and validation of a fully-integrated pulse sequence for modified look-locker inversion-recovery (MOLLI) T1 mapping of the heart. J Magn Reson Imaging 2007;26(4):1081–1086. - PubMed
    1. Ugander M, Oki AJ, Hsu LY, et al. . Extracellular volume imaging by magnetic resonance imaging provides insights into overt and sub-clinical myocardial pathology. Eur Heart J 2012;33(10):1268–1278. - PMC - PubMed
    1. Moon JC, Messroghli DR, Kellman P, et al. . Myocardial T1 mapping and extracellular volume quantification: a Society for Cardiovascular Magnetic Resonance (SCMR) and CMR Working Group of the European Society of Cardiology consensus statement. J Cardiovasc Magn Reson 2013;15(1):92–103. - PMC - PubMed
    1. Salerno M, Kramer CM. Advances in parametric mapping with CMR imaging. JACC Cardiovasc Imaging 2013;6(7):806–822. - PMC - PubMed

Publication types