. 2019 Feb;290(2):537-544.
doi: 10.1148/radiol.2018181422. Epub 2018 Nov 13.

Assessment of Convolutional Neural Networks for Automated Classification of Chest Radiographs

Affiliations

Assessment of Convolutional Neural Networks for Automated Classification of Chest Radiographs

Jared A Dunnmon et al. Radiology. 2019 Feb.

Abstract

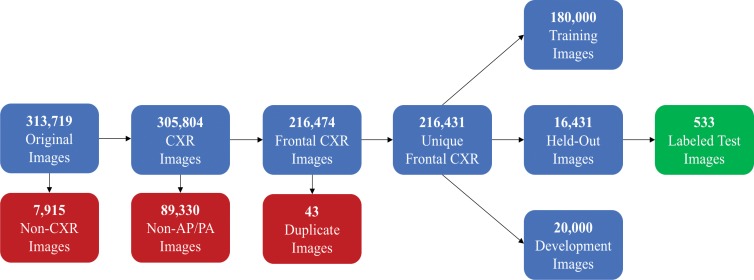
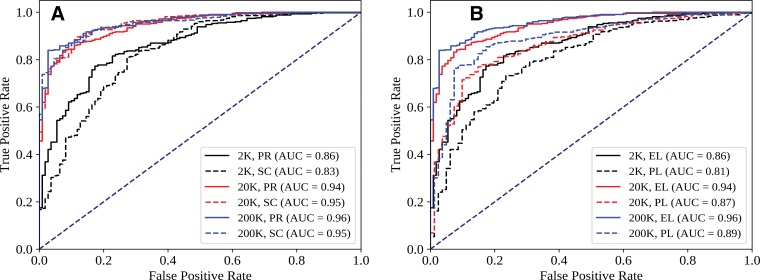
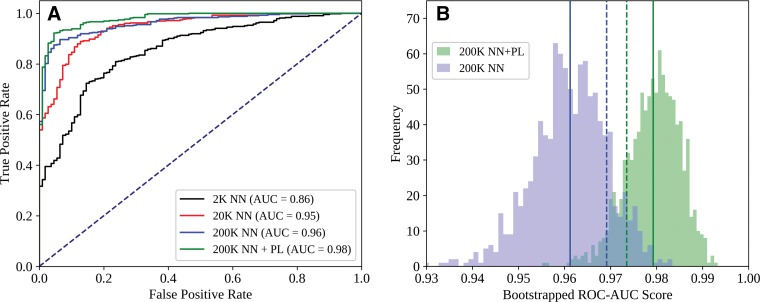
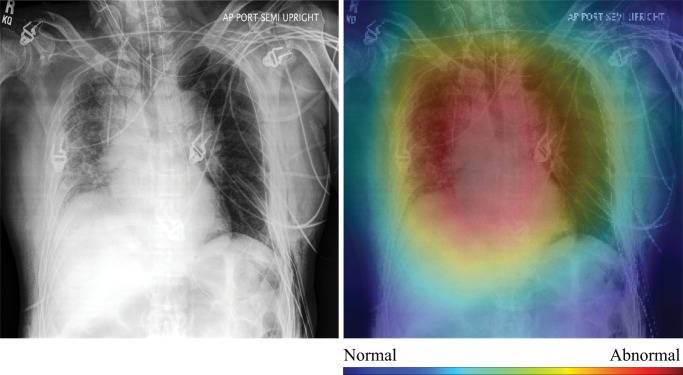
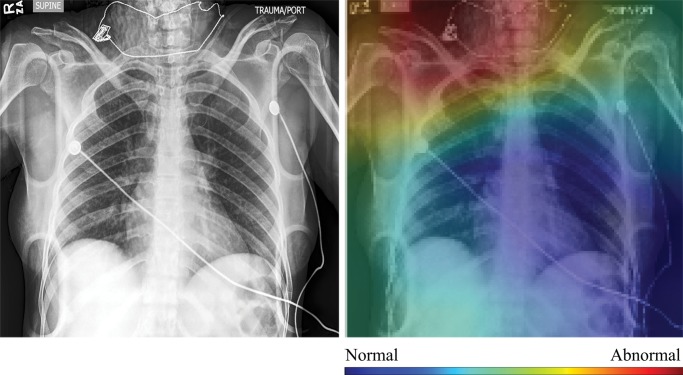
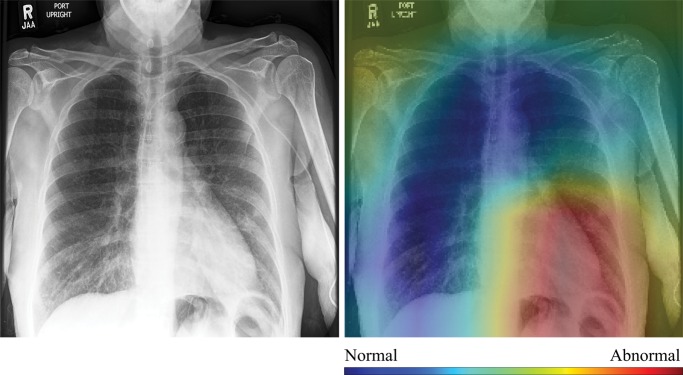
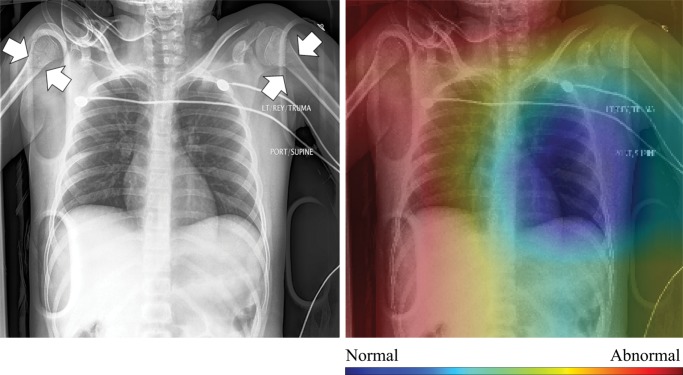
Purpose To assess the ability of convolutional neural networks (CNNs) to enable high-performance automated binary classification of chest radiographs. Materials and Methods In a retrospective study, 216 431 frontal chest radiographs obtained between 1998 and 2012 were procured, along with associated text reports and a prospective label from the attending radiologist. This data set was used to train CNNs to classify chest radiographs as normal or abnormal before evaluation on a held-out set of 533 images hand-labeled by expert radiologists. The effects of development set size, training set size, initialization strategy, and network architecture on end performance were assessed by using standard binary classification metrics; detailed error analysis, including visualization of CNN activations, was also performed. Results Average area under the receiver operating characteristic curve (AUC) was 0.96 for a CNN trained with 200 000 images. This AUC value was greater than that observed when the same model was trained with 2000 images (AUC = 0.84, P < .005) but was not significantly different from that observed when the model was trained with 20 000 images (AUC = 0.95, P > .05). Averaging the CNN output score with the binary prospective label yielded the best-performing classifier, with an AUC of 0.98 (P < .005). Analysis of specific radiographs revealed that the model was heavily influenced by clinically relevant spatial regions but did not reliably generalize beyond thoracic disease. Conclusion CNNs trained with a modestly sized collection of prospectively labeled chest radiographs achieved high diagnostic performance in the classification of chest radiographs as normal or abnormal; this function may be useful for automated prioritization of abnormal chest radiographs. © RSNA, 2018 Online supplemental material is available for this article. See also the editorial by van Ginneken in this issue.


Figures

Figure 1:
Figure 1:
Flowchart of radiographs used in this study. AP = anteroposterior, CXR = chest x-ray, PA = posteroanterior.
Figure 2:
Figure 2:
Effect of, A, initialization (PR = pretrained, SC = random) and, B, evaluation standard (EL = expert label, PL = prospective label recorded by one attending radiologist) on receiver operating characteristic (ROC) curves for different training set sizes. Each ROC curve shows the output of a one representative ResNet-18 model. Data set size (K = 1000 points) refers to total size (training + development, 90-to-10 split). AUC = area under the ROC curve.
Figure 3:
Figure 3:
Comparison of, A, receiver operating characteristic (ROC) curves for DenseNet-121 (NN) and NN+PL (mean of NN score and prospective label [PL] score) classifiers and, B, area under the ROC curve (AUC) histograms obtained from a 1000-sample test set by using the bootstrap method. Each ROC curve represents the output of one representative NN model. In B, solid lines indicate mean values, and dashed lines indicate standard deviation from the mean. Data set size (K = 1000 points) refers to total size (training + development, 90-to-10 split).
Figure 4a:
Figure 4a:
High-resolution histogram-equalized images (left) and normalized class activation maps (CAMs) (224 × 224 resolution) (right) show (a) true-positive (decreased right lung volume; convolutional neural network [CNN] score 0.99), (b) false-positive (necklace; CNN score 0.57), (c) false-negative (borderline cardiomegaly; CNN score 0.48), and (d) true-negative (humerus fracture; CNN score 0.41) findings of thoracic disease. Red indicates areas of relatively high contribution to an abnormal score, while blue areas indicate the opposite. Because color information is normalized within each image, comparison of values across CAMs is not appropriate.
Figure 4b:
Figure 4b:
High-resolution histogram-equalized images (left) and normalized class activation maps (CAMs) (224 × 224 resolution) (right) show (a) true-positive (decreased right lung volume; convolutional neural network [CNN] score 0.99), (b) false-positive (necklace; CNN score 0.57), (c) false-negative (borderline cardiomegaly; CNN score 0.48), and (d) true-negative (humerus fracture; CNN score 0.41) findings of thoracic disease. Red indicates areas of relatively high contribution to an abnormal score, while blue areas indicate the opposite. Because color information is normalized within each image, comparison of values across CAMs is not appropriate.
Figure 4c:
Figure 4c:
High-resolution histogram-equalized images (left) and normalized class activation maps (CAMs) (224 × 224 resolution) (right) show (a) true-positive (decreased right lung volume; convolutional neural network [CNN] score 0.99), (b) false-positive (necklace; CNN score 0.57), (c) false-negative (borderline cardiomegaly; CNN score 0.48), and (d) true-negative (humerus fracture; CNN score 0.41) findings of thoracic disease. Red indicates areas of relatively high contribution to an abnormal score, while blue areas indicate the opposite. Because color information is normalized within each image, comparison of values across CAMs is not appropriate.
Figure 4d:
Figure 4d:
High-resolution histogram-equalized images (left) and normalized class activation maps (CAMs) (224 × 224 resolution) (right) show (a) true-positive (decreased right lung volume; convolutional neural network [CNN] score 0.99), (b) false-positive (necklace; CNN score 0.57), (c) false-negative (borderline cardiomegaly; CNN score 0.48), and (d) true-negative (humerus fracture; CNN score 0.41) findings of thoracic disease. Red indicates areas of relatively high contribution to an abnormal score, while blue areas indicate the opposite. Because color information is normalized within each image, comparison of values across CAMs is not appropriate.

Comment in

References

    1. Rimmer A. Radiologist shortage leaves patient care at risk, warns royal college. BMJ 2017;359:j4683. - PubMed
    1. Bastawrous S, Carney B. Improving patient safety: avoiding unread imaging exams in the national VA enterprise electronic health record. J Digit Imaging 2017;30(3):309–313. - PMC - PubMed
    1. Rosman DA, Nshizirungu JJ, Rudakemwa E, et al. Imaging in the land of 1000 hills: Rwanda radiology country report. J Glob Radiol 2015;1(1):6.
    1. Ali FS, Harrington SG, Kennedy SB, Hussain S. Diagnostic radiology in Liberia: a country report. J Glob Radiol 2015;1(1):6.
    1. LeCun Y, Bengio Y, Hinton G. Deep learning. Nature 2015;521(7553):436–444. - PubMed

Publication types

LinkOut - more resources