Review
. 2019 Jun;33(6):1051-1061.
doi: 10.1111/jdv.15342. Epub 2019 Apr 5.

Non-invasive imaging in dermatology and the unique potential of raster-scan optoacoustic mesoscopy

Affiliations
Review

Non-invasive imaging in dermatology and the unique potential of raster-scan optoacoustic mesoscopy

B Hindelang et al. J Eur Acad Dermatol Venereol. 2019 Jun.

Abstract

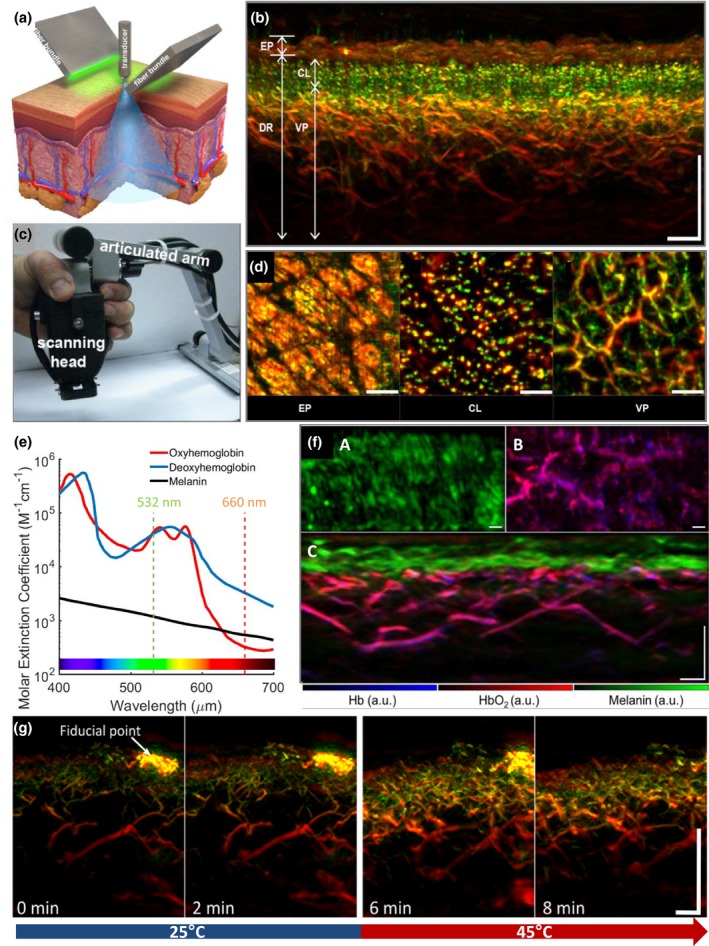
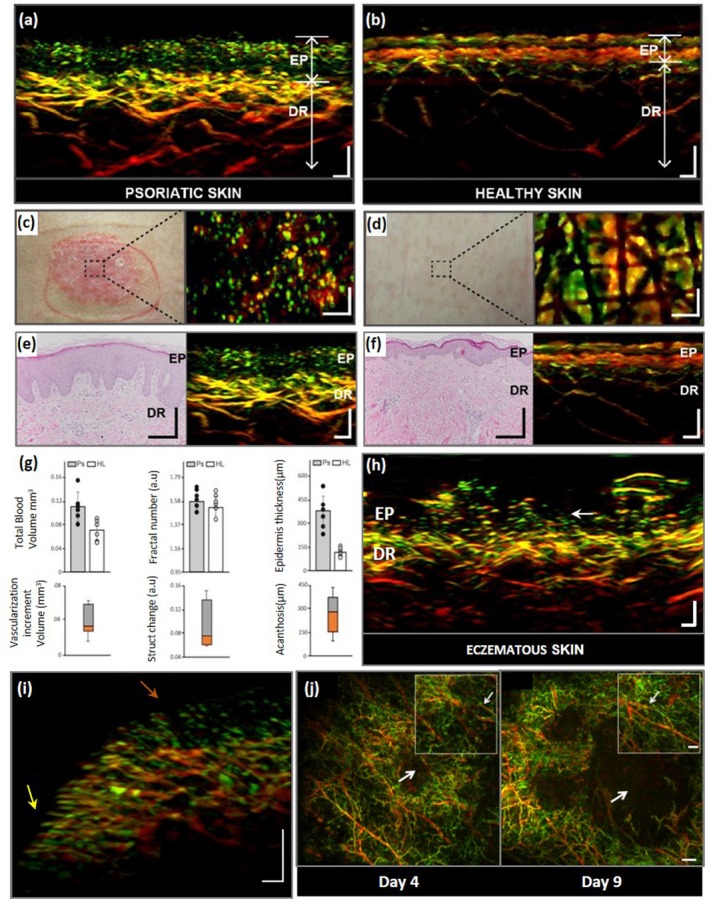
In recent years, several non-invasive imaging methods have been introduced to facilitate diagnostics and therapy monitoring in dermatology. The microscopic imaging methods are restricted in their penetration depth, while the mesoscopic methods probe deeper but provide only morphological, not functional, information. 'Raster-scan optoacoustic mesoscopy' (RSOM), an emerging new imaging technique, combines deep penetration with contrast based on light absorption, which provides morphological, molecular and functional information. Here, we compare the capabilities and limitations of currently available dermatological imaging methods and highlight the principles and unique abilities of RSOM. We illustrate the clinical potential of RSOM, in particular for non-invasive diagnosis and monitoring of inflammatory and oncological skin diseases.


Figures

Figure 1
Figure 1
Raster‐scan optoacoustic mesoscopy (RSOM): illustration of the system and imaging of healthy skin. (a) Schematic illustration of an RSOM system, depicting the configuration of the ultrasound detector (transducer) and the illumination bundles. (b) RSOM images of healthy skin in transverse cross section. Smaller structures (e.g. small vessels) emit ultrasound signals rich in high‐frequency components (depicted in green); larger structures (e.g. larger vessels) emit signals rich in low‐frequency components (depicted in red). Scale bar, 500 μm. (c) Photograph of RSOM scanning head attached to an articulated arm. (d) RSOM images of skin layers in enface sections. CL, capillary loops; DR, dermis; EP, epidermis; VP, vascular plexus. Scale bar, 500 μm. (e) Absorption spectra of melanin, oxy‐ and deoxyhemoglobin as a function of the wavelength of the applied light. At 532 nm, the three chromophores absorb equally strongly and therefore emit equally intense optoacoustic signals. At 660 nm, the weaker absorption by oxy‐ and deoxyhemoglobin allows for largely selective imaging of the skin's melanin distribution. (f) Mapping of the distribution of melanin, oxy‐ and deoxyhemoglobin in human skin generated through unmixing of multispectral RSOM imaging: A, en face cross section through the epidermal layer; B, en face cross section through the dermal layer; and C, transverse cross section through the entire skin. Scale bar, 250 μm. (g) Transverse cross section of forearm skin before local heating (minutes 0 and 2) and after local heating (minutes 6 and 8) from 25 to 44°C. The heating causes reactive vasodilation. Scale bar, 500 μm. Panels a–d modified from Aguirre et al. (2017)33; panel e, modified from https://omlc.org/spectra/hemoglobin/; panel f, modified from Schwarz et al. (2016)61; and panel g, modified from Berezhnoi et al. (2018).63
Figure 2
Figure 2
Imaging of skin diseases using raster‐scan optoacoustic mesoscopy (RSOM). (a–f) RSOM imaging comparing psoriatic plaque and adjacent healthy skin, together with the corresponding histological sections. Structures emitting high‐frequency ultrasound signals (e.g. smaller vessels) are depicted in green; those emitting low‐frequency signals (e.g. larger vessels) are depicted in red. (a) RSOM transverse cross‐sectional image of psoriatic plaque. The elongated capillary loops (green) nearly reach the skin surface and appear interwoven with the depigmented and acanthotic epidermis (red with low contrast, EP). In the underlying dermal layer (DR), the vessels of the dermal plexus appear dilated and organized in a dense manner. Scale bar, 200 μm. (b) RSOM transverse cross section through adjacent healthy skin depicts the melanin‐containing epidermis on top and the capillary loops and dermal vessels below. Scale bar, 200 μm. (c) Photograph (left) and en face RSOM image (right) of psoriatic plaque. The tips of the capillary loops appear as green dots. Scale bar, 300 μm. (d) Photograph (left) and en face RSOM image (right) of neighbouring healthy skin. The top layer of the RSOM image shows melanin‐containing epidermis and physiological markings on the skin surface. Scale bar, 300 μm. (e) Histological cross section (left) and corresponding RSOM transverse cross section (right) of psoriatic skin from the location depicted in panel (c). Histology shows increased dermal vascularization, papillomatosis and elongated capillary loops. (f) Histological cross section (left) and corresponding transverse RSOM cross section (right) of healthy skin from the location depicted in panel (d). (g) Top row: Quantitative comparisons of blood volume, fractal number and epidermis thickness in psoriatic skin (Ps) and healthy skin (HL). Bottom row: Differences between measurements in psoriatic vs. healthy skin. (h) Transverse cross section of skin affected by contact eczema induced by epicutaneous allergy testing (result ‘++ positive’). Capillary loops (white arrow) are longer and more dilated than in healthy skin but appear more irregularly and sparsely distributed than in psoriatic skin [see panels (a) and (b)]. Vessels of the dermal plexus are dilated. Scale bar, 200 μm. (i) Transverse cross section of a skin region in close proximity to the nail fold of the fourth finger of a healthy volunteer (nail located to the left of the region shown). Yellow arrow marks capillaries that lie close to the base of the nail and are oriented parallel to the skin surface. Brown arrow highlights capillaries farther away from the nail, oriented perpendicular to the skin. Therefore, only the capillary tips are visible. Scale bar, 250 μm. (j) En face RSOM images of melanoma growth and tumour angiogenesis in subcutaneous mouse tissue captured on days 4 and 9 after injection of melanoma cells. Insets in each image depict an identical region in the immediate vicinity of the tumour: growth of smaller vasculature is visible over time between two large vessels (smaller arrow). Scale bar, 1 mm (main image), 0.5 mm (inset). Panels a–g modified from Aguirre et al. (2017)33; panel h courtesy of the authors; panel i modified from Aguirre, Hindelang et al. (2018); panel j modified from Omar et al. (2015).36

Similar articles

Cited by

References

    1. Koehler MJ, Speicher M, Lange‐Asschenfeldt S et al Clinical application of multiphoton tomography in combination with confocal laser scanning microscopy for in vivo evaluation of skin diseases. Exp Dermatol 2011; 20: 589–594. - PubMed
    1. Ulrich M. Konfokale laserscanmikroskopie. Der Hautarzt 2015; 66: 504–510. - PubMed
    1. Themstrup L, de Carvalho N, Nielsen SM et al In vivo differentiation of common basal cell carcinoma subtypes by microvascular and structural imaging using dynamic optical coherence tomography. Exp Dermatol 2018; 27: 156–165. - PubMed
    1. Ntziachristos V. Going deeper than microscopy: the optical imaging frontier in biology. Nat Methods 2010; 7: 603–614. - PubMed
    1. Rajadhyaksha M, Marghoob A, Rossi A et al Reflectance confocal microscopy of skin in vivo: from bench to bedside. Lasers Surg Med 2017; 49: 7–19. - PMC - PubMed