. 2019 Feb 1;129(2):598-615.
doi: 10.1172/JCI122836. Epub 2018 Dec 18.

In vivo hematopoietic stem cell gene therapy ameliorates murine thalassemia intermedia

Affiliations

In vivo hematopoietic stem cell gene therapy ameliorates murine thalassemia intermedia

Hongjie Wang et al. J Clin Invest. .

Abstract

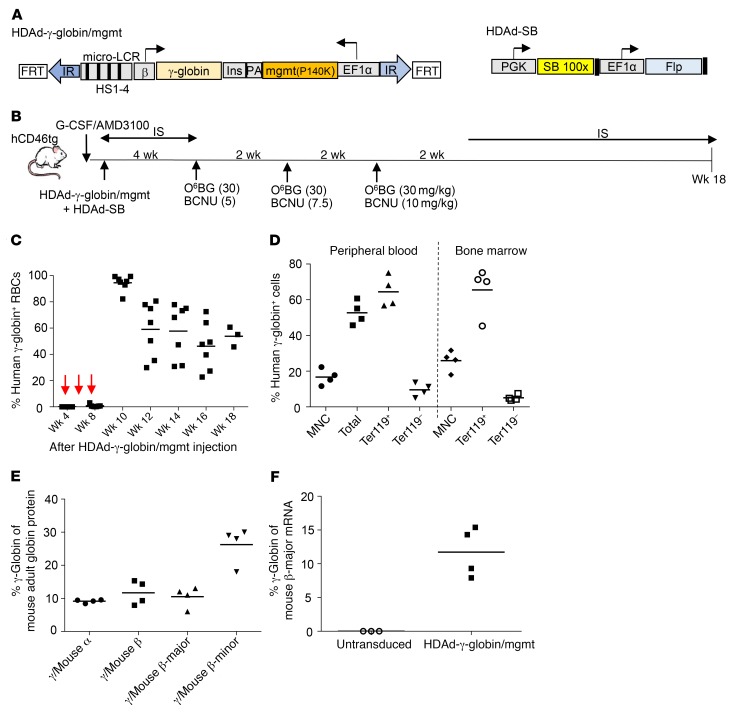
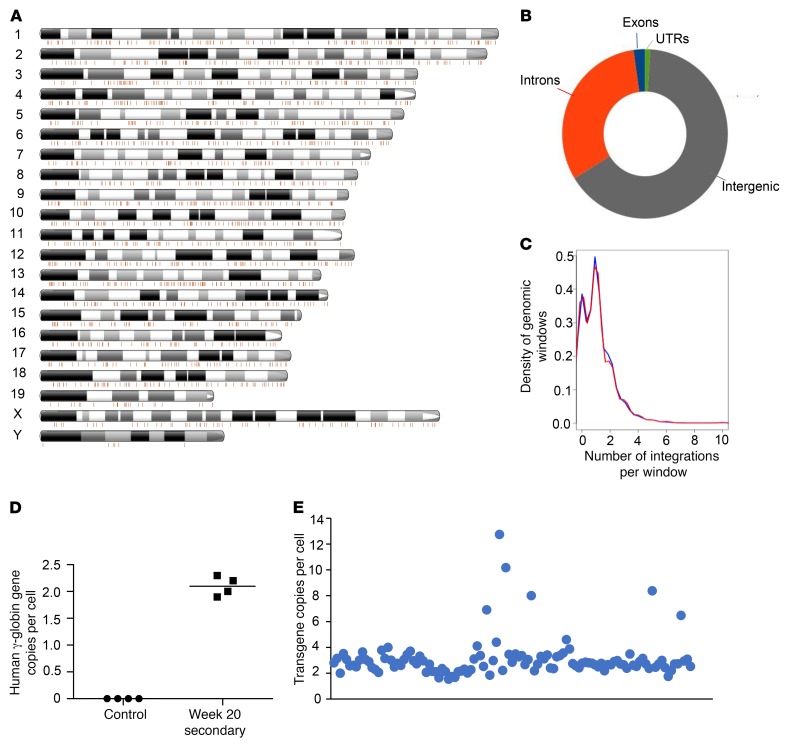
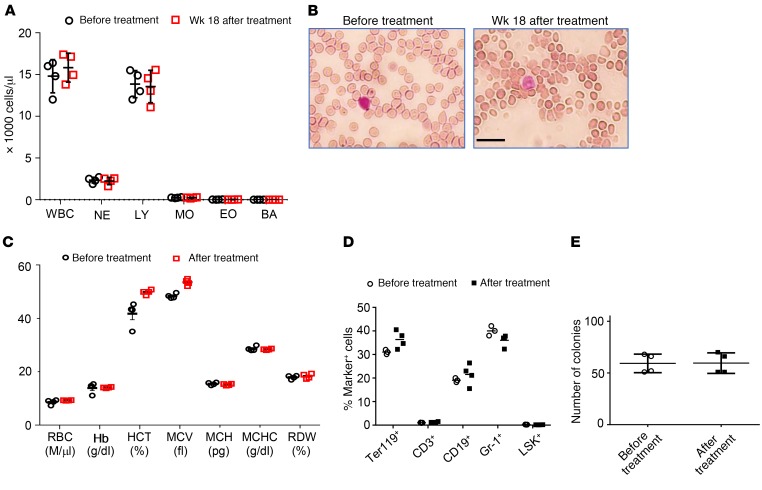
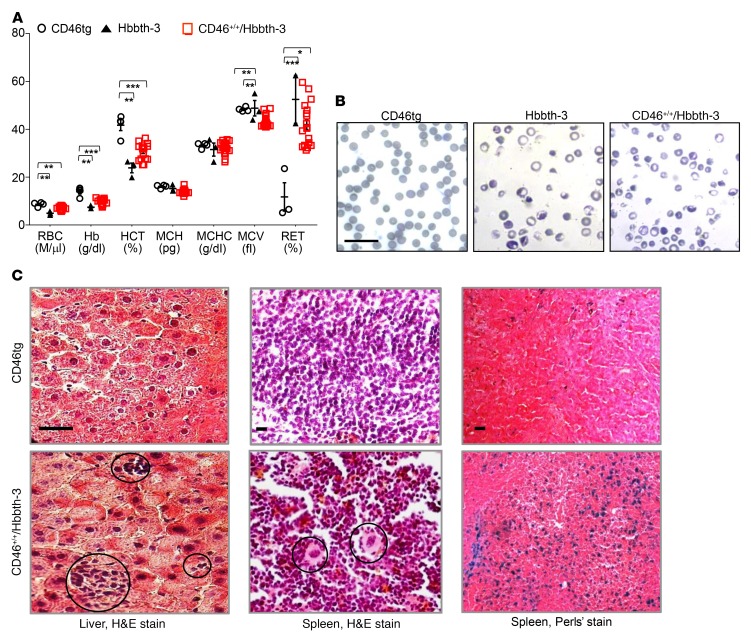
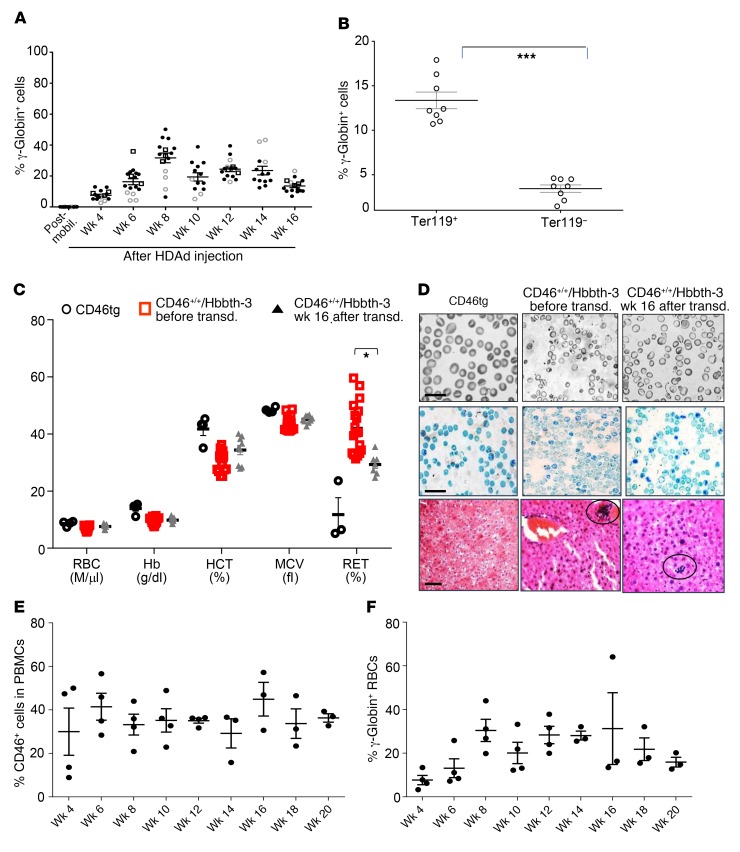
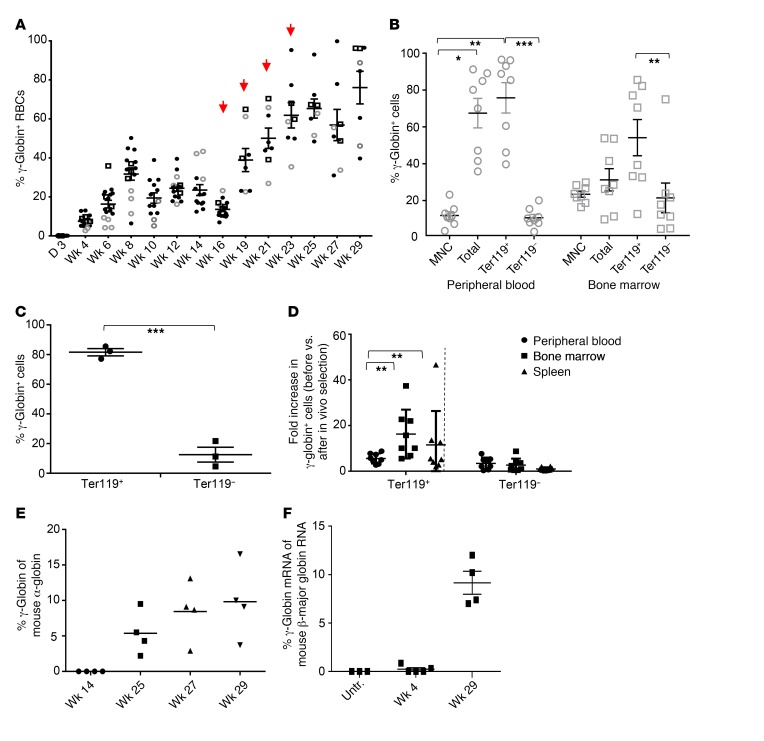
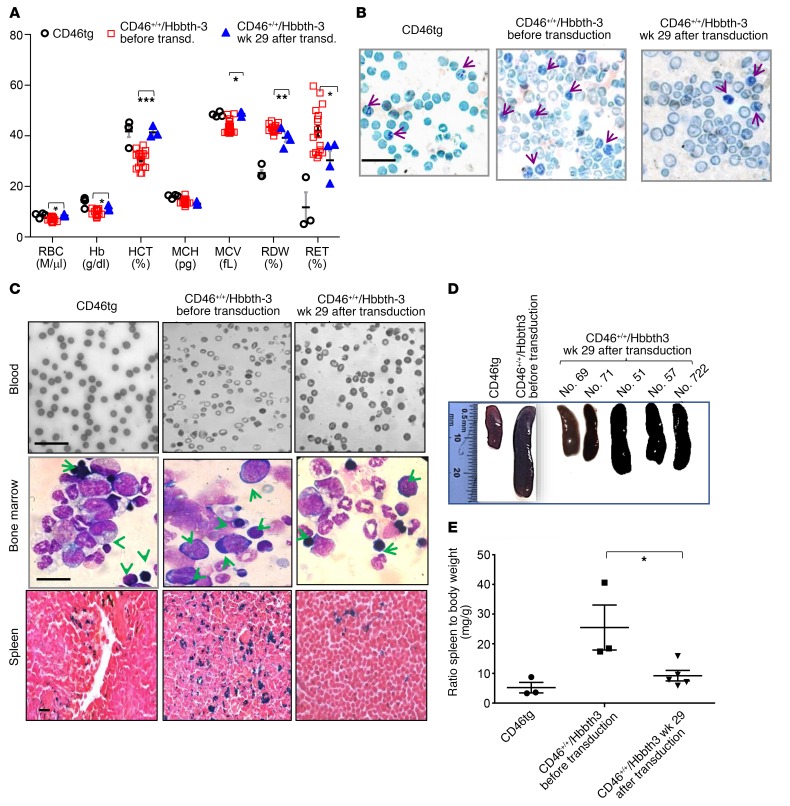
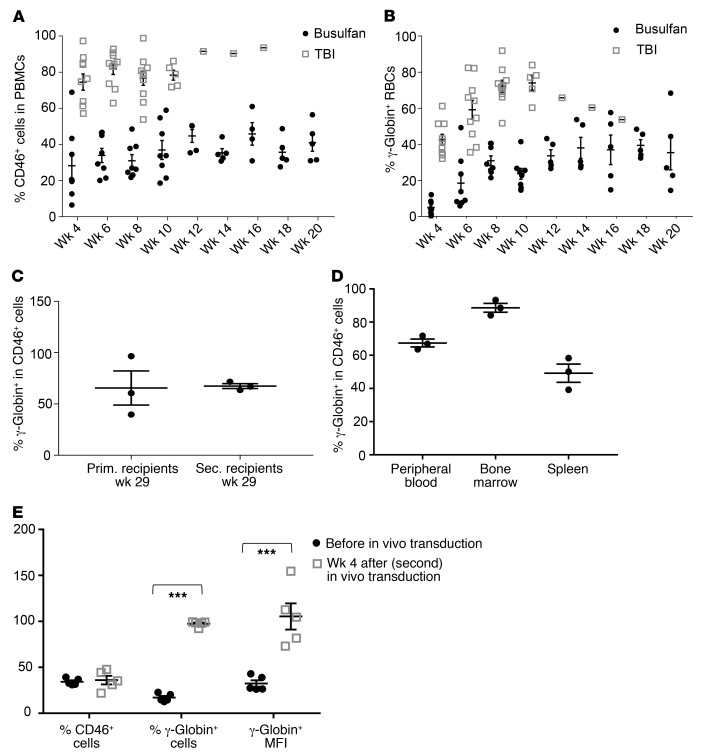
Current thalassemia gene therapy protocols require the collection of hematopoietic stem/progenitor cells (HSPCs), in vitro culture, lentivirus vector transduction, and retransplantation into myeloablated patients. Because of cost and technical complexity, it is unlikely that such protocols will be applicable in developing countries, where the greatest demand for a β-thalassemia therapy lies. We have developed a simple in vivo HSPC gene therapy approach that involves HSPC mobilization and an intravenous injection of integrating HDAd5/35++ vectors. Transduced HSPCs homed back to the bone marrow, where they persisted long-term. HDAd5/35++ vectors for in vivo gene therapy of thalassemia had a unique capsid that targeted primitive HSPCs through human CD46, a relatively safe SB100X transposase-based integration machinery, a micro-LCR-driven γ-globin gene, and an MGMT(P140K) system that allowed for increasing the therapeutic effect by short-term treatment with low-dose O6-benzylguanine plus bis-chloroethylnitrosourea. We showed in "healthy" human CD46-transgenic mice and in a mouse model of thalassemia intermedia that our in vivo approach resulted in stable γ-globin expression in the majority of circulating red blood cells. The high marking frequency was maintained in secondary recipients. In the thalassemia model, a near-complete phenotypic correction was achieved. The treatment was well tolerated. This cost-efficient and "portable" approach could permit a broader clinical application of thalassemia gene therapy.

Keywords: Gene therapy; Hematology; Hematopoietic stem cells; Therapeutics.


Conflict of interest statement

Conflict of interest: The authors have declared that no conflict of interest exists.

Figures

Figure 1
Figure 1. Integrating HDAd5/35++ vector for HSPC gene therapy of hemoglobinopathies.
(A) Vector structure. In HDAd-γ-globin/mgmt, the 11.8-kb transposon is flanked by inverted transposon repeats (IR) and FRT sites for integration through a hyperactive Sleeping Beauty transposase (SB100X) provided from the HDAd-SB vector (right panel). The γ-globin expression cassette contains a 4.3-kb version of the β-globin LCR consisting of 4 DNase hypersensitivity (HS) regions and the 0.7-kb β-globin promoter. The 76-Ile HBG1 gene including the 3′-UTR (for mRNA stabilization in erythrocytes) was used. To avoid interference between the LCR/β-promoter and EF1A promoter, a 1.2-kb chicken HS4 chromatin insulator (Ins) was inserted between the cassettes. The HDAd-SB vector contains the gene for the activity-enhanced SB100X transposase and Flpe recombinase under the control of the ubiquitously active PGK and EF1A promoters, respectively. (B) In vivo transduction of mobilized CD46tg mice. HSPCs were mobilized by s.c. injections of human recombinant G-CSF for 4 days followed by 1 s.c. injection of AMD3100. Thirty and 60 minutes after AMD3100 injection, animals were injected i.v. with a 1:1 mixture of HDAd-γ-globin/mgmt plus HDAd-SB (2 injections, each 4 × 10¹⁰ viral particles). Mice were treated with immunosuppressive (IS) drugs for the next 4 weeks to avoid immune responses against the human γ-globin and MGMT(P140K). O6-BG/BCNU treatment was started at week 4 and repeated every 2 weeks 3 times. With each cycle the BCNU concentration was increased, from 5 to 7.5 to 10 mg/kg. Immunosuppression was resumed 2 weeks after the last O6-BG/BCNU injection. (C) Percentage of human γ-globin+ peripheral RBCs measured by flow cytometry. (D) Percentage of human γ-globin+ cells in peripheral blood mononuclear cells (MNC), total cells, erythroid Ter119+ cells, and nonerythroid Ter119 cells. (E) Percentage of human γ-globin protein compared with adult mouse globin chains (α, β-major, β-minor) measured by HPLC in RBCs at week 18. (F) Percentage of human γ-globin mRNA compared with adult mouse β-major globin mRNA measured by RT-qPCR in total in peripheral blood cells at week 18. Mice that did not receive any treatment were used as a control. In CF, each symbol represents an individual animal.
Figure 2
Figure 2. Analysis of transgene integration in bone marrow cells of week 20 secondary recipients.
(A) Localization of integration sites on mouse chromosomes of bone marrow cells. Shown is a representative mouse. Each line is an integration site. The number of integration sites in this sample is 2,197. (B) Distribution of integrations in genomic regions. Integration site data from 5 mice were pooled and used to generate the graph. (C) The number of integrations overlapping with continuous genomic windows and randomized mouse genomic windows and size was compared. Pooled data were used as in B. The Pearson’s χ2 test P value for similarity is 0.06381, implying that the integration pattern is close to random. (D) Transgene copy numbers. Genomic DNA from total bone marrow cells from untransduced control mice and week 20 secondary recipients was subjected to qPCR with human γ-globin–specific primers. Shown is the copy number per cell for individual animals. Each symbol represents an individual animal. (E) Transgene copy numbers in individual clonal progenitor colonies. Bone marrow Lin cells were plated in methylcellulose, and individual colonies were picked 15 days later. qPCR was performed on genomic DNA. Shown is normalized qPCR signal in individual colonies expressed as transgene copy number per cell (n = 113). Each symbol represents the copy number in an individual colony derived from a single cell.
Figure 3
Figure 3. Hematological parameter after in vivo HSPC transduction/selection in CD46tg mice (week 18 after HDAd injection).
(A) WBC counts. (B) Representative blood smears from an untreated mouse and a mouse at week 18 after HDAd-γ-globin/mgmt plus HDAd-SB injection. Scale bar: 20 μm. Nuclei of WBCs stain purple. (C) Hematological parameters. Hb, hemoglobin; HCT, hematocrit; MCV, mean corpuscular volume; MCH, mean corpuscular hemoglobin; MCHC, mean corpuscular hemoglobin concentration; RDW, red cell distribution width. n ≥ 3, *P < 0.05. Statistical analysis was performed using 2-way ANOVA. (D) Cellular bone marrow composition in naive mice (control) and treated mice sacrificed at week 18. Shown is the percentage of lineage marker–positive cells (Ter119+, CD3+, CD19+, and Gr-1+ cells) and HSPCs (LSK cells). (E) Colony-forming potential of bone marrow Lin cells harvested at week 18 after in vivo transduction. Shown is the number of colonies that formed after plating of 2,500 Lin cells. In A and CE, each symbol represents an individual animal. NE, neutrophils; LY, lymphocytes; MO, monocytes; BA, basophils.
Figure 4
Figure 4. Phenotype of the CD46+/+/Hbbth-3 mouse thalassemia model.
(A) Hematological parameters of CD46+/+/Hbbth-3 mice (n = 7) as compared with CD46tg (n = 3) and Hbbth-3 mice (n = 3). Each symbol represents an individual animal. *P ≤ 0.05, **P ≤ 0.0002, ***P ≤ 0.00003. Statistical analysis was performed using 2-way ANOVA. RET, reticulocytes. (B) Representative peripheral blood smears after staining with May-Grünwald/Giemsa. Scale bar: 20 μm. (C) Extramedullary hemopoiesis by H&E staining in liver and spleen sections of CD46+/+/Hbbth-3 mice (bottom left 2 panels) as compared with spleen and liver sections of CD46tg mice (top left 2 panels). Scale bars: 20 μm. Clusters of erythroblasts in the liver are indicated in the bottom left panel. Circles in the bottom middle panel mark megakaryocytes in the spleen. Iron deposition (granular bluish deposits) by Perls’ staining in the spleen are shown in the top right panel for CD46tg and the bottom right panel for CD46+/+/Hbbth-3 mice. Scale bar: 25 μm.
Figure 5
Figure 5. Analysis of in vivo–transduced CD46+/+/Hbbth-3 mice that did not receive O6BG/BCNU treatment.
(A) Percentage of human γ-globin in peripheral RBCs measured by flow cytometry. The experiment was performed 3 times, indicated by different symbol shapes. (B) γ-Globin expression in erythroid (Ter119+) and nonerythroid (Ter119) blood cells. ***P ≤ 0.00003 by 1-way ANOVA test. (C) RBC analysis of healthy (CD46tg) mice (n = 3), CD46+/+/Hbbth-3 mice prior to mobilization and in vivo transduction (n = 14), and CD46+/+/Hbbth-3 mice that underwent in vivo transduction and were analyzed at week 16 (n = 8). *P ≤ 0.05. Statistical analysis was performed using 2-way ANOVA. (D) Histological phenotype. Top: Blood smears. Middle: Supravital stain of peripheral blood smears with Brilliant cresyl blue for reticulocyte detection. The percentages of positively stained reticulocytes in representative smears were: for CD46tg, 8% ± 0.8%; for CD46+/+/Hbbth-3 before transduction, 39% ± 1.3%; and for CD46+/+/Hbbth-3 week 16 after transduction, 26% ± 0.45%. Bottom: Extramedullary hemopoiesis. Scale bars: 20 μm. (E and F) Analysis of secondary recipients. Total bone marrow from week 16 in vivo–transduced mice was transplanted into C57BL/6 mice that received sublethal busulfan preconditioning. Mice received immunosuppression during the period of observation. (E) Engraftment based on the percentage of human CD46+ (hCD46+) PBMCs. (C57BL/6 recipients do not express hCD46.) (F) Percentage of human γ-globin+ RBCs. Each symbol represents an individual animal.
Figure 6
Figure 6. Analysis of γ-globin expression in in vivo–transduced CD46+/+/Hbbth-3 mice after in vivo selection.
(A) Percentage of human γ-globin in peripheral RBCs measured by flow cytometry. Red arrows indicate the time points of O6-BG/BCNU treatment. Different symbols represent 3 independent experiments. The data up to week 16 are identical to those in Figure 5A. (B) Percentage of γ-globin–expressing cells in hematopoietic tissues at sacrifice (week 29) analyzed by flow cytometry. *P ≤ 0.05, **P ≤ 0.0002, ***P ≤0.00003. (C) γ-Globin expression in MACS-purified Ter119 cells. Bone marrow cells from primary recipients at week 29 were immunomagnetically selected for Ter119+ cells. γ-Globin expression was measured in Ter119+ and Ter119 cells by flow cytometry. ***P ≤ 0.0002. (D) Fold enrichment of γ-globin+ erythroid (Ter119+) and nonerythroid (Ter119) cells in peripheral blood, bone marrow, and spleen before versus after in vivo selection (week 16 vs. week 29). n = 5, **P ≤ 0.0002. (E) Percentage of human γ-globin protein compared with mouse α-globin protein, measured by HPLC in RBCs. Statistical analyses were done with the nonparametric Kruskal-Wallis test. (F) Level of human γ-globin mRNA over adult mouse β-major globin mRNA measured by RT-qPCR in peripheral blood cells. Untreated CD46+/+/Hbbth-3 mice were used as control. Each symbol represents an individual animal.
Figure 7
Figure 7. Phenotypic correction of CD46+/+/Hbbth-3 mice by in vivo HSPC transduction/selection.
(A) RBC analysis of healthy (CD46tg) mice, CD46+/+/Hbbth-3 mice prior to mobilization and in vivo transduction, and CD46+/+/Hbbth-3 mice that underwent in vivo transduction/selection (analyzed at week 29 after HDAd infusion) (n = 5). *P ≤ 0.05, **P ≤ 0.0002, ***P ≤ 0.00003. Statistical analysis was performed using 2-way ANOVA. (B) Supravital stain of peripheral blood smears with Brilliant cresyl blue for reticulocyte detection. Arrows indicate reticulocytes containing characteristic remnant RNA and micro-organelles. The percentages of positively stained reticulocytes in representative smears were: for CD46, 7%; for CD46+/+/Hbbth-3 before treatment, 31%; and for CD46+/+/Hbbth-3 after treatment, 12%. Scale bar: 20 μm. (C) Top: Blood smears. Scale bar: 20 μm. Middle: Bone marrow cytospins. Arrows indicate erythroblasts at different stages of maturation and a backshift in erythropoiesis with pro-erythroblast predominance in treated mice. Scale bar: 25 μm. Bottom: Tissue hemosiderosis by Perls’ stain. Iron deposition is shown as cytoplasmic blue pigments of hemosiderin in spleen tissue sections. The blood smear images for the control mice (CD46tg and CD46+/+/Hbbth-3, before transduction) in C and Figure 5D are from the same sample. (D) Macroscopic spleen images of 1 representative CD46tg and 1 untreated CD46+/+/Hbbth-3 mouse and 5 treated CD46+/+/Hbbth-3 mice. (E) At sacrifice, spleen size was determined as the ratio of spleen weight to total body weight (mg/g). Each symbol represents an individual animal. Data are presented as means ± SEM. *P ≤ 0.05. Statistical analysis was performed using 1-way ANOVA.
Figure 8
Figure 8. Analysis of secondary C57BL/6 recipients with transplanted bone marrow cells from treated CD46+/+/Hbbth-3 mice.
(A) Engraftment rates measured in the periphery based on the percentage of human CD46+ (hCD46+) cells in PBMCs after busulfan conditioning or total-body irradiation (TBI). (C57BL/6 recipients do not express hCD46.) (B) Percentage of human γ-globin–expressing peripheral blood RBCs. All mice received immunosuppression starting from week 4 after transplantation. (C) Percentage of γ-globin+ cells in hCD46+ (donor-derived) cells. (C and D) γ-Globin/CD46 expression in secondary C57BL/6 recipients at week 20 after transplant (busulfan preconditioning). CD46+ cells were immunomagnetically separated from the chimeric bone marrow of 3 representative secondary mice and analyzed for γ-globin expression by flow cytometry. Notably, unlike humans, huCD46tg mice express CD46 on RBCs. (C) γ-Globin/CD46 marking rates of primary and secondary recipients at sacrifice. (D) γ-Globin expression in CD46+-selected cells from the hematopoietic tissues of secondary recipients (week 20). Each symbol represents an individual animal. (E) γ-Globin expression in secondary recipients that received a new (second) round of HSPC mobilization/in vivo transduction (n = 5). Secondary recipients (busulfan-preconditioned) were analyzed for γ-globin and CD46 expression at week 20 after transplantation (“Before in vivo transduction”). These mice were then mobilized and transduced in vivo with the HDAd-γ-globin plus HDAd-SB vectors. Four weeks after in vivo transduction, mice were sacrificed and analyzed (“Week 4 after in vivo transduction”). ***P ≤ 0.00003. Statistical analyses were performed using 1-way ANOVA.
Figure 9
Figure 9. Safety of in vivo transduction/selection in the CD46+/+/Hbbth-3 mouse model.
(A) WBC and platelet (PLT) counts during and after in vivo selection. O6BG/BCNU treatment is indicated by red asterisks. n ≥ 3. (B) Absolute numbers of circulating WBC subpopulations. n ≥ 3. (C) Cellular bone marrow composition in control and treated mice sacrificed at week 29. Shown is the percentage of lineage marker–positive cells (Ter119+, CD3+, CD19+, and Gr-1+ cells) and HSPCs (LSK cells). (D) Colony-forming potential of bone marrow cells harvested at week 29. Each symbol represents an individual animal. *P ≤ 0.05, **P ≤ 0.0002, ***P ≤ 0.00003. Statistical analyses were performed using 2-way ANOVA. NEU: neutrophils; LY: lymphocytes; MO: monocytes.

References

    1. Weatherall DJ. Thalassemia as a global health problem: recent progress toward its control in the developing countries. Ann N Y Acad Sci. 2010;1202:17–23. doi: 10.1111/j.1749-6632.2010.05546.x. - DOI - PubMed
    1. Psatha N, Papayanni PG, Yannaki E. A new era for hemoglobinopathies: more than one curative option. Curr Gene Ther. 2017;17(5):364–378. - PubMed
    1. Cavazzana-Calvo M, et al. Transfusion independence and HMGA2 activation after gene therapy of human β-thalassaemia. Nature. 2010;467(7313):318–322. doi: 10.1038/nature09328. - DOI - PMC - PubMed
    1. Ferrari G, Cacazzana M, Mavilio F. Gene therapy approaches to hemoglobinopathies. In: Bauer DE, Kohn DB, eds. Hematology/Oncology Clinics of North America: Gene Therapy. Vol. 31. Issue 5. Philadelphia, Pennsylvania, USA: Elsevier; 2017:835–852. - DOI - PubMed
    1. Thompson AA, et al. Gene therapy in patients with transfusion-dependent β-thalassemia. N Engl J Med. 2018;378(16):1479–1493. doi: 10.1056/NEJMoa1705342. - DOI - PubMed

Publication types

MeSH terms