

Moth olfactory receptor neurons adjust their encoding efficiency to temporal statistics of pheromone fluctuations
- PMID: 30422975
- PMCID: PMC6258558
- DOI: 10.1371/journal.pcbi.1006586
Moth olfactory receptor neurons adjust their encoding efficiency to temporal statistics of pheromone fluctuations
Abstract
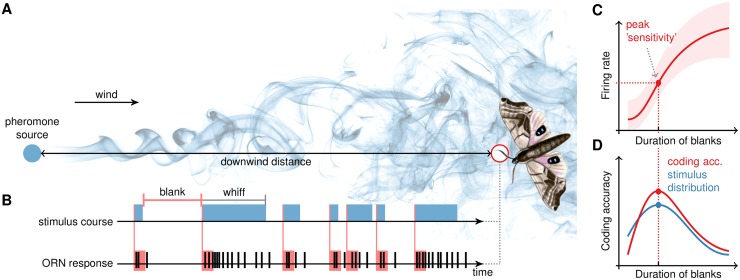
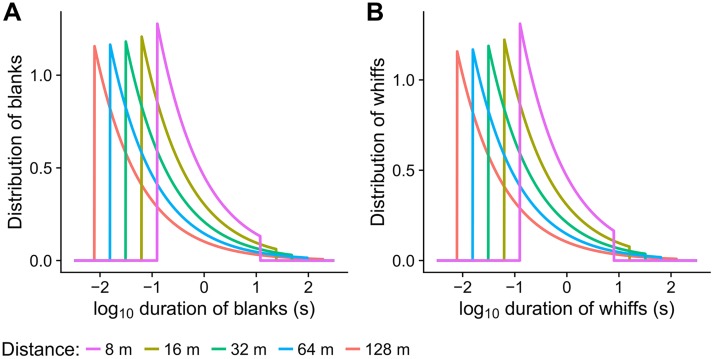
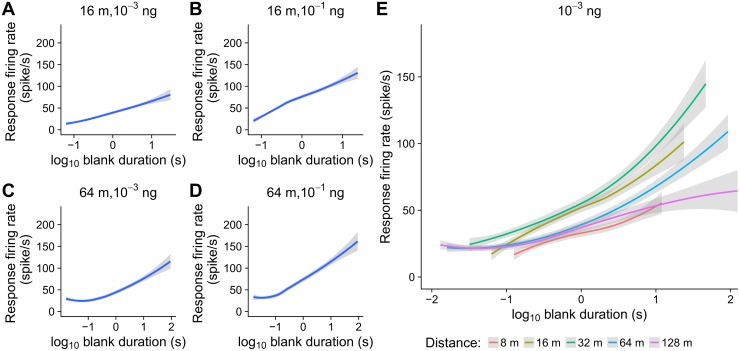
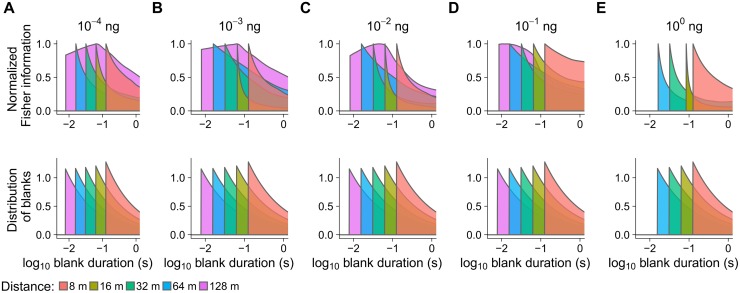
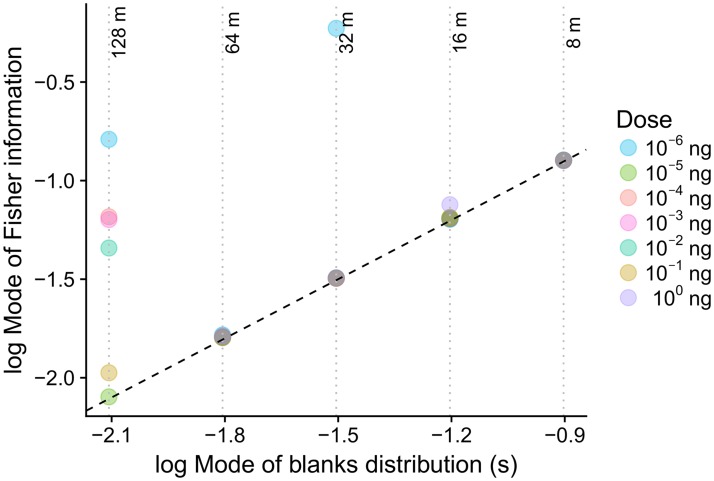
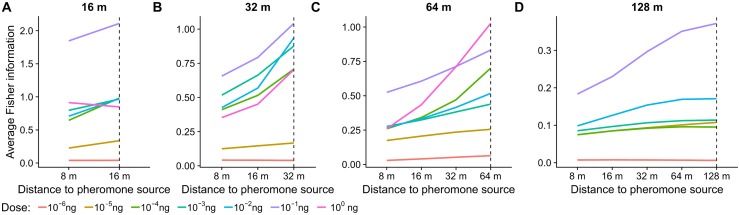
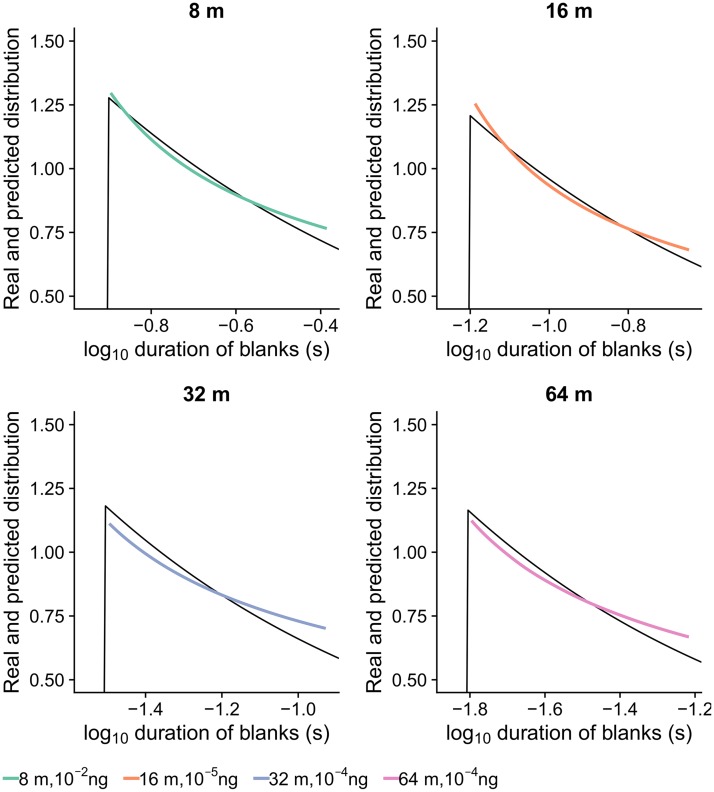
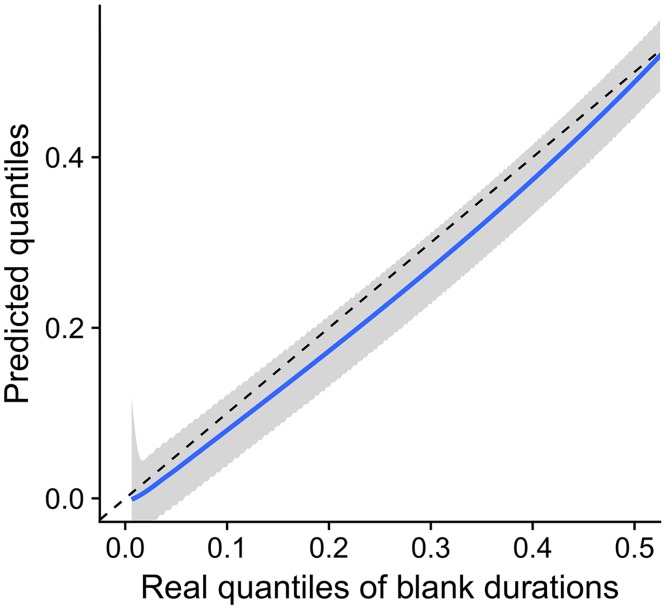
The efficient coding hypothesis predicts that sensory neurons adjust their coding resources to optimally represent the stimulus statistics of their environment. To test this prediction in the moth olfactory system, we have developed a stimulation protocol that mimics the natural temporal structure within a turbulent pheromone plume. We report that responses of antennal olfactory receptor neurons to pheromone encounters follow the temporal fluctuations in such a way that the most frequent stimulus timescales are encoded with maximum accuracy. We also observe that the average coding precision of the neurons adjusted to the stimulus-timescale statistics at a given distance from the pheromone source is higher than if the same encoding model is applied at a shorter, non-matching, distance. Finally, the coding accuracy profile and the stimulus-timescale distribution are related in the manner predicted by the information theory for the many-to-one convergence scenario of the moth peripheral sensory system.
Conflict of interest statement
The authors have declared that no competing interests exist.
Figures
Similar articles
-
Olfactory coding in the turbulent realm.PLoS Comput Biol. 2017 Dec 1;13(12):e1005870. doi: 10.1371/journal.pcbi.1005870. eCollection 2017 Dec. PLoS Comput Biol. 2017. PMID: 29194457 Free PMC article.
-
Efficient olfactory coding in the pheromone receptor neuron of a moth.PLoS Comput Biol. 2008 Apr 25;4(4):e1000053. doi: 10.1371/journal.pcbi.1000053. PLoS Comput Biol. 2008. PMID: 18437217 Free PMC article.
-
Stimulus duration encoding occurs early in the moth olfactory pathway.Commun Biol. 2024 Oct 3;7(1):1252. doi: 10.1038/s42003-024-06921-z. Commun Biol. 2024. PMID: 39363042 Free PMC article.
-
Working range of stimulus flux transduction determines dendrite size and relative number of pheromone component receptor neurons in moths.Chem Senses. 2012 May;37(4):299-313. doi: 10.1093/chemse/bjr122. Epub 2012 Jan 9. Chem Senses. 2012. PMID: 22230170 Review.
-
Winging it: moth flight behavior and responses of olfactory neurons are shaped by pheromone plume dynamics.Chem Senses. 2006 Feb;31(2):155-66. doi: 10.1093/chemse/bjj011. Epub 2005 Dec 8. Chem Senses. 2006. PMID: 16339269 Review.
Cited by
-
Effects of Multi-Component Backgrounds of Volatile Plant Compounds on Moth Pheromone Perception.Insects. 2021 May 1;12(5):409. doi: 10.3390/insects12050409. Insects. 2021. PMID: 34062868 Free PMC article.
-
Adaptive integrate-and-fire model reproduces the dynamics of olfactory receptor neuron responses in a moth.J R Soc Interface. 2019 Aug 30;16(157):20190246. doi: 10.1098/rsif.2019.0246. Epub 2019 Aug 7. J R Soc Interface. 2019. PMID: 31387478 Free PMC article.
-
Sensing complementary temporal features of odor signals enhances navigation of diverse turbulent plumes.Elife. 2022 Jan 24;11:e72415. doi: 10.7554/eLife.72415. Elife. 2022. PMID: 35072625 Free PMC article.
-
Adaptive temporal processing of odor stimuli.Cell Tissue Res. 2021 Jan;383(1):125-141. doi: 10.1007/s00441-020-03400-9. Epub 2021 Jan 6. Cell Tissue Res. 2021. PMID: 33404843 Free PMC article. Review.
-
A Neural Model for Insect Steering Applied to Olfaction and Path Integration.Neural Comput. 2022 Oct 7;34(11):2205-2231. doi: 10.1162/neco_a_01540. Neural Comput. 2022. PMID: 36112910 Free PMC article.
References
-
- Jones CD. Structure of instantaneous plumes in the atmosphere. J Hazard Mat. 1983;7(2):87–112. 10.1016/0304-3894(83)80001-6 - DOI
-
- Murlis J. Odor plumes and the signal they provide In: Carde RT, Minks A, editors. Insect Pheromone Research: New Directions. New York: Chapman and Hall; 1996. p. 221–231.
-
- Celani A, Villermaux E, Vergassola M. Odor Landscapes in Turbulent Environments. Phys Rev X. 2014;4:041015.
-
- Mylne KR, Mason PJ. Concentration fluctuation measurements in a dispersing plume at a range of up to 1000m. Q J Roy Meteo Soc. 1991;117(497):177–206. 10.1002/qj.49711749709 - DOI
-
- Murlis J, Willis MA, Cardé RT. Spatial and temporal structures of pheromone plumes in fields and forests. Physiol Entomol. 2000;25(3):211–222. 10.1046/j.1365-3032.2000.00176.x - DOI
Publication types
MeSH terms
Substances
LinkOut - more resources
Full Text Sources
