Machine learning to identify pairwise interactions between specific IgE antibodies and their association with asthma: A cross-sectional analysis within a population-based birth cohort
- PMID: 30422985
- PMCID: PMC6233916
- DOI: 10.1371/journal.pmed.1002691
Machine learning to identify pairwise interactions between specific IgE antibodies and their association with asthma: A cross-sectional analysis within a population-based birth cohort
Abstract
Background: The relationship between allergic sensitisation and asthma is complex; the data about the strength of this association are conflicting. We propose that the discrepancies arise in part because allergic sensitisation may not be a single entity (as considered conventionally) but a collection of several different classes of sensitisation. We hypothesise that pairings between immunoglobulin E (IgE) antibodies to individual allergenic molecules (components), rather than IgE responses to 'informative' molecules, are associated with increased risk of asthma.
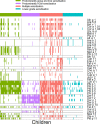
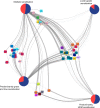
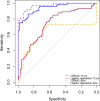
Methods and findings: In a cross-sectional analysis among 461 children aged 11 years participating in a population-based birth cohort, we measured serum-specific IgE responses to 112 allergen components using a multiplex array (ImmunoCAP Immuno‑Solid phase Allergy Chip [ISAC]). We characterised sensitivity to 44 active components (specific immunoglobulin E [sIgE] > 0.30 units in at least 5% of children) among the 213 (46.2%) participants sensitised to at least one of these 44 components. We adopted several machine learning methodologies that offer a powerful framework to investigate the highly complex sIgE-asthma relationship. Firstly, we applied network analysis and hierarchical clustering (HC) to explore the connectivity structure of component-specific IgEs and identify clusters of component-specific sensitisation ('component clusters'). Of the 44 components included in the model, 33 grouped in seven clusters (C.sIgE-1-7), and the remaining 11 formed singleton clusters. Cluster membership mapped closely to the structural homology of proteins and/or their biological source. Components in the pathogenesis-related (PR)-10 proteins cluster (C.sIgE-5) were central to the network and mediated connections between components from grass (C.sIgE-4), trees (C.sIgE-6), and profilin clusters (C.sIgE-7) with those in mite (C.sIgE-1), lipocalins (C.sIgE-3), and peanut clusters (C.sIgE-2). We then used HC to identify four common 'sensitisation clusters' among study participants: (1) multiple sensitisation (sIgE to multiple components across all seven component clusters and singleton components), (2) predominantly dust mite sensitisation (IgE responses mainly to components from C.sIgE-1), (3) predominantly grass and tree sensitisation (sIgE to multiple components across C.sIgE-4-7), and (4) lower-grade sensitisation. We used a bipartite network to explore the relationship between component clusters, sensitisation clusters, and asthma, and the joint density-based nonparametric differential interaction network analysis and classification (JDINAC) to test whether pairwise interactions of component-specific IgEs are associated with asthma. JDINAC with pairwise interactions provided a good balance between sensitivity (0.84) and specificity (0.87), and outperformed penalised logistic regression with individual sIgE components in predicting asthma, with an area under the curve (AUC) of 0.94, compared with 0.73. We then inferred the differential network of pairwise component-specific IgE interactions, which demonstrated that 18 pairs of components predicted asthma. These findings were confirmed in an independent sample of children aged 8 years who participated in the same birth cohort but did not have component-resolved diagnostics (CRD) data at age 11 years. The main limitation of our study was the exclusion of potentially important allergens caused by both the ISAC chip resolution as well as the filtering step. Clustering and the network analyses might have provided different solutions if additional components had been available.
Conclusions: Interactions between pairs of sIgE components are associated with increased risk of asthma and may provide the basis for designing diagnostic tools for asthma.
Conflict of interest statement
I have read the journal’s policy and the authors of this manuscript have the following competing interests: CM reports reports honoraria for speaking at Novartis, Astra Zeneca, Thermo Fisher, GSK; being a member of an advisory board for Novartis and GSK; and grants from NIHR, North West Lung Centre Charity, Moulton Charitable Foundation. AS reports research grant funding from Medical Research Council, NIH, National Institute of Health Research, JP Moulton Charitable Foundation and lecture fees from Thermo Fisher Scientific. The other authors have no competing interests to declare.
Figures


Comment in
-
The use of machine learning to understand the relationship between IgE to specific allergens and asthma.PLoS Med. 2018 Nov 20;15(11):e1002696. doi: 10.1371/journal.pmed.1002696. eCollection 2018 Nov. PLoS Med. 2018. PMID: 30457990 Free PMC article.

