

Height as a Clinical Biomarker of Disease Burden in Adult Mitochondrial Disease
- PMID: 30423112
- PMCID: PMC6469958
- DOI: 10.1210/jc.2018-00957
Height as a Clinical Biomarker of Disease Burden in Adult Mitochondrial Disease
Abstract
Context: Abnormal growth and short stature are observed in patients with mitochondrial disease, but it is unclear whether there is a relationship between final adult height and disease severity.
Objective: To determine whether patients with genetically confirmed mitochondrial disease are shorter than their peers and whether stature is related to disease severity.
Design: Analysis of final adult height in relation to disease severity as determined by the Newcastle Mitochondrial Disease Adult Scale (NMDAS).
Setting: UK Mitochondrial Disease Patient Cohort (Mito Cohort).
Patients: 575 patients were identified with recorded height, weight, and molecular genetic diagnosis of mitochondrial disease within the Mito Cohort.
Main outcome measures: Adult height, body mass index (BMI), and their association with genetic subgroup and disease severity.
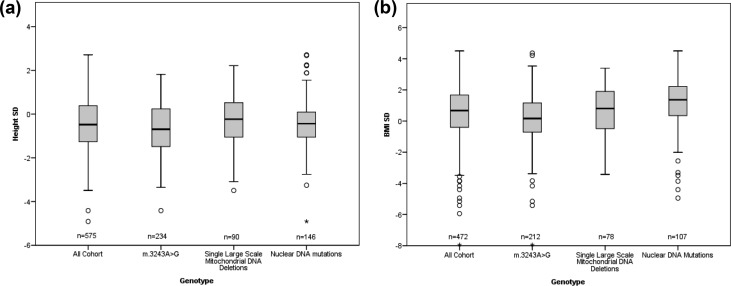
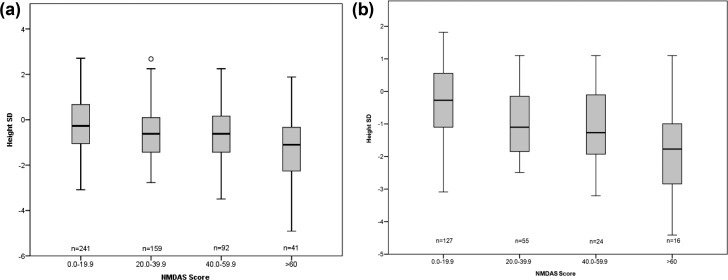
Results: Adults with mitochondrial disease were short, with a mean height of -0.49 SD (95% CI, -0.58 to -0.39; n = 575) compared with UK reference data. Patients were overweight, with a BMI SD of 0.52 (95% CI, 0.37 to 0.67; n = 472). The most common genetic subgroup (m.3243A>G mutation) had a height SD of -0.70 (95% CI, -0.85 to -0.54; n = 234) and a BMI SD of 0.12 (95% CI, -0.10 to 0.34; n = 212). NMDAS scores were negatively correlated with height SD (r = -0.25; 95% CI, -0.33 to -0.17; P < 0.001, n = 533). Rate of disease progression also correlated negatively with adult height (P < 0.001).
Conclusion: Final height in mitochondrial disease reflects disease severity and rate of disease progression. Mitochondrial dysfunction and associated subclinical comorbidities affect growth plate physiology.
Copyright © 2019 Endocrine Society.
Figures
References
-
- Gorman GS, Chinnery PF, DiMauro S, Hirano M, Koga Y, McFarland R, Suomalainen A, Thorburn DR, Zeviani M, Turnbull DM. Mitochondrial diseases. Nat Rev Dis Primers. 2016;2:16080. - PubMed
-
- Schaefer AM, Phoenix C, Elson JL, McFarland R, Chinnery PF, Turnbull DM. Mitochondrial disease in adults: a scale to monitor progression and treatment. Neurology. 2006;66(12):1932–1934. - PubMed
-
- Mackie EJ, Tatarczuch L, Mirams M. The skeleton: a multi-functional complex organ: the growth plate chondrocyte and endochondral ossification. J Endocrinol. 2011;211(2):109–121. - PubMed
Publication types
MeSH terms
Grants and funding
LinkOut - more resources
Full Text Sources
Medical
