. 2018 Nov 12;34(5):724-740.e4.
doi: 10.1016/j.ccell.2018.10.005.

Inhibition of Amino Acid Metabolism Selectively Targets Human Leukemia Stem Cells

Affiliations

Inhibition of Amino Acid Metabolism Selectively Targets Human Leukemia Stem Cells

Courtney L Jones et al. Cancer Cell. .

Erratum in

Abstract

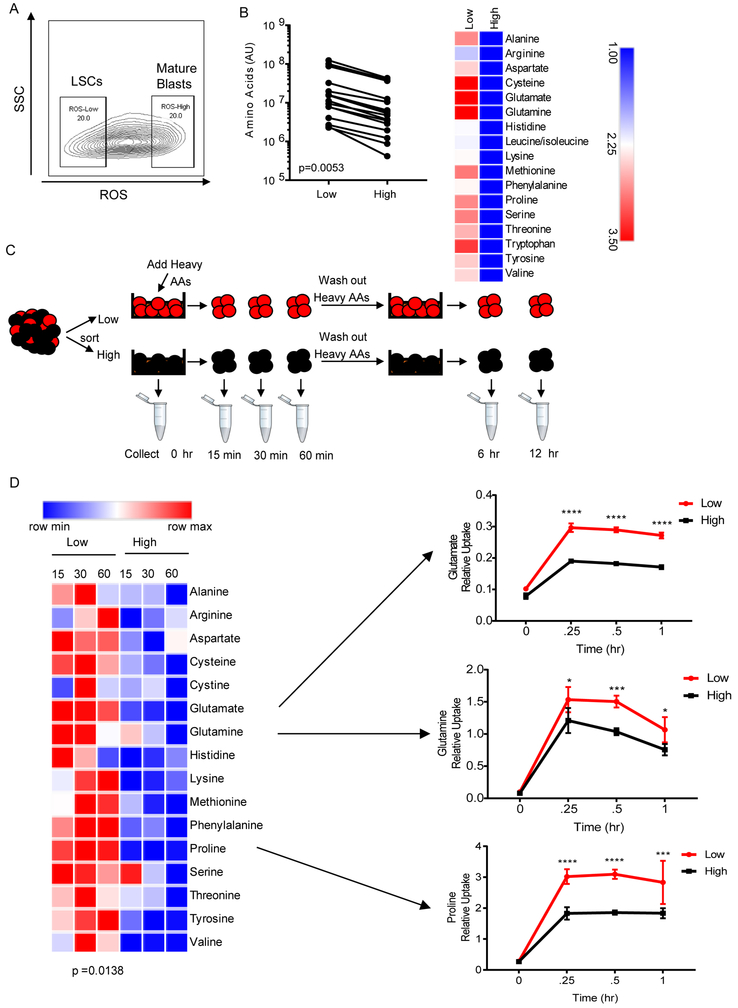
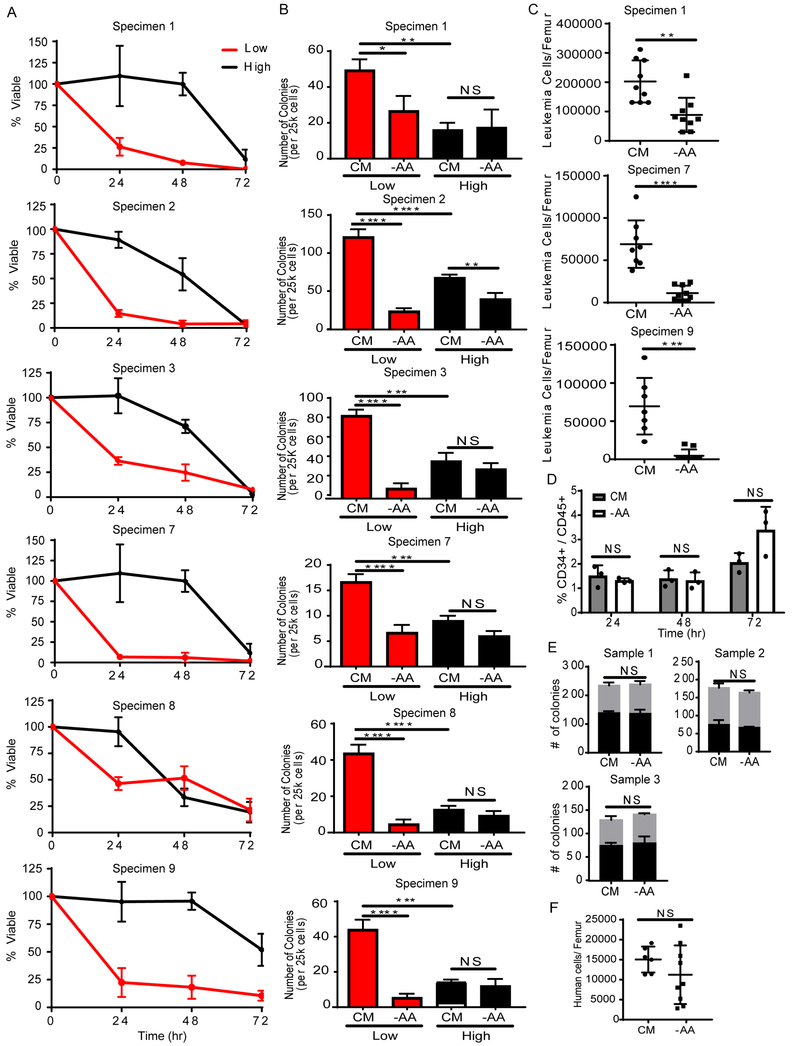
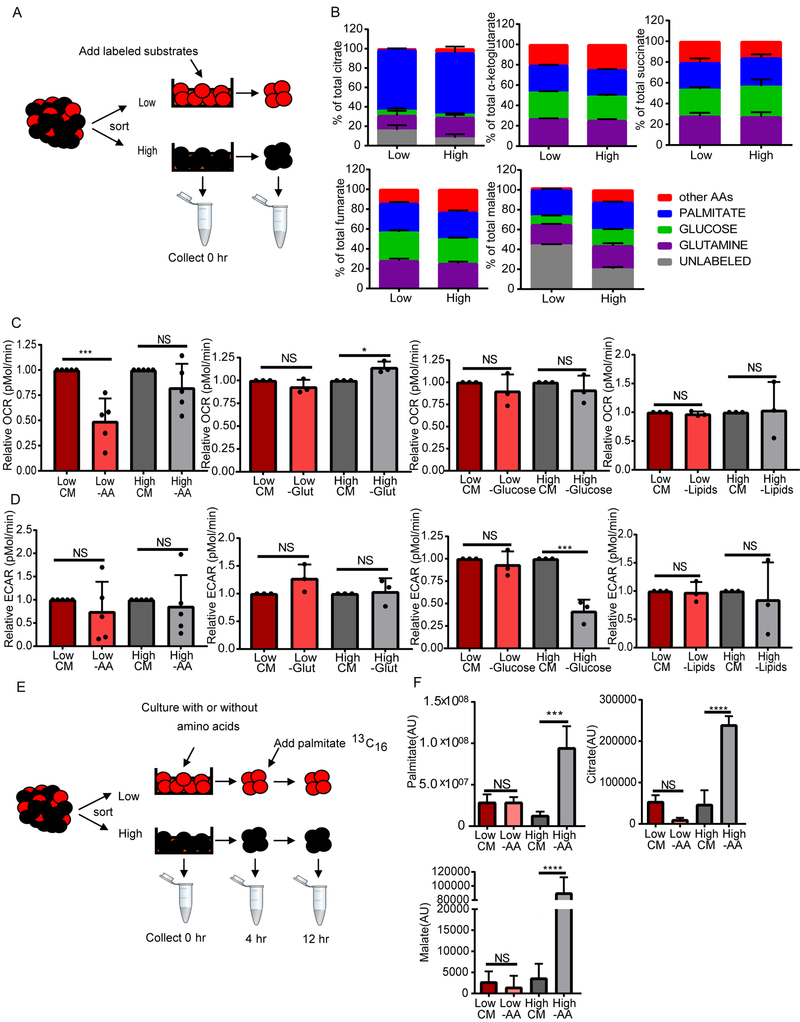
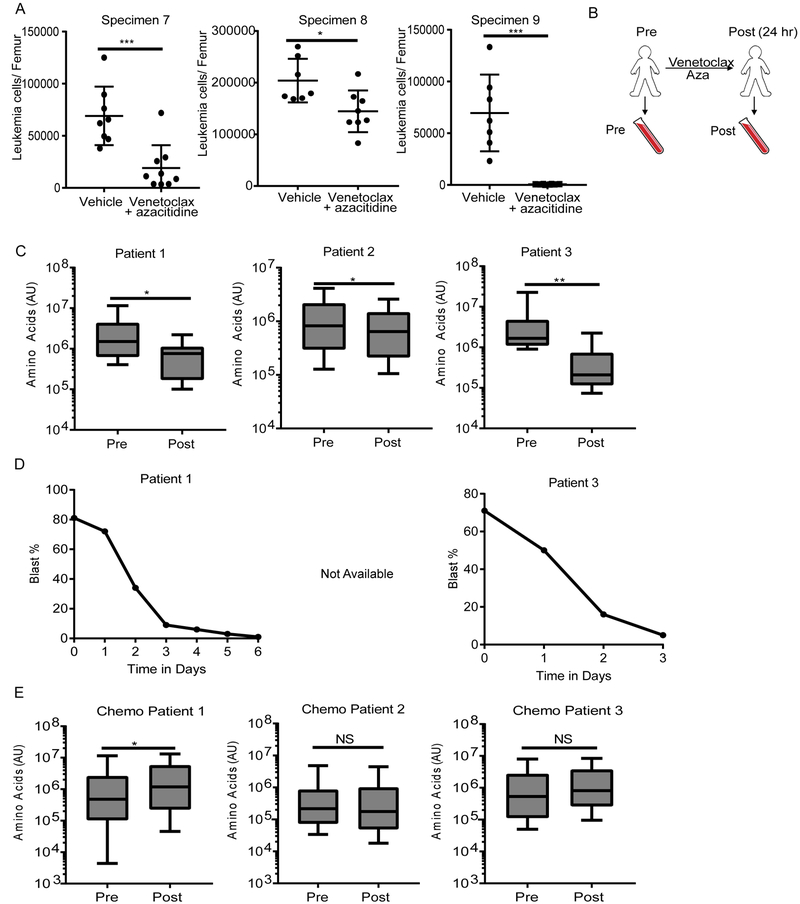
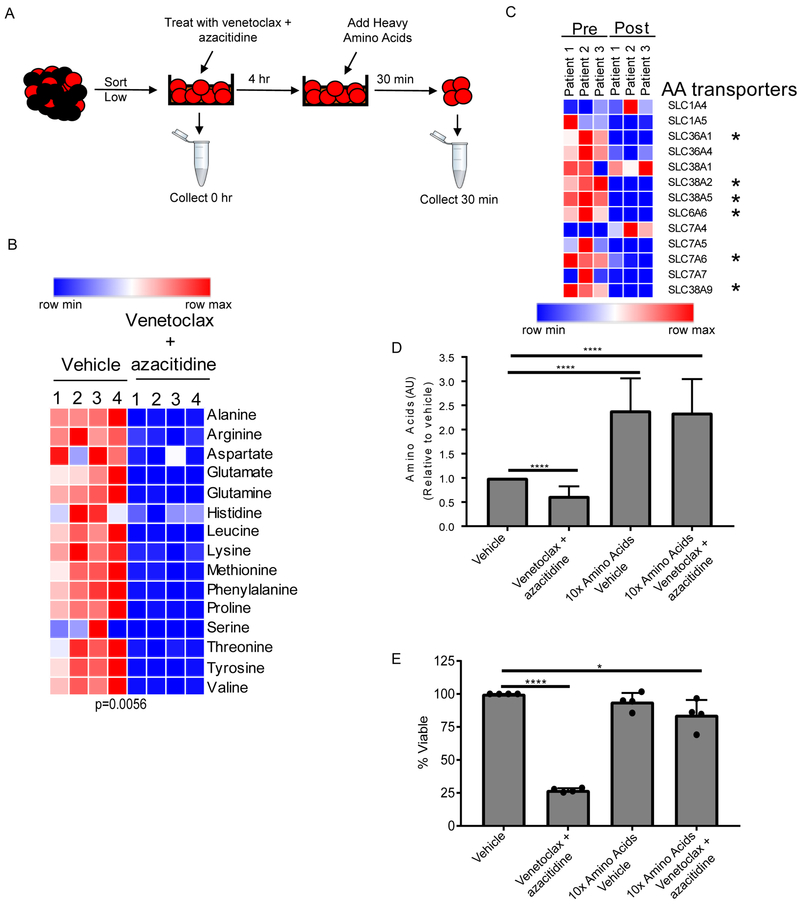
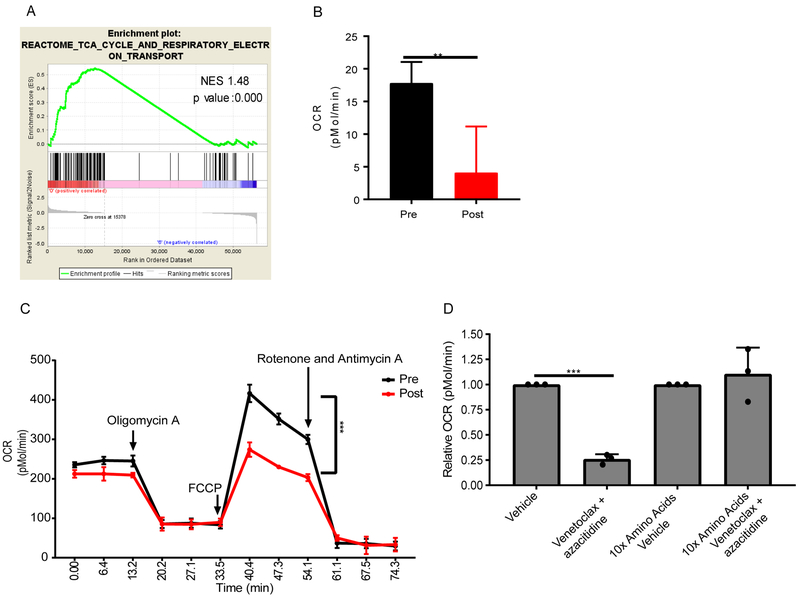
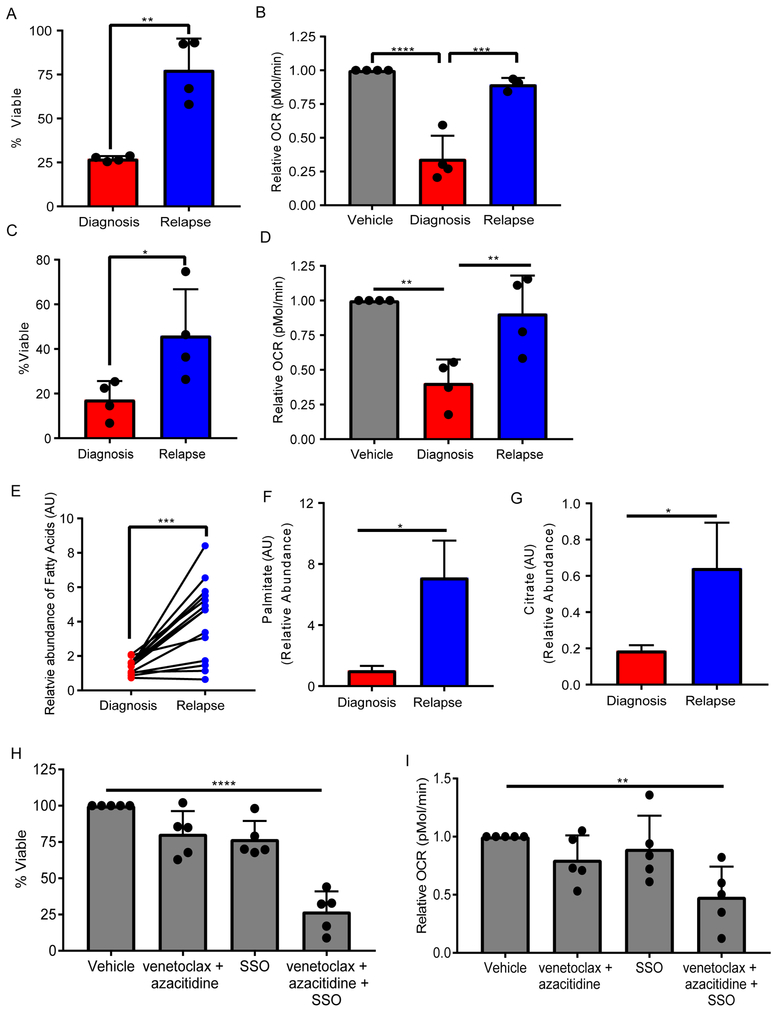
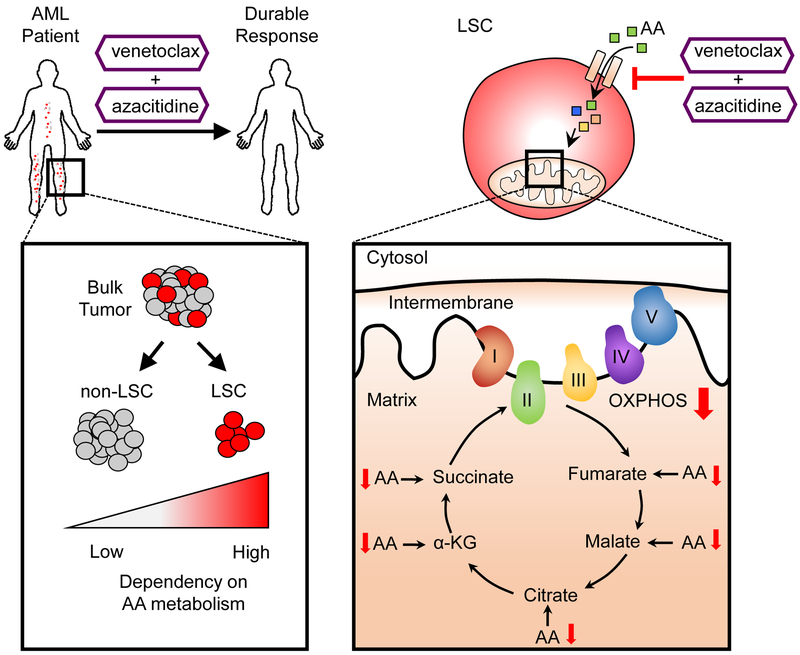
In this study we interrogated the metabolome of human acute myeloid leukemia (AML) stem cells to elucidate properties relevant to therapeutic intervention. We demonstrate that amino acid uptake, steady-state levels, and catabolism are all elevated in the leukemia stem cell (LSC) population. Furthermore, LSCs isolated from de novo AML patients are uniquely reliant on amino acid metabolism for oxidative phosphorylation and survival. Pharmacological inhibition of amino acid metabolism reduces oxidative phosphorylation and induces cell death. In contrast, LSCs obtained from relapsed AML patients are not reliant on amino acid metabolism due to their ability to compensate through increased fatty acid metabolism. These findings indicate that clinically relevant eradication of LSCs can be achieved with drugs that target LSC metabolic vulnerabilities.

Keywords: acute myeloid leukemia; amino acids; cancer cell metabolism; leukemia stem cells; metabolomics; venetoclax.


Figures

Figure 1:
Figure 1:. ROS-low LSCs have more amino acids than ROS-high blasts.
A. Representative flow plot of ROS-low enriched LSCs and ROS-high AML blasts from primary human specimens. B. Amino acid levels (arbitrary units-AU) based on mass spectrometry ROS-low LSCs and ROS-high AML blasts isolated from 15 primary AML specimens. Specimens 1-15 from Table S1 were used in this analysis. Significance was determined using a paired two-tailed student's t-test. C. Diagram showing experiment design. Stable isotope-labeled amino acids were pulsed into sorted ROS-low LSCs and ROS-high blasts for 15, 30 or 60 min and subsequently washed out for 6 or 12 hr. D. Heatmap of amino acid uptake in ROS-low LSCs and ROS-high AML blasts after a 15, 30, or 60 min pulse with stable isotope-labeled amino acids with examples of glutamine, glutamate and proline uptake from specimen 2. Data are represented as mean abundance ± standard deviation (SD) (n=4). Paired two-tailed student’s t-test was performed to identify statistical differences between amino acid uptake in ROS-low LSCs and ROS-high cells. * p<0.05, *** p<0.005, **** p<0.001 See also Figure S1, Table S1, and Table S2
Figure 2:
Figure 2:. ROS-low LSCs are dependent on amino acids.
A. Viability of ROS-low LSCs (red line) and ROS-high cells (black line) after culturing without amino acids for 24, 48, and 72 hr relative to ROS-low LSCs and ROS-high cells cultured in media with amino acids. (n=3). B. Colony-forming ability of ROS-low LSCs (red bars) and ROS-high cells (black bars) after culturing without amino acids for 24 hr compared to cells cultured in media containing amino acids, complete media (CM). Statistical analysis was performed using two-way ANOVA. (n=3). C. Engraftment of unsorted primary AML specimens (1 and 7) after culturing with or without amino acids for 24 hr. Each dot represents the leukemia cells/femur of an individual animal. Statistical analysis was performed using an unpaired two-tailed Student’s t-test. D. Percentage of CD34+/CD45+ cells after culturing normal mobilized peripheral blood cells with or without amino acids for 24, 48, and 72 hr. Each dot represents an individual patient sample. Statistical analysis was performed using two-way ANOVA. (n=3). E. Colony forming ability of mobilized peripheral blood cells after culturing with or without amino acids for 24 hr. CFU-GM = colony forming unit - granulocyte/monocyte, BFU-E = burst forming unit - erythroid. Statistical analysis was performed using an unpaired two-tailed Student’s t-test. (n=3). F. Engraftment of mobilized peripheral blood sample 1 after culturing with or without amino acids for 24 hr. Each dot represents the human cells/femur of an individual animal. Statistical analysis was performed using an unpaired two-tailed Student’s t-test. Graphs represent the mean ± SD. * p<0.05, ** p<0.01, *** p<0.005, **** p<0.001, NS = not significant. See also Figure S2
Figure 3:
Figure 3:. Amino acid depletion decreases OXPHOS specifically in ROS-low LSCs
A. Diagram showing experimental design. ROS-low LSCs were cultured with metabolic substrates labeled with stable isotopes; including, glucose, glutamine, amino acids without glutamine, or palmitic acid for 24 hr. B. Graph shows enrichment of heavy atoms (13C and 15N) from the stable isotopes from each substrate into TCA cycle intermediates in ROS-low LSCs and ROS-high cells isolated from specimen 7. (n=4) C. ROS-low LSCs and ROS-high cells isolated from primary AML samples were cultured in complete media (CM) or without amino acids (-AA), glutamine (glut), glucose, or lipids for 4 hr. After culture, oxygen consumption rate (OCR) was measured on a XF24 Seahorse Analyzer. Relative OCR was determined for each patient relative to CM. Statistical analysis was performed using two-way ANOVA. Each dot represents a different patient specimen. Patient specimens used in this analysis are 2, 7, 8, 9, and 10 (n=5). D. ROS-low LSCs and ROS-high cells isolated from primary AML samples were cultured without amino acids (-AA), glutamine (glut), glucose, or lipids for 4 hr. After culture, glycolytic rate (extracellular acidification rate; ECAR) was measured on a XF24 Seahorse Analyzer. Relative ECAR was determined for each patient relative to CM. Statistical analysis was performed using two-way ANOVA. Each dot represents a different patient sample. Patient specimens used in this analysis include 2, 7, 8, 9, and 10. (n=3). E. Diagram showing experimental design. ROS-low LSCs and ROS-high AML cells were cultured with or without amino acids for 4 hr. Stable isotope-labeled palmitic acid was fluxed into cells for 8 hr. F. Graph shows levels of 13C palmitic acid and enrichment (arbitrary units-AU) of heavy atom (13C) from the labeled palmitate into TCA cycle intermediates (citrate and malate). Statistical analysis was performed using two-way ANOVA. Patient specimen 7 was used for this analysis. (n=4). Graphs represent the mean ± SD. * p<0.05, *** p<0.005, **** p<0.001, NS = not significant See also Figure S3
Figure 4:
Figure 4:. Venetoclax in combination with azacitidine decreases amino acids in AML patients.
A. Engraftment of an unsorted primary AML specimens (7 and 8) after culturing with 500 nM venetoclax with 2.5 μM azacitidine or vehicle control for 24 hr. Each dot represents the leukemia cells/femur of an individual animal. Graphs represent the mean ± SD. Statistical analysis was performed using an unpaired two-tailed Student’s t-test. B. Diagram showing peripheral blood sampling from patients before therapy (pre) and 24 hr after venetoclax + azacitidine (post). C. Amino acid levels (measuring relative abundance) in ROS-low LSCs isolated from three patients on the venetoclax with azacitidine trial before (pre) and 24 hr post treatment (post) with venetoclax + azacitidine. Box plots represent the minimum to maximum values with the center line representing the mean. Error bars represent minimum and maximum. Statistical analysis was performed using an unpaired two-tailed Student’s t-test. D. Peripheral blast percentages (percentage of leukemia cells in the blood) determined by manual complete blood counts CBC in two patients treated with venetoclax + azacitidine. Day 0 is the day pretreatment, day 1 is 24 hr post treatment, etc. E. Amino acid levels in ROS-low LSCs isolated from three patients before (pre) and 24 hr post conventional chemotherapy cytarabine + an anthracycline (7+3) (post). Box plots represent the minimum to maximum values with the center line representing the mean. Error bars represent minimum and maximum. * p<0.05, ** p<0.01, *** p<0.005, NS = not significant See also Figure S4
Figure 5:
Figure 5:. Venetoclax in combination with azacitidine decreases amino acid uptake
A. Diagram showing experiment design. ROS-low LSCs were sorted, treated with venetoclax (500 nM) and azacitidine (2.5 μM) for 4 hr and then stable isotope-labeled amino acids were added for 30 min. Samples were then washed, collected, and analyzed for intracellular stable isotope amino acids. B. Heatmap of amino acid uptake in ROS-low LSCs upon vehicle or venetoclax with treatment. Specimen 2 was used for this analysis. (n=4) C. Heatmap of amino acids transporters RNA expression from 3 samples from patient on the clinical trial prior to (pre) and following (post) treatment with venetoclax + azacitidine for 5-7 hr. D. Amino acid levels in ROS-low LSCs were cultured in media containing ten times the levels of amino acids found in normal human plasma for 4 hr. Cells were then treated with vehicle or venetoclax (500 nM) and azacitidine (2.5 μM) for 4 hr and amino acid levels were determined relative to vehicle control. Specimens 7, 9, and 10 were used for this analysis. (n-3). E. ROS-low LSCs were cultured in media containing ten times the levels of amino acids found in normal human plasma for 4 hr. Cells were then treated with vehicle or venetoclax (500 nM) and azacitidine (2.5 μM) and cell viability was measured at 24 hr as a percentage relative to vehicle control (normal amino acid levels and no drug treatment). Each dot represents an individual patient sample treated in vitro. Specimens 7, 9, 10, and 11 were used for this analysis. Graphs represent the mean ± SD. For each graph statistical analysis was performed using Anova analysis. * p<0.05, **** p<0.001 See also Figure S5
Figure 6:
Figure 6:. Venetoclax in combination with azacitidine decreases OXPHOS in AML patients.
A. Gene set enrichment analysis of RNA-sequencing data for OXPHOS related genes in ROS-low LSCs pre and 5-7 hr post venetoclax + azacitidine treatment. This analysis was done using the three patients receiving venetoclax with azacitidine on the clinical trial. B. Basal oxygen consumption levels measured by seahorse assay in AML blasts isolated from patient 3 pre and 24 hr post venetoclax with azacitidine treatment. Statistical analysis was performed using an unpaired two-tailed Student's t-test (n=5). C. Basal and stressed oxygen consumption rate (OCR) in AML blasts isolated from patient 2 pre and 24 hr post venetoclax + azacitidine treatment Statistical analysis was performed using an unpaired two-tailed Student's t-test (n=5). D. Oxygen consumption measured in sorted ROS-low LSCs cultured in normal media or in media containing 10 times the levels of amino acids found in human serum for 4 hr and then treated with venetoclax (500 nM) and azacitidine (2.5 μM) for 4 hr. Relative OCR was determined for each patient compared to ROS-low LSCs cultured in media with normal levels of amino acids without drug treatment (vehicle). Each dot represents an individual patient sample treated in vitro. Specimens 7, 9, and 10 were used for this analysis. Statistical analysis was performed using two-way ANOVA. Graphs represent the mean ± SD. ** p<0.01, *** p<0.005 See also Figure S6
Figure 7:
Figure 7:. Relapse LSCs upregulate fatty acid metabolism to escape amino acid depletion.
A. Viability of LSCs isolated from de novo or relapse/refractory AML patients and treated with 500 nM venetoclax with 2.5 μM azacitidine for 24 hr relative to vehicle control for each patient. Statistical analysis was performed using an unpaired two-tailed Student's t-test. B. Relative OXPHOS levels based on oxygen consumption rate (OCR) from LSCs isolated from de novo or relapse/refractory AML patients and treated with 500 nM venetoclax with 2.5 μM azacitidine for 4 hr relative to vehicle control for each patient. Statistical analysis was performed using two-way ANOVA. C. Viability of LSCs isolated from de novo or relapse/refractory AML patients cultured without amino acids for 24 hr relative to vehicle control for each patient. Statistical analysis was performed using an unpaired two-tailed Student's t-test. D. Relative OXPHOS levels from LSCs isolated from de novo or relapse/refractory AML patients and cultured without amino acids for 4 hr relative to vehicle control for each patient. Statistical analysis was performed using two-way ANOVA. The specimens used in A-D include, de novo: 3, 7, 9, and 10; relapse/refractory: 1, 2, 8, and 16. E. Fatty acid levels from LSCs isolated from de novo or relapse/refractory AML patients and cultured without amino acids for 4 hr. Each dot and the connecting lines represent the mean of the abundance of a fatty acid in the de novo and relapse patients. Statistical analysis was performed using a paired two-tailed Student's t-test. The specimens used are 7, 9, 10, 1, 2, and 8. F. Palmitate 13C16 levels in LSCs isolated from de novo (specimen 7) or relapse/refractory (specimen 8) AML patients and cultured without amino acids for 4 hr and cultured with palmitate 13C16 for an additional 8 hr. Relative abundance was determine upon amino acid depletion compared to cells cultured in amino acid containing media. Statistical analysis was performed using an unpaired two-tailed Student's t-test. G. Citrate 13C3 levels in LSCs isolated from de novo or relapse/refractory AML patients and cultured without amino acids for 4 hr and cultured with palmitate 13C16 for an additional 8 hr. Relative abundance was determine upon amino acid depletion compared to cells cultured in amino acid containing media. Statistical analysis was performed using an unpaired two-tailed Student's t-test. H. Viability of LSCs isolated from relapse/refractory AML patients and treated with 500 nM venetoclax with 2.5 μM azacitidine, 50 μM SSO, or venetoclax with azacitidine and SSO for 24 hr relative to vehicle control for each patient. Statistical analysis was performed using two-way ANOVA. I. Oxygen consumption rate was measured in LSCs isolated from relapse/refractory AML patients and treated with 500 nM venetoclax with 2.5 μM azacitidine, 50 μM SSO, or venetoclax with azacitidine and SSO for 4 hr relative to vehicle control for each patient. Statistical analysis was performed using two-way ANOVA. Specimens 1, 2, 8, 16 and 17 were used for analysis in H and I. Each dot represents an individual patient sample treated in vitro. Graphs represent the mean ± SD. * p<0.05, ** p<0.01, *** p<0.005, **** p<0.001 Also see Figure S7
Figure 8:
Figure 8:. Summary of LSC targeting by venetoclax with azacitidine in AML patients.
LSCs catabolize amino acids into TCA cycle intermediates, making LSCs highly dependent on amino acid metabolism for OXPHOS and survival. Targeting amino acid uptake with venetoclax with azacitidine decreased OXPHOS resulting in LSC killing. Importantly, targeting amino acid metabolism in AML patients via venetoclax with azacitidine treatment results in durable remissions.

Comment in

References

    1. Chan SM, Thomas D, Corces-Zimmerman MR, Xavy S, Rastogi S, Hong WJ, Zhao F, Medeiros BC, Tyvoll DA, and Majeti R (2015). Isocitrate dehydrogenase 1 and 2 mutations induce BCL-2 dependence in acute myeloid leukemia. Nat Med 21, 178–184. - PMC - PubMed
    1. Cole A, Wang Z, Coyaud E, Voisin V, Gronda M, Jitkova Y, Mattson R, Hurren R, Babovic S, Maclean N, et al. (2015). Inhibition of the Mitochondrial Protease ClpP as a Therapeutic Strategy for Human Acute Myeloid Leukemia. Cancer Cell 27, 864–876. - PMC - PubMed
    1. Cramer SL, Saha A, Liu J, Tadi S, Tiziani S, Yan W, Triplett K, Lamb C, Alters SE, Rowlinson S, et al. (2017). Systemic depletion of L-cyst(e)ine with cyst(e)inase increases reactive oxygen species and suppresses tumor growth. Nat Med 23, 120–127. - PMC - PubMed
    1. Dick JE (2005). Acute myeloid leukemia stem cells. Ann N Y Acad Sci 1044, 1–5. - PubMed
    1. Diehn M, Cho RW, Lobo NA, Kalisky T, Dorie MJ, Kulp AN, Qian D, Lam JS, Ailles LE, Wong M, et al. (2009). Association of reactive oxygen species levels and radioresistance in cancer stem cells. Nature 458, 780–783. - PMC - PubMed

Publication types

MeSH terms