. 2018 Nov 12;34(5):757-774.e7.
doi: 10.1016/j.ccell.2018.10.006.

RIP1 Kinase Drives Macrophage-Mediated Adaptive Immune Tolerance in Pancreatic Cancer

Affiliations

RIP1 Kinase Drives Macrophage-Mediated Adaptive Immune Tolerance in Pancreatic Cancer

Wei Wang et al. Cancer Cell. .

Erratum in

  • RIP1 Kinase Drives Macrophage-Mediated Adaptive Immune Tolerance in Pancreatic Cancer.
    Wang W, Marinis JM, Beal AM, Savadkar S, Wu Y, Khan M, Taunk PS, Wu N, Su W, Wu J, Ahsan A, Kurz E, Chen T, Yaboh I, Li F, Gutierrez J, Diskin B, Hundeyin M, Reilly M, Lich JD, Harris PA, Mahajan MK, Thorpe JH, Nassau P, Mosley JE, Leinwand J, Kochen Rossi JA, Mishra A, Aykut B, Glacken M, Ochi A, Verma N, Kim JI, Vasudevaraja V, Adeegbe D, Almonte C, Bagdatlioglu E, Cohen DJ, Wong KK, Bertin J, Miller G. Wang W, et al. Cancer Cell. 2020 Oct 12;38(4):585-590. doi: 10.1016/j.ccell.2020.09.020. Cancer Cell. 2020. PMID: 33049209 No abstract available.

Abstract

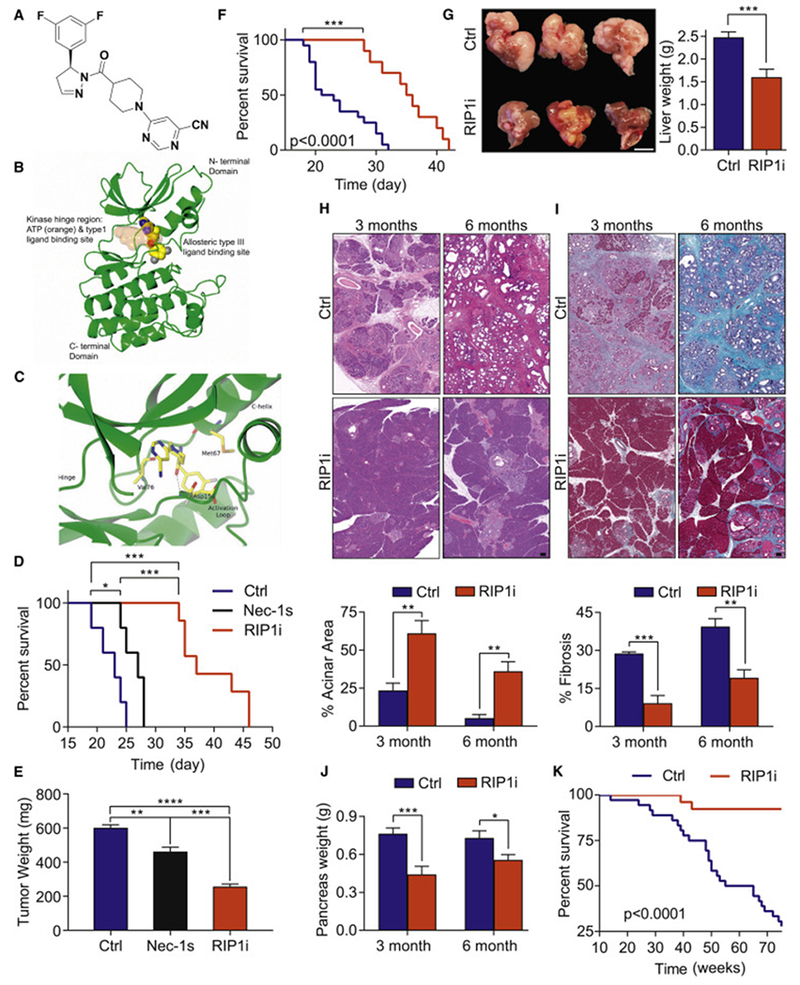
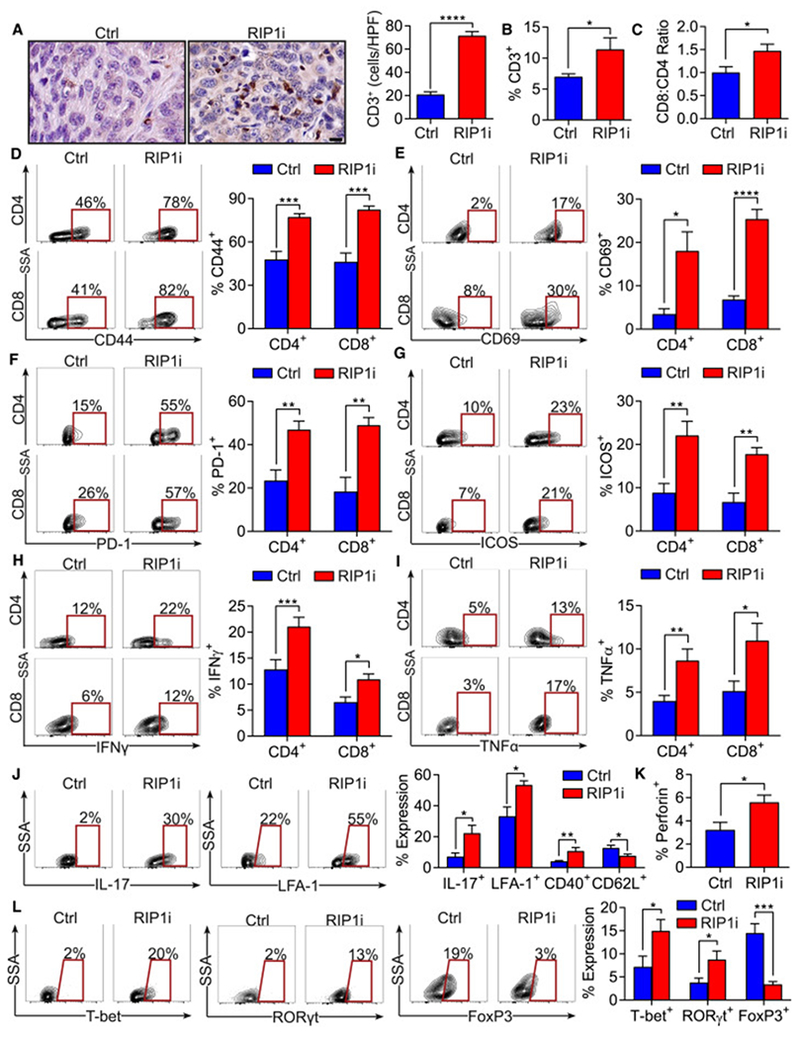
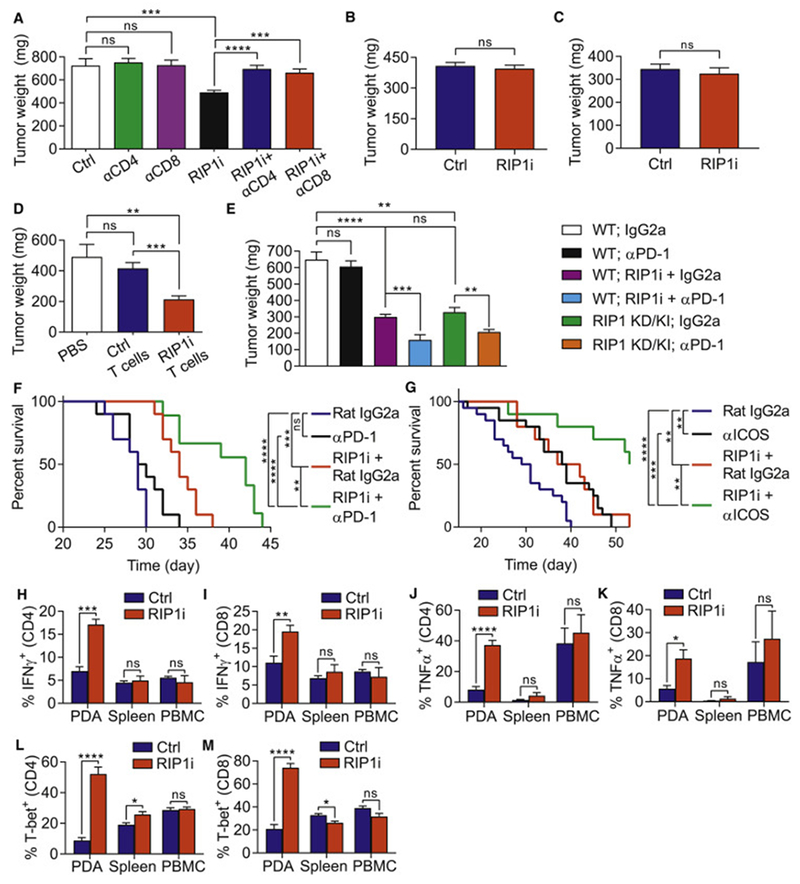
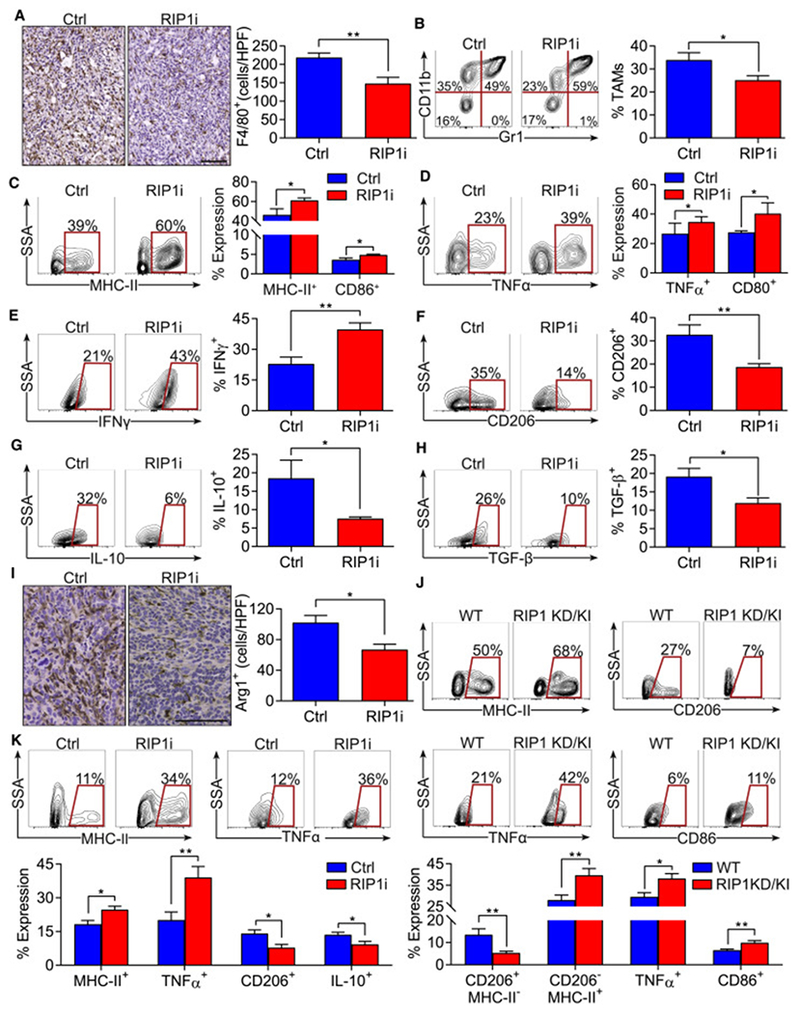
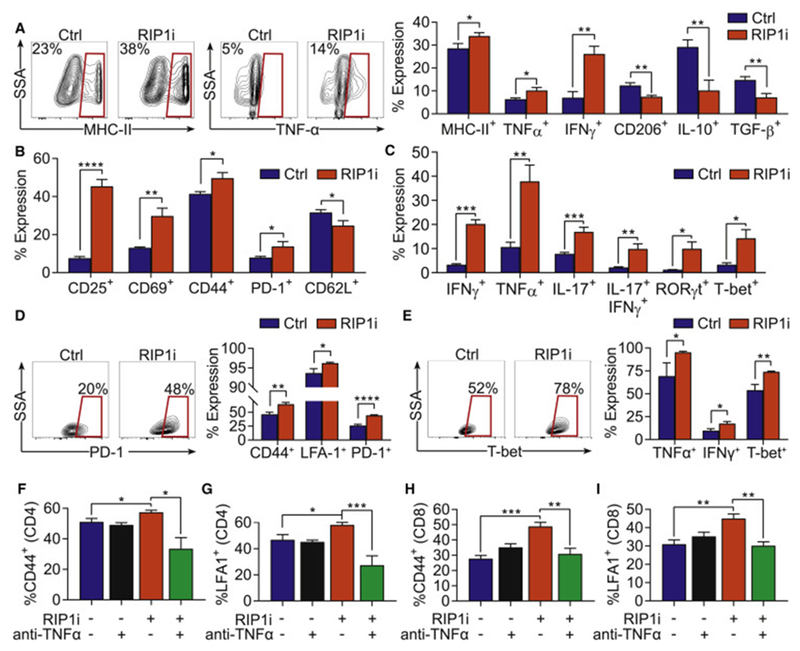
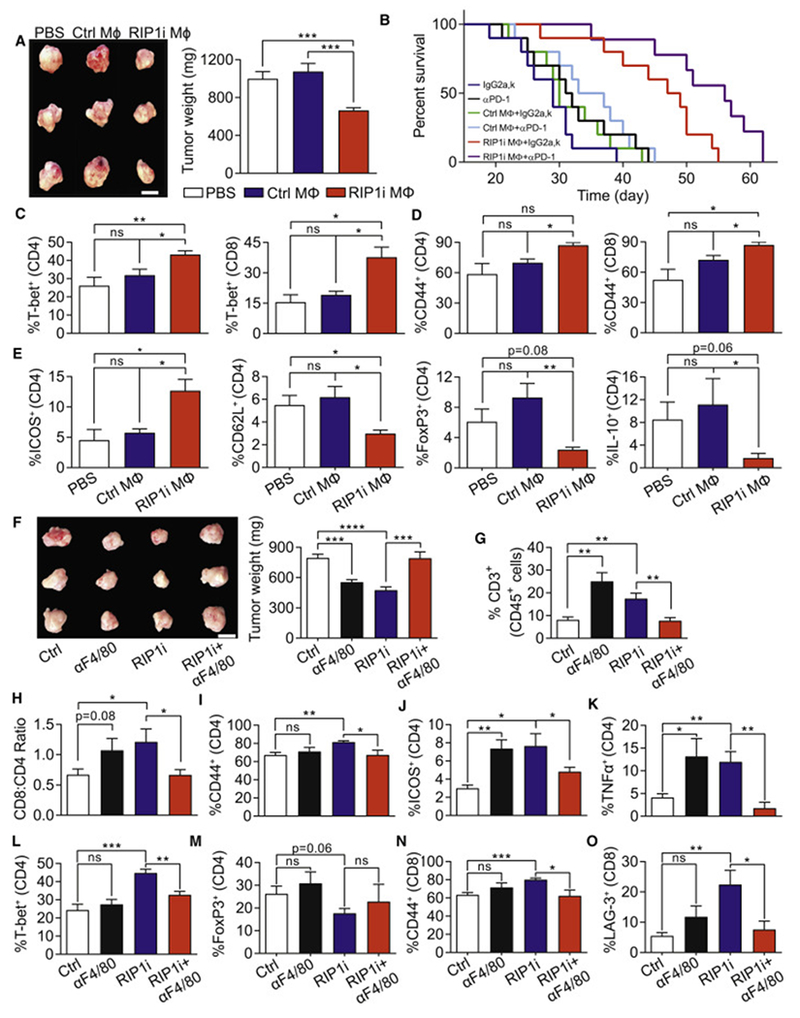
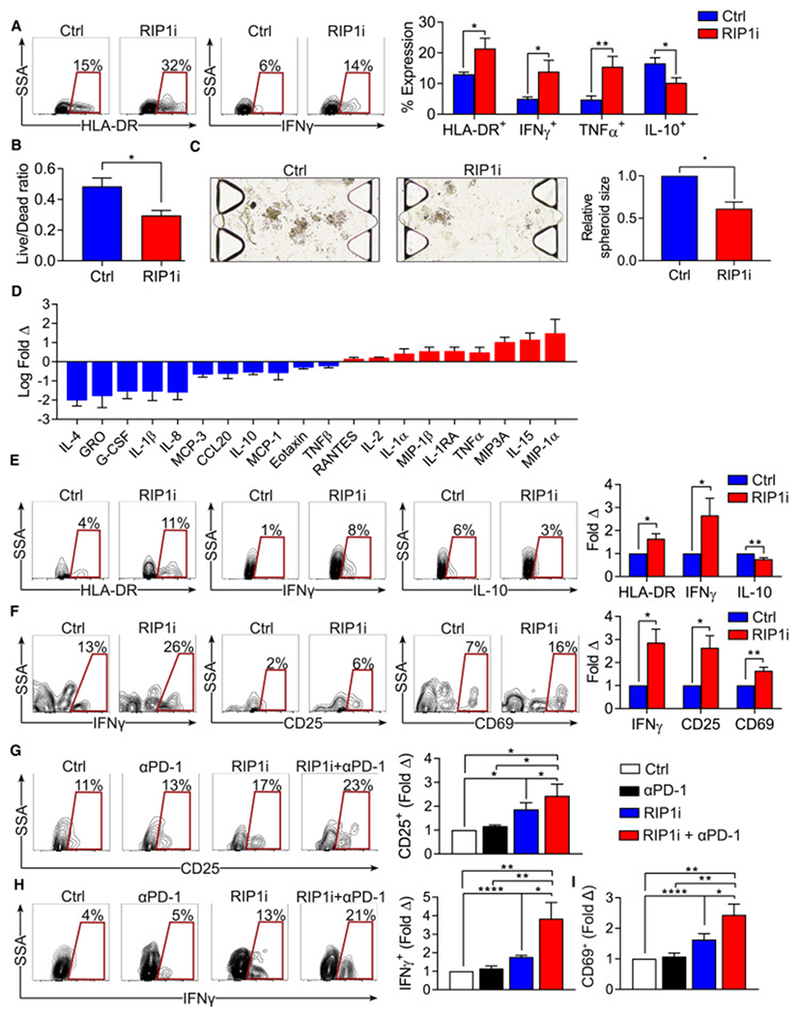
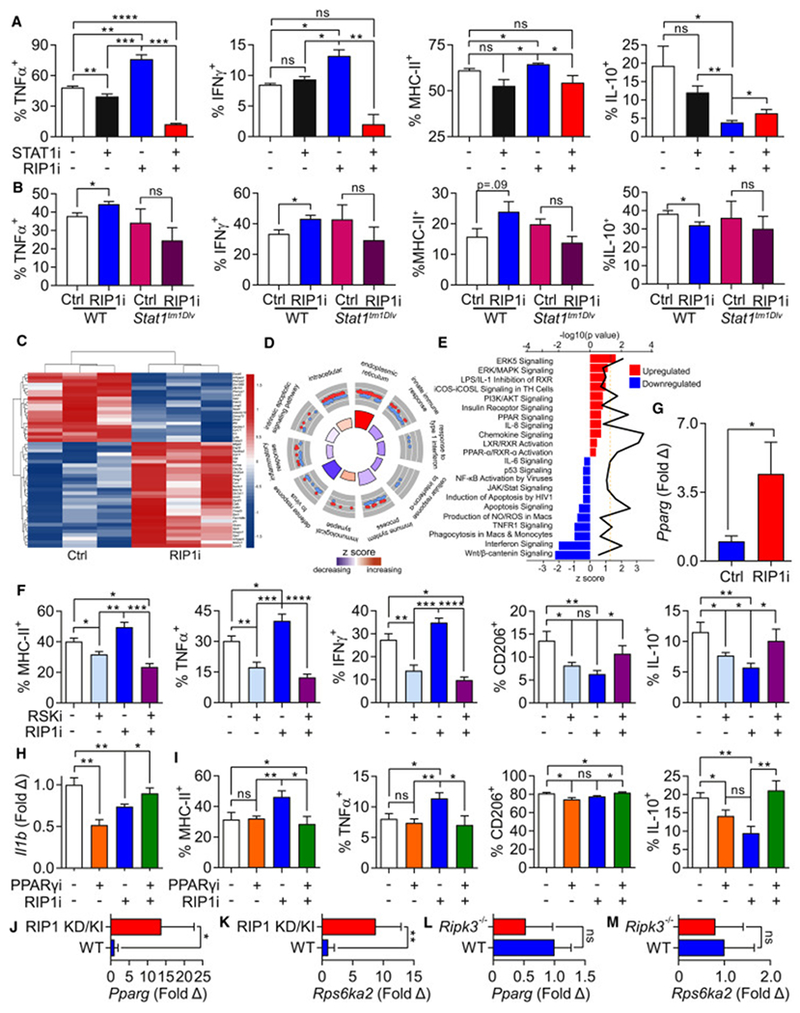
Pancreatic ductal adenocarcinoma (PDA) is characterized by immune tolerance and immunotherapeutic resistance. We discovered upregulation of receptor-interacting serine/threonine protein kinase 1 (RIP1) in tumor-associated macrophages (TAMs) in PDA. To study its role in oncogenic progression, we developed a selective small-molecule RIP1 inhibitor with high in vivo exposure. Targeting RIP1 reprogrammed TAMs toward an MHCIIhiTNFα+IFNγ+ immunogenic phenotype in a STAT1-dependent manner. RIP1 inhibition in TAMs resulted in cytotoxic T cell activation and T helper cell differentiation toward a mixed Th1/Th17 phenotype, leading to tumor immunity in mice and in organotypic models of human PDA. Targeting RIP1 synergized with PD1-and inducible co-stimulator-based immunotherapies. Tumor-promoting effects of RIP1 were independent of its co-association with RIP3. Collectively, our work describes RIP1 as a checkpoint kinase governing tumor immunity.

Keywords: Pancreatic cancer; inflammation; macrophage polarization; tumor immunity.


Conflict of interest statement

Declaration of Interests

JMM, AMB, MR, JL, PAH, MM, JHT, JEM, and JB are employees and shareholders of GSK.

JMM and JB are inventors on a patent application owned by GSK.

NYU School of Medicine signed a Research Contract Agreement with GSK to fund research in GM’s lab.

GM and DC received a one-time honorarium payment for giving a presentation at GSK.

GM is a co-founder and on the Scientific Advisory Board of NYBO Therapeutics.

Figures

Figure 1.
Figure 1.. Targeting RIP1 using a selective kinase inhibitor is protective against PDA.
(A) Chemical structure of GSK’547 (RIP1i). (B) The binding orientation of RIP1i in an allosteric pocket of the RIP1 kinase domain produced by single crystal X-ray crystallography. Atoms of RIP1i are represented as spheres with color coding: carbon (yellow), nitrogen (blue), oxygen (red), fluorine (grey). The ATP binding pocket is shaded in orange. The allosteric pocket is located at the back of the hinge region in a deep cleft located between the north and south domains of the kinase. (C) Close-up view of RIP1i bound in the allosteric pocket of the RIP1 kinase domain. The same colour coding is used as for Figure 1B. Note the direct hydrogen-bond interaction between the amide carbonyl of RIP1i and the backbone amide NH of Asp156. (D) Survival of WT mice orthotopically implanted with KPC-derived tumor cells treated with RIP1i, Nec1s, or vehicle beginning on the day of tumor implantation quantified with the Kaplan-Meier estimator (n=5-7/group). (E) Tumor weight from additional cohorts (n=5/group) similar to (D) sacrificed on day 21. One representative of more than five repeats. (F) Kaplan-Meier survival analysis of WT mice administered RIP1i (n=10) or control (n=15) beginning on day 10 after orthotopically implanted with KPC-derived tumor cells. This experiment was repeated twice. (G) Representative images of livers (scale bar = 1 cm) and quantification of liver weights of WT mice injected with KPC-derived tumor cells via the portal vein and treated with RIP1i or control beginning on day 5 after tumor challenge. Mice were sacrificed at 21 days (n=8/group). This experiment was repeated 4 times. (H-J) Representative images of H&E (H) and Gomori Trichrome (I) staining (scale bars = 100 μm) and the percentages of preserved acinar (H) and fibrotic (I) area as well as pancreatic weights (J) of pancreas harvested from KC mice fed with RIP1i-containing or control chow beginning at 6 weeks of life at 3 months and 6 months (n=8). (K) Kaplan-Meier survival analysis in cohorts of RIP1i-treated (n=26) and control (n=36) KC 97 mice as in (H-J). Data are displayed as average ± SEM (*p<0.05; **p<0.01; ***p<0.001; ****p<0.0001). See also Figure S1 and Tables S1–S4.
Figure 2.
Figure 2.. RIP1 inhibition provides adaptive anti-tumor immunity in PDA.
WT mice bearing orthotopic KPC tumors were treated with RIP1i or control and were sacrificed at 21 days (n=5/group). (A) IHC of PDA tumors for CD3 (scale bar = 10 μm). (B, C) The percentage of intra-tumoral CD3+ T cells (B) and the CD8:CD4 T cell ratio (C) determined by flow cytometry. (D-I) CD4+ and CD8+ T cells were gated and tested for expression of CD44 (D), CD69 (E), PD-1 (F), ICOS (G), IFNγ (H), and TNFα (I). (J) Expression of IL-17, LFA-1, CD40, and CD62L in CD4+ T cells. (K) Expression of Perforin in CD8+ T cells . (L) Expression of T-bet, RORγt, and FoxP3 in CD4+ T cells. These experiments were repeated more than 5 times with similar results (*p<0.05; **p<0.01; ***p<0.001; ****p<0.0001). Data are displayed as average ± SEM. See also Figure S2.
Figure 3.
Figure 3.. RIP1i-mediated tumor-protection is CD4+ and CD8+ T cell dependent and is synergistic with PD-1 blockade and ICOS agonism.
(A) Tumor weight of WT mice bearing KPC-derived tumor treated with neutralizing mAbs against CD4 or CD8 or with isotype control alone or in combination with RIP1i or control and sacrificed at 21 days (n=10/group). This experiment was repeated twice. (B, C) Tumor weights of WT and Foxn1nu mice (B, n=7/group) and of WT and Rag1−/− mice (C, n=5/group) challenged with orthotopic KPC tumor cells and sacrificed at 3 weeks. Each experiment was repeated twice. (D) Tumor weights of WT mice orthotopically implanted with KPC-derived tumor cells alone or admixed with tumor-infiltrating T cells harvested from control PDA or from PDA in RIP1i-treated mice (n=8/group) and were sacrificed on day 21. This experiment was repeated twice. (E) Tumor weight of WT or RIP1 KD/KI mice (n=8/group) orthotopically implanted with KPC-derived tumor cells and treated as indicated. Mice were sacrificed at 21 days. This experiment was repeated 3 times. (F) Kaplan-Meier survival analysis of WT mice administered with a portal venous injection of KPC-derived tumor cells and treated as indicated beginning on day 5 after tumor challenge (n=10/group). This data represents one of two repeat experiments. (G) Kaplan-Meier survival analysis of WT mice orthotopically implanted with KPC-derived tumor cells and treated as indicated (n=10-20/group). This data represents one of two repeat experiments. (H-M) Expression of IFNγ (H, I), TNFα (J, K), and T-bet (L, M) in PBMC, spleen, and PDA-infiltrating CD4+ (H, J, and L) and CD8+ (I, K, and M) T cells from WT mice orthotopically implanted with KPC-derived tumor cells and treated with RIP1i or control and sacrificed at 21 days. These experiments were repeated twice. Data are displayed as average ± SEM (*p<0.05; **p<0.01; ***p<0.001; ****p<0.0001). See also Figure S3.
Figure 4.
Figure 4.. Inhibition of RIP1 signaling mitigates TAM infiltration and reprograms TAMs in PDA.
(A-I) WT mice bearing orthotopic KPC tumors were treated with RIP1i or control and were sacrificed at 21 days (n=5/group). IHC of PDA tumors for F4/80 (scale bar = 100 μm) (A). The percentage of Gr1CD11cF480+CD11b+ TAM was determined by flow cytometry (B). TAMs were tested for expression of MHC-II, CD86 (C), TNFα, CD80 (D), IFNγ (E), CD206 (F), IL-10 (G), and TGF-β (H). Pancreata were analyzed for expression of Arg1 by IHC (scale bar = 100 μm) (I). (J) WT and RIP1 KD/KI mice bearing orthotopic KPC tumors were sacrificed at 21 days and tumors were analyzed by flow cytometry. TAMs were tested for expression of MHC-II, CD206, TNFα, and CD86 (n=10/group). (K) Expression of MHC-II, TNFα, CD206, and IL-10 in TAMs isolated at day 21 from WT mice injected with KPC-derived tumor cells via portal venous and treated with RIP1i or control beginning on the day of tumor administration (n=5/group). Macrophage phenotyping experiments were repeated more than 5 times (*p<0.05; **p<0.01). Data are displayed as average ± SEM.
Figure 5.
Figure 5.. RIP1 regulates macrophage differentiation and immunogenicity.
(A) Expression of MHC-II, TNFα, IFNγ CD206, IL-10, and TGF-β in day 7 BMDM treated with RIP1i or vehicle for 18 hr. This experiment was performed more than 5 times in replicates of 5. (B, C) Expression of surface activation markers (B) and cytokines and transcription factors (C) in Ova-restricted CD4+ T cells co-cultured for 96 hr with TAMs harvested from day 21 PDA tumors of mice treated with RIP1i or control chow and pulsed with Ova323-339 peptide. This experiment was performed 4 times in replicates of 5. (D, E) Expression of surface activation markers (D) and cytokines and transcription factors (E) in Ova-restricted CD8+ T cells co-cultured for 96 hr with TAMs harvested from day 21 PDA tumors of mice treated with RIP1i or control chow and pulsed with Ova257-263 peptide. This experiment was performed twice in replicates of 5. (F, G) Expression of CD44 (F) and LFA1 (G) in Ova-restricted CD4+ T cells co-cultured for 96 hr with BMDM treated with RIP1i or vehicle plus a neutralizing α-TNFα mAb or isotype and pulsed with Ova323-339 peptide. This experiment was performed twice in replicates of 5. (H, I) Expression of CD44 (H) and LFA1 (I) in Ova-restricted CD8+ T cells co-cultured for 96 hr with BMDM treated with RIP1i or vehicle plus a neutralizing α-TNFα mAb or isotype and pulsed with Ova257-264 peptide. This experiment was performed twice times in replicates of 5. Data are displayed as average ± SEM (*p<0.05; **p<0.01; ***p<0.001; ****p<0.0001). See also Figure S4.
Figure 6.
Figure 6.. RIP1 inhibition endows TAMs with tumor-protective and immunogenic properties.
(A) Representative images (scale bar = 1 cm) and weight of tumors from WT mice on day 21 after orthotopic administration of KPC-derived tumor cells alone, tumor cells admixed with TAMs harvested from control PDA, or tumor cells admixed with TAMs harvested from PDA in RIP1i-treated mice (n=5/group). (B) Kaplan-Meier survival analysis of WT mice orthotopically implanted with KPC-derived tumor cells alone, tumor cells admixed with TAMs harvested from control PDA, or tumor cells admixed with TAMs harvested from PDA in RIP1i-treated mice. Cohorts were additionally treated with αPD1 or isotype (n=10/group; p values: Isotype vs. αPD1 0.15, Ctrl TAMs+Isotype vs. Isotype 0.37, Ctrl TAMs+isotype vs. Ctrl TAMs+αPD1 0.29, RIP1i TAMs+Isotype vs. Isotype 0.0001, RIP1i TAMs+Isotype vs. RIP1i TAMs+αPD1 0.01, Ctrl TAMs+Isotype vs. RIP1i TAMs+Isotype 0.0004). Macrophage adoptive transfer experiments were repeated 3 times. (C-E) Expression of T-bet (C) and CD44 (D) in tumor-infiltrating CD4+ and CD8+ T cells and expression of ICOS, CD62L, FoxP3, and IL-10 in tumor-infiltrating CD4+ T cells (E) harvested from WT mice 21 days after orthotopically implanted with KPC-derived tumor cells alone, tumor cells admixed with TAMs harvested from control PDA, or tumor cells admixed with TAMs harvested from PDA in RIP1i-treated mice (n=5/group). This experiment was repeated twice. (F) Representative images (scale bar = 1 cm) and weight of tumors from WT mice bearing KPC-derived tumor treated with an αF4/80 neutralizing or isotype alone or in combination with RIP1i and sacrificed at 21 days (n=7/group). (G-O) Mice were treated as in (F). The percentage of intra-tumoral CD3+ T cells (G) and the CD8:CD4 T cells ratio (H) determined by flow cytometry, the expression of CD44 (I), ICOS (J), TNFα (K), T-bet (L), and FoxP3 (M) in CD4+ T cells, and the expression of CD44 (N) and LAG-3 (O) in CD8+ T cells from (K). This experiment was repeated twice. Data are displayed as average ± SEM (*p<0.05; **p<0.01; ***p<0.001; ****p<0.0001). See also Figure S4.
Figure 7.
Figure 7.. Inhibition of RIP1 in organotypic models of human PDA activates innate and adaptive immunity and decreases tumor viability.
(A) Select contour plots and quantification of the expression of HLA-DR, 1FNγ, TNFα, and IL-10 in PBMC-derived monocytes treated with RIP1i or vehicle (n=9). (B, C) Tumor cell viability (B) and the relative sizes of spheroids (C) of PDOTS (n=5 patient samples) treated with RIP1i or vehicle. (D) The relative levels of indicated inflammatory mediators in supernatant of PDOTS from PDA patients (n=5) treated with RIP1i vs. vehicle. (E, F) Expression of HLA-DR, IFNγ and IL-10 in TAMs (E) and expression of IFNγ, CD25, and CD69 in CD4+ T cells (F) from PDOTS (n=10) treated with RIP1i or vehicle. Representative contour plots and quantitative data are shown as fold change compared to vehicle treatment. (G-I) Expression of CD25 (G), IFNγ (H), and CD69 (I) in CD4+ T cells from PDOTS (n=6 patients) treated with vehicle, RIP1i alone, αPD-1 alone, or RIP1i + αPD-1. Representative contour plots and quantitative data are shown as fold change compared to vehicle treatment. Data are displayed as average ± SEM (*p<0.05; **p<0.01; ***p<0.001; ****p<0.0001).
Figure 8.
Figure 8.. Signaling changes in macrophages induced by RIP1i.
(A) Expression of TNFα, IFNγ, MHC-II, and IL-10 in day 7 BMDM harvested from WT mice treated with RIP1i or vehicle, either alone or in combination with a STAT1 inhibitor (STAT1i) for 18 hr determined by flow cytometry. This experiment was performed 4 times in replicates of 5. (B) Expression of TNFα, IFNγ, MHC-II, and IL-10 in day 7 BMDM harvested from WT or Stat1tm1Dlv mice treated with RIP1i or vehicle for 18 hr determined by flow cytometry. This experiment was performed twice in replicates of 5. (C-E) Heatmap of top 50 differentially expressed genes (C), top scoring Gene Ontology (GO) terms related to innate inflammatory and immune responses (D), and canonical pathway perturbations derived using ingenuity pathway analysis (IPA) (E) from RNA-Seq analysis (in triplicates) of day 7 BMDM treated with RIP1i or vehicle for 18 hr. In (D) red (up-regulated) and blue (down-regulated) dots in outer circle show the log2FC of genes in each GO term. Bar plot colors in the inner circle are based on z-scores, and the height of each bar represents each GO term’s significance. In (E) up-regulated (red) and down-regulated (blue) pathways specific to macrophage and immune response were identified after RIP1i treatment. Z score is shown on the lower x-axis and corresponds to the length of the respective bars. P value for each pathway is indicated by the black line and the corresponding upper x-axis. The dashed line represents the threshold for statistical significance. (F) Expression of MHC-II, TNFα, IFNγ, CD206, and IL-10 in day 7 BMDM treated with RIP1i or vehicle, alone or in combination with RSK inhibitor (RSKi) for 18 hr determined by flow cytometry. This experiment was repeated three times in 5 replicates. (G) The expression of Pparg in day 7 BMDM treated for 18 hr with RIP1i or vehicle measured by qPCR. (H) The expression of Il1b in day 7 BMDM treated for 18 hr with RIP1i alone, PPARγ inhibitor (PPARγi) alone, or RIP1i + PPARγi determined by qPCR. This experiment was performed in replicates of 5 and repeated twice. (I) Expression of MHC-II, TNFα, CD206, and IL-10 in day 7 BMDM treated as in (H). This experiment was repeated twice in 5 replicates. (J, K) Expression of Pparg (J) and Rps6ka2 (K) in day7 BMDM from WT and RIP1 KD/KI mice analyzed by qPCR (n=5/group). (L, M) Expression of Pparg (L) and Rps6ka2 (M) in day 7 WT and Ripk3−/− BMDM were analyzed by qPCR (n=4/group). qPCR experiments were repeated twice. Data are displayed as average ± SEM (*p<0.05; **p<0.01; ***p<0.001; ****p<0.0001). See also Figure S5.

References

    1. Adams PD, Afonine PV, Bunkoczi G, Chen VB, Davis IW, Echols N, Headd JJ, Hung LW, Kapral GJ, Grosse-Kunstleve RW, et al. (2010). PHENIX: a comprehensive Python-based system for macromolecular structure solution. Acta Crystallogr D Biol Crystallogr 66, 213–221. - PMC - PubMed
    1. Andren-Sandberg A, Dervenis C, and Lowenfels B (1997). Etiologic links between chronic pancreatitis and pancreatic cancer. Scand J Gastroenterol 32, 97–103. - PubMed
    1. Barber MD, Powell JJ, Lynch SF, Fearon KC, and Ross JA (2000). A polymorphism of the interleukin-1 beta gene influences survival in pancreatic cancer. British journal of cancer 83, 1443–1447. - PMC - PubMed
    1. Bayne LJ, Beatty GL, Jhala N, Clark CE, Rhim AD, Stanger BZ, and Vonderheide RH (2012). Tumor-derived granulocyte-macrophage colony-stimulating factor regulates myeloid inflammation and T cell immunity in pancreatic cancer. Cancer Cell 21, 822–835. - PMC - PubMed
    1. Beatty GL, Chiorean EG, Fishman MP, Saboury B, Teitelbaum UR, Sun W, Huhn RD, Song W, Li D, Sharp LL, et al. (2011). CD40 agonists alter tumor stroma and show efficacy against pancreatic carcinoma in mice and humans. Science 331, 1612–1616. - PMC - PubMed

Publication types

MeSH terms

Substances