. 2018 Nov 9;15(11):2516.
doi: 10.3390/ijerph15112516.

A Raster-Based Subdividing Indicator to Map Urban Heat Vulnerability: A Case Study in Sydney, Australia

Affiliations

A Raster-Based Subdividing Indicator to Map Urban Heat Vulnerability: A Case Study in Sydney, Australia

Wei Zhang et al. Int J Environ Res Public Health. .

Abstract

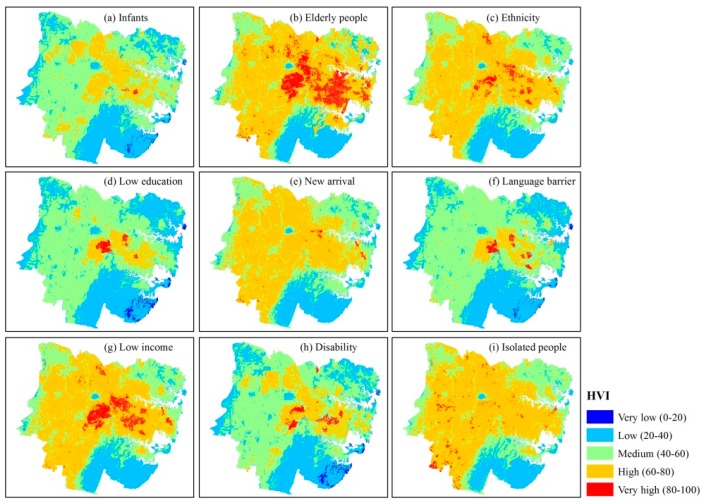
Assessing and mapping urban heat vulnerability has developed significantly over the past decade. Many studies have mapped urban heat vulnerability with a census unit-based general indicator (CGI). However, this kind of indicator has many problems, such as inaccurate assessment results and lacking comparability among different studies. This paper seeks to address this research gap and proposes a raster-based subdividing indicator to map urban heat vulnerability. We created a raster-based subdividing indicator (RSI) to map urban heat vulnerability from 3 aspects: exposure, sensitivity and adaptive capacity. We applied and compared it with a raster-based general indicator (RGI) and a census unit-based general indicator (CGI) in Sydney, Australia. Spatial statistics and analysis were used to investigate the performance among those three indicators. The results indicate that: (1) compared with the RSI framework, 67.54% of very high heat vulnerability pixels were ignored in the RGI framework; and up to 83.63% of very high heat vulnerability pixels were ignored in the CGI framework; (2) Compared with the previous CGI framework, a RSI framework has many advantages. These include more accurate results, more flexible model structure, and higher comparability among different studies. This study recommends using a RSI framework to map urban heat vulnerability in the future.

Keywords: Sydney; demography; heat vulnerability; indicators; mapping; public health.


Conflict of interest statement

The authors declare that they have no competing interests.

Figures

Figure 1
Figure 1
An illustration of the loss of information and spatial differentiation during aggregation. (ac) are different vulnerability layers in a raster framework, which represent the spatial distribution of individual heat vulnerability factors such as age, race and income. The scores of all the heat vulnerability layers are reclassified to a range of 1 to 9. 1 represents the lowest risk level, while 9 means the highest risk level. (d) is the spatial aggregation result of all heat vulnerability factors.
Figure 2
Figure 2
Flowchart of this research. (1) We assess and map urban heat vulnerability in 3 frameworks, and then compare and analyze the spatial differentiation among 3 heat vulnerability maps. (2) Abbreviations: RSI: raster-based subdividing indicator; RGI: raster-based general indicator; CGI: census unit-based general indicator; RSHVM: raster-based subdividing heat vulnerability map; RGHVM: raster-based general heat vulnerability map; CGHVM: census unit-based general heat vulnerability map.
Figure 3
Figure 3
Land surface temperature (LST) of Sydney. CBD: Central Business District; SA2: Statistical Areas Level 2.
Figure 4
Figure 4
Land use types of the study area. “Water body” includes the land use classes of “river and drainage system” and “wetland” in Land Use Mapping Program (LUMAP); “Urban region” includes the land use classes of “urban” in LUMAP. CBD: Central Business District; SA2: Statistical Areas Level 2.
Figure 5
Figure 5
Raster-Based Subdividing Heat Vulnerability Map (RSHVM) of each fragile group in Sydney. Equal interval classification method was used to ensure the comparability among heat vulnerability indicators (HVIs).
Figure 6
Figure 6
Coefficient of variation (CV) of 9 HVI scores at pixel scale. A total of 9 HVI scores of each pixel were presented in Figure 5. The formula of CV is: CVi = (STDi/MEANi) × 100%, where CVi is the coefficient of variation of pixel i; STDi is the standard deviation of 9 HVIs of pixel i; MEANi is the average value of 9 HVIs of pixel i.
Figure 7
Figure 7
Raster-Based General Heat Vulnerability Map (RGHVM) in Sydney.
Figure 8
Figure 8
Census unit-based General Heat Vulnerability Map (CGHVM) in Sydney.
Figure 9
Figure 9
Subdividing the high HVI score area (SHHA) of each fragile group in Sydney. The THHA layer is lower than the SHHA layer, so the THHA is invisible if there is SHHA.
Figure 10
Figure 10
General high HVI score area (GHHA) of Sydney.
Figure 11
Figure 11
Information retained in three kinds of heat vulnerability maps.

References

    1. Reid C.E., O’Neill M.S., Gronlund C.J., Brines S.J., Brown D.G., Diez-Roux A.V., Schwartz J. Mapping community determinants of heat vulnerability. Environ. Health Perspect. 2009;117:1730. doi: 10.1289/ehp.0900683. - DOI - PMC - PubMed
    1. Aminipouri M., Knudby A., Ho H.C. Using multiple disparate data sources to map heat vulnerability: Vancouver case study. Can. Geogr. 2016;60:356–368. doi: 10.1111/cag.12282. - DOI
    1. Mortensen J.W., Heaton M.J., Wilhelmi O.V. Urban heat risk mapping using multiple point patterns in Houston, Texas. J. R. Stat. Soc. 2018;67:83–102. doi: 10.1111/rssc.12224. - DOI
    1. Pincetl S., Chester M., Eisenman D. Urban heat stress vulnerability in the U.S. Southwest: The role of sociotechnical systems. Sustainability. 2016;8:842. doi: 10.3390/su8090842. - DOI
    1. Keller R.C. Place matters: Mortality, space, and urban form in the 2003 Paris heat wave disaster. Fr. Hist. Stud. 2013;36:299–330. doi: 10.1215/00161071-1960682. - DOI

Publication types

LinkOut - more resources