Review
. 2018 May 3;9(5):216.
doi: 10.3390/mi9050216.

Single-Molecule Tethered Particle Motion: Stepwise Analyses of Site-Specific DNA Recombination

Affiliations
Review

Single-Molecule Tethered Particle Motion: Stepwise Analyses of Site-Specific DNA Recombination

Hsiu-Fang Fan et al. Micromachines (Basel). .

Abstract

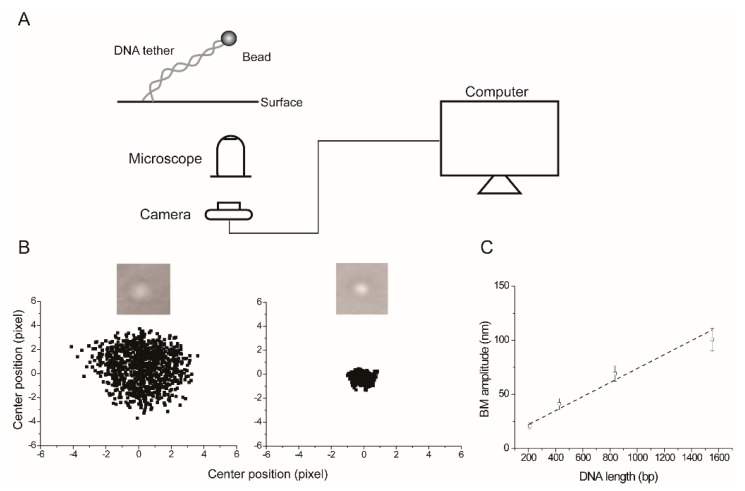
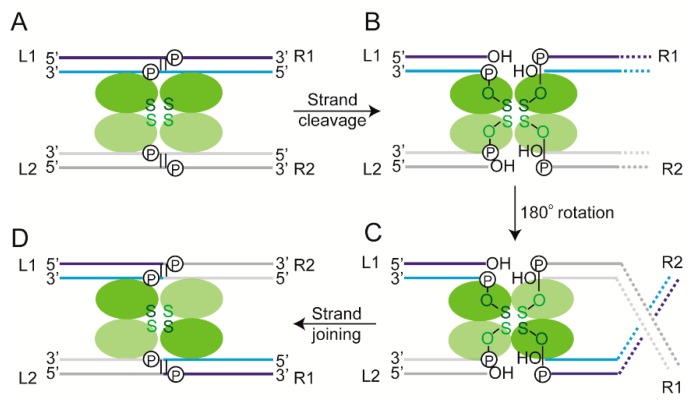
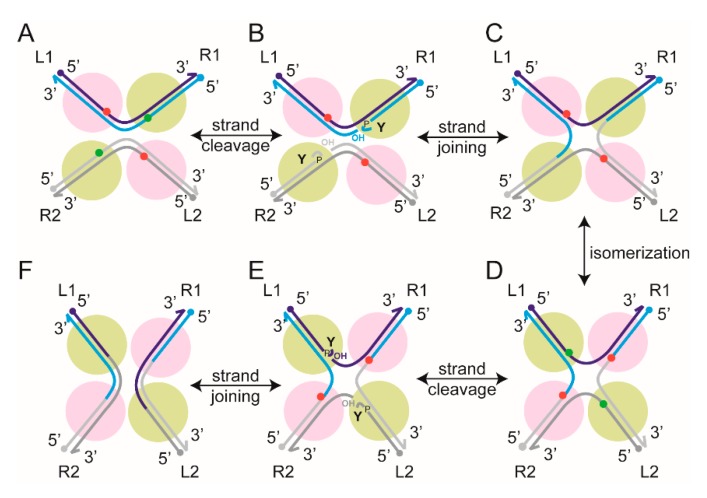
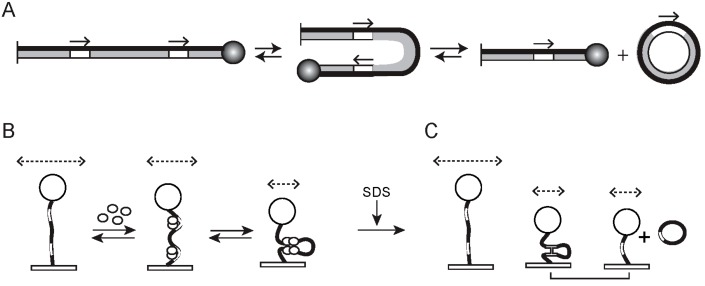
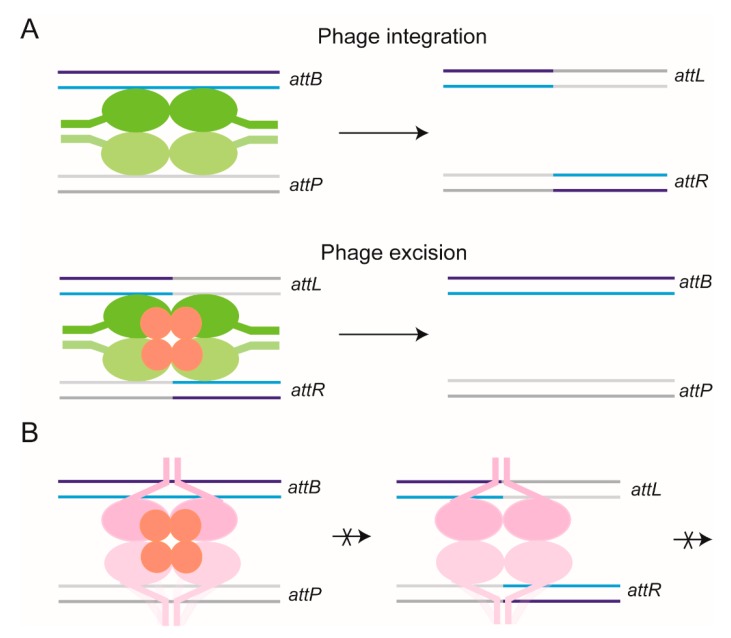
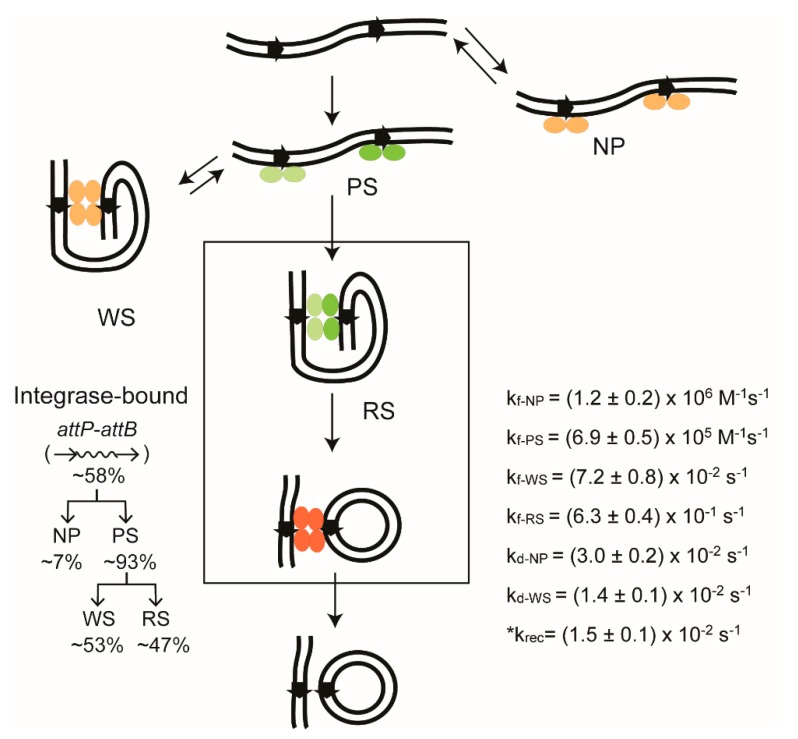
Tethered particle motion/microscopy (TPM) is a biophysical tool used to analyze changes in the effective length of a polymer, tethered at one end, under changing conditions. The tether length is measured indirectly by recording the Brownian motion amplitude of a bead attached to the other end. In the biological realm, DNA, whose interactions with proteins are often accompanied by apparent or real changes in length, has almost exclusively been the subject of TPM studies. TPM has been employed to study DNA bending, looping and wrapping, DNA compaction, high-order DNA⁻protein assembly, and protein translocation along DNA. Our TPM analyses have focused on tyrosine and serine site-specific recombinases. Their pre-chemical interactions with DNA cause reversible changes in DNA length, detectable by TPM. The chemical steps of recombination, depending on the substrate and the type of recombinase, may result in a permanent length change. Single molecule TPM time traces provide thermodynamic and kinetic information on each step of the recombination pathway. They reveal how mechanistically related recombinases may differ in their early commitment to recombination, reversibility of individual steps, and in the rate-limiting step of the reaction. They shed light on the pre-chemical roles of catalytic residues, and on the mechanisms by which accessory proteins regulate recombination directionality.

Keywords: Cre; Flp; serine recombinases; single molecule analysis; site-specific recombination; tethered particle motion; tyrosine recombinases; ϕC31integrase.


Conflict of interest statement

The authors declare no conflict of interest.

Figures

Figure 1
Figure 1
The basic set up for tethered particle motion (TPM) observation and data analysis. (A) The polymer being studied (double-stranded DNA in the vast majority of cases) is attached to a planar surface (glass coverslip). Generally, the attachment is mediated by the interaction between digoxigenin placed at one end of the DNA and an antibody to digoxigenin, with which the coverslip is coated. The other end of the DNA tagged by biotin is attached to a bead (generally polystyrene; ~200 nm in diameter) coated with streptavidin. The dynamics of the bead are observed and recorded by an optical microscope fitted with a camera, and connected to a computer. (B) The cumulative digitized bead images (from 250 frames; 33 ms for each frame) obtained in two of our experiments with two different DNA molecules are shown here to illustrate the proportionality between the range of bead movement and DNA length. The bead at the right is attached to the shorter DNA. For each frame, the center position of the bead is determined by fitting to a 2D Gaussian distribution. The scatter plots correspond to center positions for bead trajectories over a total of 1000 frames. The Brownian motion (BM) amplitude is estimated as the averaged standard deviation of the center positions along the x and y axes in consecutive 40-frame windows, with a time resolution of 1.32 s per window. (C) The estimated BM amplitudes from our experiments plotted here show their empirical relationship (approximately linear) with DNA lengths within the range of a few hundred to a few thousand bp. In the calibration curve, BM amplitude ‘A’ varies with the tether length ‘L’ in bp as A = (0.0648 × L) + 9.0683. The y-intercept is not constrained to be zero when the tether length is zero. An earlier detailed analysis suggests that the root mean square (RMS) bead displacement varies non-linearly with DNA length [5,8]. Here, the square root of the summed variances from the mean position along both the x and y directions is computed to obtain RMSt. For our purposes, a linear approximation works well. The point to note is that the correlation between bead movement and tether length underscores the utility of TPM as a simple, but effective probe for ligand interactions or biochemical reactions that result in reversible or permanent changes in DNA length.
Figure 2
Figure 2
Serine site-specific recombination. (A) During serine recombination, the two core target sites (each bound by a recombinase dimer) are brought together in an activated synapse. The dimers bound to the two sites are distinguished by coloring them in different shades of green. The green color indicates the chemically competent state of all four recombinase monomers. In the case of tyrosine recombination (shown in Figure 3), only two of the four recombinase monomers are in the ‘active’ state at a time. The two partner sites are colored differently to better illustrate the DNA rearrangement resulting from recombination. Within a DNA site, the two strands (‘top’ and ‘bottom’) are shaded dark and light, respectively. (B) The scissile phosphodiester bonds on the two strands (separated by 2 bp; marked ‘P’) are then cleaved in both partner sites. The recombinase gets attached to one end of the cleaved strand by a 5′-phosphoserine linkage. The adjacent DNA end carries a 3′-hydroxyl group. (C) The cleaved complex undergoes a 180° rotation, and is aligned in the recombinant partner configuration. The rotation between the cleavage and joining steps can be appreciated by the DNA crossing introduced as a result. The dashed lines represent DNA flanking the target sites to the right. (D) Strand joining by a chemical reversal of the cleavage step completes a round of recombination. In (AD), the left to right orientations of the partner sites are indicated as L1-R1 and L2-R2 (before recombination), and as L1-R2 and L2-R1 (after recombination). They are arranged in a parallel fashion, that is, directed the same way in the plane of the synapse. For simplicity, the figure omits accessory sites and the DNA–protein interactions occurring at such sites, which are essential for reaction by some of the serine recombinases. The color schemes for DNA strands and protein subunits are kept the same in Figures 3 and 9, depicting schematics of recombination reactions.
Figure 3
Figure 3
Tyrosine site-specific recombination. (A) Within the core recombination synapse, the partner sites (L1-R1 and L2-R2), each bound by two recombinase monomers, are arranged in an anti-parallel geometry. The bound sites have a considerably larger bend than that seen in the sites bound and synapsed by serine recombinases (see Figure 2). The scissile phosphates on the two strands are spaced farther apart (6–8 bp) than in the target sites of serine recombinases. The two scissile phosphates poised for cleavage are shown in green, with the other two in red. The two recombinase monomers responsible for the activation of the phosphates (active monomers) are shown in pale green. The ‘inactive’ ones are shown in magenta. The figure does not include accessory proteins and their interaction with cognate DNA sites required for the activity of a subset of tyrosine recombinases. (B) Single-strand cleavage within each partner results in the covalent linkage of the active site tyrosine to the 3′-phopshate, leaving an adjacent 5′-hydroxyl group as its neighbor. (C) Strand joining across partners by reversal of the cleavage chemistry produces a Holliday junction intermediate. (D) A conformational redisposition of the DNA arms within the synapse (isomerization) activates the scissile phosphates on the strands to be exchanged. The switch between the ‘active’ and ‘inactive’ Flp monomers is indicated by their change in colors (from magenta to pale green, and vice versa). (E) As depicted in (B), strand cleavage, covalent DNA–protein attachment, and exposure of the 5′-hydroxyl group follow. (F) Strand joining completes the duplex exchange to give L1-R2 and L2-R1 as recombinant products. One of the tyrosine recombinases (Cre) that we studied using TPM follows the (AF) path strictly, while the other (Flp) differs slightly in the mechanism of strand cleavage. In both cases, a scissile phosphate is activated by the adjacent recombinase monomer (pale green). In Cre, the tyrosine nucleophile for strand cleavage is also provided by the same monomer (in cis); in Flp, it is delivered by a neighboring monomer (magenta; in trans).
Figure 4
Figure 4
TPM analysis of tyrosine recombination between head-to-tail target sites. (A) The linear DNA substrate and the products of the recombination reaction are schematically drawn. The tethering surface and the polystyrene bead are shown as a short vertical line on the left and the sphere on the right, respectively. The relative orientation of the target sites is indicated by the direction of the arrows. (B) The changes in length of the DNA tether following the binding of the target sites by the recombinase and at subsequent steps of the recombination pathway are shown schematically. The relative magnitude of the BM amplitudes of the DNA–protein complexes are approximated by the lengths of the dashed, double-headed arrows drawn above the bead. The bound and bent target sites cause an apparent reduction in tether length, which is further accentuated by the synapsis of the bound sites. The exchange of one pair of strands to form the Holliday junction intermediate, or the completion of the excision reaction, will make this length reduction permanent. (C) The effect of removing the recombinase from the DNA by SDS addition is schematically illustrated. The non-synapsed molecules, as well as the synapsed molecules that failed to undergo strand exchange, will return to the starting BM amplitude of the DNA substrate, while the Holliday junction and the linear product of excision will retain their low BM amplitude state. The diagram is also applicable to serine recombination, with the following caveats. The conformational distortion or DNA bending introduced by serine recombinases is less prominent than that for tyrosine recombinases. The geometry of the sites within the activated synapse is parallel. As the strands are exchanged by a double strand break-join mechanism, no Holliday junction is formed during the reaction.
Figure 5
Figure 5
TPM analysis of tyrosine recombination between head-to-head sites. The panels (AC) are arranged as in Figure 4. Note that the outcome of the recombination is DNA inversion between the target sites, indicated by the switch in the thickness of the two strands within the inverted segment. The configuration of the looped DNA in synapsed molecules is different for head-to-head and head-to-tail sites in order to accommodate the anti-parallel arrangement of sites. Note that, following SDS addition (C), only the Holliday junction intermediate will remain in the low BM amplitude state. Unreacted molecules, as well as molecules that underwent recombination, will be indistinguishable from each other by their BM amplitudes.
Figure 6
Figure 6
Thermodynamic and kinetic information conveyed by TPM. (A) A typical time trace shown here illustrates the BM amplitude changes in a DNA substrate containing a pair of recombination target sites (in head-to-tail orientation) from ‘high’ to ‘intermediate high’ following recombinase occupancy of the sites, and to ‘low’ upon synapsis of the bound sites. (B) The top trace is representative of a molecule (with head-to-tail target sites) that bound recombinase, and went through synapsis and synapse dissociation several times without completing recombination (as shown by its return to the high amplitude state after SDS treatment). The bottom trace exemplifies a molecule that completed binding, synapsis, and Holliday junction formation or DNA excision successfully (as signified by the low BM amplitude after SDS treatment). In A and B, the stippled horizontal bar denotes the BM amplitude of the synapsed state. (C,D) From the dwell times of DNA molecules in the unbound state or as distinct recombinase-bound complexes, kinetic features of the individual steps of recombination can be derived. The histogram plots for the pre-synaptic state (PS) before conversion to wayward synaptic complexes (WS; which are abortive and dissociate), fitted to a single exponential algorithm (C), yields a first-order rate constant of (7.2 ± 0.8) × 10−2 s−1 for this step (PS → WS). From a similar analysis of the transition from pre-synaptic to recombination-competent synaptic complexes (RS; those that promote strand exchange) (D), the first-order rate constant is (6.3 ± 0.4) × 10−1 s−1 (PS → RS). (A,B) show results from our studies of Flp, a tyrosine recombinase. (C,D) depict the behavior of ϕC31 integrase (a serine recombinase) in our TPM experiments.
Figure 7
Figure 7
Stepwise view of Flp recombination by TPM. The Flp recombination pathway for the excision reaction using head-to-tail target sites, as inferred from the TPM analysis, is diagrammed. The relative amounts of the individual complexes observed from cumulative single molecule time traces, over a 30 min time course, are indicated. The kinetic constants derived from their life times are listed. The rate constants for the formation and dissociation of a complex is denoted by the subscripts ‘f’ and ‘d’, respectively. The Flp monomers within the recombination synapse are color-coded (pale green or magenta) as in Figure 3 to distinguish between the ‘active’ and ‘inactive’ pairs. All monomers within the product synapse are colored the same, but differently (orange) from those within the recombination synapse, to suggest that the product synapse may have to be reconfigured for initiating the reverse reaction. Similarly, the Flp monomers in the bound complexes that are not in the functional reaction path are shaded in pale orange. The chemical reversibility of the reaction is indicated by the long upward arrow. Rather unexpectedly, our experiments reveal completion of recombination by nearly all of the synapsed molecules. Few Holliday junction molecules are detected. NP = Nonproductive complexes; PS = Pre-synaptic complexes; RS = Recombinogenic synaptic complexes; WS = Wayward synaptic complexes; HJ, HJ* = Holliday junction isomers. The thermodynamic and kinetic features are similar for the inversion reaction from the substrate with head-to-head target sites. The rate constant for completion of recombination in the RS-complexes, krec, is marked by an asterisk to indicate that it was derived from the inversion reaction.
Figure 8
Figure 8
Geometry of target site alignment within the tyrosine recombination synapse inferred from TPM. The schematic diagram illustrates the configurations of the DNA tether when the recombinase-bound sites align themselves in parallel (P) or anti-parallel (AP) geometry within the planar recombination synapse. The head-to-tail (deletion) and head-to-head (inversion) substrates, and their synapsed states, are shown in the left and right panels, respectively. The mean BM amplitudes, tabulated below, are from the TPM analyses of the tyrosine recombinases Cre and Flp. There is a small, but significant increase in the BM amplitude of synapsed head-to-head sites when compared with head-to-tail sites for both Cre and Flp. The higher value is consistent with anti-parallel synapse, as the DNA tether is expected to experience a lower constraint when it enters and exits the synapse from opposite ends, rather than from the same end. This inferred synapse geometry conforms to evidence from other analyses, and is complied within the schematic diagrams in Figure 3, Figure 4 and Figure 5.
Figure 9
Figure 9
Regulation of directionality during recombination mediated by ϕC31 integrase. In the schematic representations of attP × attB and attL × attR recombination reactions, the active and inactive forms of the integrase dimer are colored green and magenta, respectively. The dimers bound to the two target sites are differentiated by their dark and light shades. (A) Integrase forms a functional synapse with attP–attB partner sites, and catalyzes recombination between them. In vivo, attP × attB recombination results in the integration of the ϕC31 phage into the host chromosome. The prophage is flanked by attL and attR sites. The attL and attR sites are also targets for recombination by the integrase, assisted by the recombination directionality factor (RDF) protein (colored red). (B) The attP × attB reaction is inhibited by RDF, while the attL × attR reaction fails to occur in the absence of RDF. The active and inactive configurations of the synapse appear to be regulated by the interactions of the coiled coil (CC) domains present within the carboxyl-terminal portion of integrase. RDF interaction with the DNA-bound integrase apparently induces alternative synaptic configurations for attL–attR sites (active; A) and attP–attB sites (inactive; B). The CC domains are drawn as short extensions from the main body of the integrase.
Figure 10
Figure 10
TPM picture of recombination by ϕC31 integrase from start to finish. The diagram is arranged as in Figure 7, and depicts the reaction between head-to-tail attP–attB sites by the integrase in the absence of the RDF protein. The productive and abortive integrase–DNA complexes are named as in Figure 7. The integrase dimers in the functional reaction path are shown in green, and those external to this path are shown in pale orange. In the product synapse containing attL and attR, the dimers are shown in orange to indicate that attL–attR recombination does not occur in the absence of RDF. The relative abundance of individual complexes is indicated, and the kinetic constants for their transitions are listed. There is no Holliday junction intermediate in this reaction. The attP–attB reaction is blocked in the presence of RDF in amounts sufficient to channel the synapse quantitatively into its inactive configuration. Similar reactions schemes with kinetic parameters have been derived for inversion between head-to-head attP–attB sites promoted by the integrase, and for deletion between head-to-tail attL–attR sites promoted by integrase plus RDF. The details can be found in Fan et al. [43]. The rate constant for recombination krec, marked by an asterisk, was derived from the inversion reaction between attP–attB sites in head-to-head orientation.

References

    1. Finzi L., Dunlap D.D. Single-molecule approaches to probe the structure, kinetics, and thermodynamics of nucleoprotein complexes that regulate transcription. J. Biol. Chem. 2010;285:18973–18978. doi: 10.1074/jbc.R109.062612. - DOI - PMC - PubMed
    1. Kapanidis A.N., Strick T. Biology, one molecule at a time. Trends Biochem. Sci. 2009;34:234–243. doi: 10.1016/j.tibs.2009.01.008. - DOI - PubMed
    1. Kovari D.T., Yan Y., Finzi L., Dunlap D. Tethered Particle Motion: An easy technique for probing DNA topology and interactions with transcription factors. In: Peterman E.J.G., editor. Single Molecule Analysis: Methods and Protocols, Methos in Molecular Biology. Volume 1665. Springer + Business Media LLC; New York, NY, USA: 2018. pp. 5–17. - PMC - PubMed
    1. Newby Lambert M., Vocker E., Blumberg S., Redemann S., Gajraj A., Meiners J.C., Walter N.G. Mg2+-induced compaction of single RNA molecules monitored by tethered particle microscopy. Biophys. J. 2006;90:3672–3685. doi: 10.1529/biophysj.105.067793. - DOI - PMC - PubMed
    1. Han L., Lui B.H., Blumberg S., Beausang J.F., Nelson P.C., Phillips R. Mathematics of DNA Structure, Function and Interactions (Dedicated to Nick Cozzarelli) Springer; New York, NY, USA: 2007. Calibration of tethered particle motion experiments.

LinkOut - more resources