. 2018 Nov 12;9(11):587.
doi: 10.3390/mi9110587.

Characterizing Longitudinal Changes in the Impedance Spectra of In-Vivo Peripheral Nerve Electrodes

Affiliations

Characterizing Longitudinal Changes in the Impedance Spectra of In-Vivo Peripheral Nerve Electrodes

Malgorzata M Straka et al. Micromachines (Basel). .

Abstract

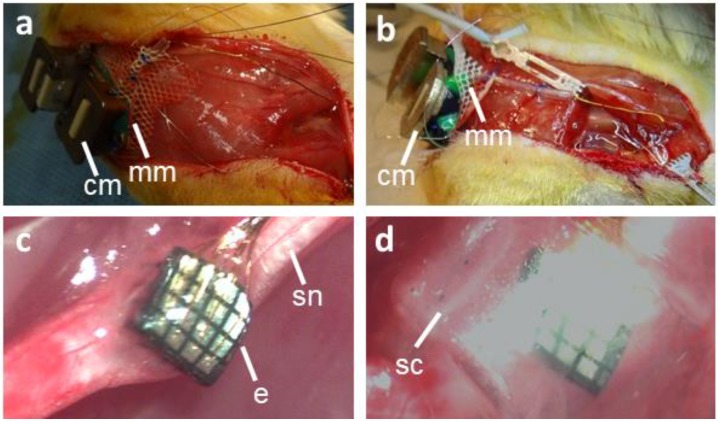
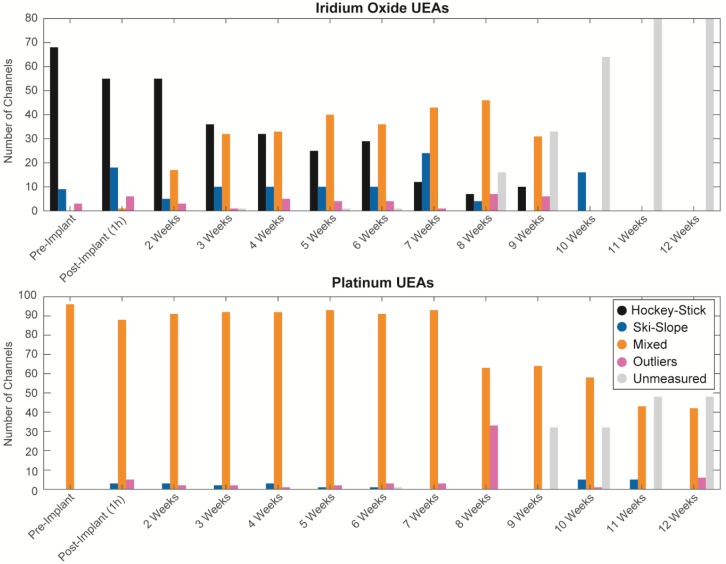
Characterizing the aging processes of electrodes in vivo is essential in order to elucidate the changes of the electrode⁻tissue interface and the device. However, commonly used impedance measurements at 1 kHz are insufficient for determining electrode viability, with measurements being prone to false positives. We implanted cohorts of five iridium oxide (IrOx) and six platinum (Pt) Utah arrays into the sciatic nerve of rats, and collected the electrochemical impedance spectroscopy (EIS) up to 12 weeks or until array failure. We developed a method to classify the shapes of the magnitude and phase spectra, and correlated the classifications to circuit models and electrochemical processes at the interface likely responsible. We found categories of EIS characteristic of iridium oxide tip metallization, platinum tip metallization, tip metal degradation, encapsulation degradation, and wire breakage in the lead. We also fitted the impedance spectra as features to a fine-Gaussian support vector machine (SVM) algorithm for both IrOx and Pt tipped arrays, with a prediction accuracy for categories of 95% and 99%, respectively. Together, this suggests that these simple and computationally efficient algorithms are sufficient to explain the majority of variance across a wide range of EIS data describing Utah arrays. These categories were assessed over time, providing insights into the degradation and failure mechanisms for both the electrode⁻tissue interface and wire bundle. Methods developed in this study will allow for a better understanding of how EIS can characterize the physical changes to electrodes in vivo.

Keywords: Utah electrode arrays; electrode–tissue interface; impedance; peripheral nerves.


Conflict of interest statement

The authors declare no conflict of interest. The funders had no role in the design of the study; in the collection, analyses, or interpretation of data; in the writing of the manuscript; or in the decision to publish the results.

Figures

Figure 1
Figure 1
Surgical procedure for the implantation of a nerve electrode array. (a) Bronze infused stainless-steel connector mount secured to the lumbar fascia. (b) Two-part connector mount secured to the lumbar fascia. (c) Electrode array implanted into the sciatic nerve. (d) Silicone cuff used to secure the electrode array inside the sciatic nerve. cm—connector mount; mm—mersilene mesh, e—electrode array, sn—sciatic nerve; sc—silicone cuff.
Figure 2
Figure 2
PlotEISGUI with a sample of the iridium oxide Utah electrode array (UEA). In the left plot, the magnitude spectra are plotted for all 16 channels. In the figures on the right, the spectra are divided based on the categories, where Groups 1–3 are the hockey-stick, ski-slope, and mixed groups, respectively.
Figure 3
Figure 3
Impedance spectra were classified into groups based on the characteristics of the magnitude and phases. Examples of groups are shown along with categorization criteria (grey boxes; see Section 2.4). Note that the y-axis for outliers is scaled to include much higher magnitudes.
Figure 4
Figure 4
The Randles equivalence circuit used to model an electrode in solution (a). The solution resistance, RS, is in series with the elements denoting the electrode–electrolyte interface, including the electrode transfer resistance, RE, and the admittance of the constant phase element (CPE), Q. Elements have different contributions to the impedance spectra (b), as highlighted by examples classified as hockey-stick (left) and ski-slope (right). In addition to the electrode CPE, Q, and access resistance, RS, parasitic shunt resistance may also be present at low frequencies, as well as coupling through a dielectric capacitance at high frequencies.
Figure 5
Figure 5
Confusion matrices of the trained SVM algorithm for the iridium oxide (left) and platinum arrays (right). The numbers refer to the data points within the impedance spectrum, with each spectrum consisting of 31 frequencies collected per channel for each point in time.
Figure 6
Figure 6
Impedance at 1 kHz for iridium oxide (left) and platinum (right) arrays vary per group. The mean and standard error of mean (SEM) can be seen at all timepoints (a), and the boxplots show the medians for all of the timepoints after implantation (i.e., 1 h through site failure) (b) (* refers to p < 3 × 10⁻⁴, and ** p < 1 × 10⁻¹³, after the Holm–Bonferroni correction).
Figure 7
Figure 7
Boxplots of fit Randles equation fit values for in vivo impedance spectra. Boxplots show median values, and comparisons were tested with Wilcoxon sign-rank tests (* refers to p < 3 × 10⁻⁴, ** p < 8 × 10⁻¹¹, after a Holm–Bonferroni correction). Note that the upper bound of RE values were 1 × 10¹¹ Ω, as a result of limitations of the Gamry instrument.
Figure 8
Figure 8
Summary of population changes for groups over time for iridium oxide (top) and platinum (bottom) arrays. After the failure of all sites in an array, the impedance spectra were no longer collected and are designated as unmeasured.
Figure 9
Figure 9
Mean magnitude and phase spectra for iridium oxide (ac) and platinum (d,e) UEAs (shaded areas are SEM) over time.

References

    1. Franks W., Schenker I., Schmutz P., Hierlemann A. Impedance Characterization and Modeling of Electrodes for Biomedical Applications. IEEE Trans. Biomed. Eng. 2005;52:1295–1302. doi: 10.1109/TBME.2005.847523. - DOI - PubMed
    1. Mercanzini A., Colin P., Bensadoun J.-C., Bertsch A., Renaud P. In Vivo Electrical Impedance Spectroscopy of Tissue Reaction to Microelectrode Arrays. IEEE Trans. Biomed. Eng. 2009;56:1909–1918. doi: 10.1109/TBME.2009.2018457. - DOI - PubMed
    1. Prasad A., Xue Q.-S., Dieme R., Sankar V., Mayrand R.C., Nishida T., Streit W.J., Sanchez J.C. Abiotic-Biotic Characterization of Pt/Ir Microelectrode Arrays in Chronic Implants. Front. Neuroeng. 2014;7:2. doi: 10.3389/fneng.2014.00002. - DOI - PMC - PubMed
    1. Caldwell R., Sharma R., Takmakov P., Street M.G., Solzbacher F., Tathireddy P., Rieth L. Neural Electrode Resilience against Dielectric Damage May Be Improved by Use of Highly Doped Silicon as a Conductive Material. J. Neurosci. Methods. 2018;293:210–225. doi: 10.1016/j.jneumeth.2017.10.002. - DOI - PubMed
    1. Rousche P.J., Normann R.A. Chronic Recording Capability of the Utah Intracortical Electrode Array in Cat Sensory Cortex. J. Neurosci. Methods. 1998;82:1–15. doi: 10.1016/S0165-0270(98)00031-4. - DOI - PubMed

LinkOut - more resources