. 2019 Jan;7(1):62-76.
doi: 10.1158/2326-6066.CIR-18-0424. Epub 2018 Nov 13.

Mapping the MHC Class I-Spliced Immunopeptidome of Cancer Cells

Affiliations

Mapping the MHC Class I-Spliced Immunopeptidome of Cancer Cells

Juliane Liepe et al. Cancer Immunol Res. 2019 Jan.

Abstract

Anticancer immunotherapies demand optimal epitope targets, which could include proteasome-generated spliced peptides if tumor cells were to present them. Here, we show that spliced peptides are widely presented by MHC class I molecules of colon and breast carcinoma cell lines. The peptides derive from hot spots within antigens and enlarge the antigen coverage. Spliced peptides also represent a large number of antigens that would otherwise be neglected by patrolling T cells. These antigens tend to be long, hydrophobic, and basic. Thus, spliced peptides can be a key to identifying targets in an enlarged pool of antigens associated with cancer.


Conflict of interest statement

Disclosure of Potential Conflicts of Interest

No potential conflicts of interest were disclosed.

Figures
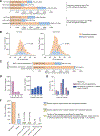
Figure 1.
Figure 1.
Size of the MHC-I–spliced and nonspliced immunopeptidomes of colon and breast carcinoma cell lines and related controls. A, Number of spliced and nonspliced peptides identified in the MHC-I immunopeptidomes of HCT116 and HCC1143 cell lines, as well as their combined dataset. In the top plot, we report the absolute and relative frequency of spliced and nonspliced peptides considering the mutations detected in the two cell lines and several PTMs. The latter were allowed only for the nonspliced peptide database. However, we report here the absolute and relative frequency of nonspliced peptides not posttranslationally modified to be comparable to spliced peptides (also not carrying PTM). In the bottom plot, we report the absolute and relative frequency of spliced and nonspliced peptides not considering the mutations detected in the two cell lines and PTMs. B, Distribution of the MS ion peak area of spliced and nonspliced peptides in the HCT116 and HCC1143 immunopeptidomes measured by label-free quantification. The MS ion peak area distribution of the nonspliced peptides is significantly larger than the distribution of spliced peptides in both immunopeptidomes (Kolmogorov–Smirnov test; HCC1143 P value: 0.00156; HCT116 P value: 0.03). The total abundance of spliced peptides calculated from the integral of the MS ion peak areas of spliced peptides relative to the integral of the peak area of all peptides is reported. The number of identified peptides and the MS ion peak area correlates significantly with the number of biological replicates in which they are identified (see Supplementary Fig. S3B–S3E). C, Frequency of spliced and nonspliced peptides detected in the LysC-trypsin digestion of the HCC1143 intracellular proteasome-unprocessed proteome. Proteins larger than 30 kDa have been separated from the cell lysate of the HCC1143 cell line—to eliminate protein fragments already produced by proteasome—and digested by LysC and trypsin. The resulting sample has been analyzed by MS using the same data analysis strategy used for the MHC-I immunopeptidomes. Shown are the number and frequencies of spliced and nonspliced peptides assigned in the LysC/trypsin-processed proteome dataset (n = 1). D, Comparison of peptide length distribution identified in the HCC1143 immunopeptidome (left) and the LysC/trypsin-processed intracellular proteome (right). E, Comparison of the detected precursor charge distribution of the HCC1143 immunopeptidome and the LysC/trypsin-processed intracellular proteome. F, Frequency of detected semi-inverted spliced peptides (green/yellow) compared with frequency of nonspliced and spliced target peptides identified in one technical replicate of the HCT116 immunopeptidome. Indicated percentages are relative to the total number of peptides assigned in each experiment. The frequency of identification of semi-inverted spliced peptides is an estimation of the frequency of wrongly annotated spliced and nonspliced peptide sequences. Yellow indicated fractions are semi-inverted peptide sequences, which could also be explained as target cis-spliced peptides with intervening sequence length longer than 25 residues (see Materials and Methods).
Figure 2.
Figure 2.
Sequence motifs of the MHC-I–spliced and nonspliced immunopeptidome of the colon carcinoma cell line. A, Distribution of the distances within the cluster of nonspliced peptides (orange line), between spliced and nonspliced peptides (blue line), and between nonspliced peptides and control random peptides (gray line) in the four clusters of the spliced and nonspliced peptides identified in the MHC-I immunopeptidome of the HCT116 cell line. The bottom plot shows the Kolmogorov–Smirnov distance between the distributions of nonspliced and spliced peptides and control peptides, respectively, which are significantly different (Kolmogorov–Smirnov test; P value = 0.03). B, Comparison of the amino acid frequencies for each position of the nonspliced and spliced 9-mer peptides of the HCT116 MHC-I immunopeptidome, after clustering according to their amino acid features. For each of the four clusters, amino acid frequencies are shown on the left. The size of the amino acid letters corresponds to their occurrence within the cluster. The number of peptides belonging to each cluster and their relative frequency are also reported. On the right, the motifs' difference between the amino acid frequencies of the nonspliced and spliced 9-mer peptides is reported as Jensen–Shannon (JS) divergence. The inlets on the top of the right plots show the frequency of PCPS (as P1 position) for each residue. The HLA-I alleles corresponding to each cluster are reported, and they have been identified by similarities with known HLA-I–specific peptide sequence motifs.
Figure 3.
Figure 3.
PCPS enlarges the antigenic landscape of the two cancer cell lines. Data refer to the peptides identified in the MHC-I immunopeptidomes of the HCT116 and HCC1143 cell lines, which is reported as a combined analysis of the two datasets in A and B. A, Number of antigens represented by only spliced peptides, by only nonspliced peptides, or by both in the immunopeptidome. B, Number and frequency of sequences that are present in the immunopeptidomes and that derive from antigens also detected in the cancer cell line transcriptomes (21), considering separately antigens represented by spliced or nonspliced peptides. C, Prevalence of HCT116 and HCC1143 mutated proteins represented (or not represented) on MHC-I complexes by either spliced peptides, nonspliced peptides, or both. The frequencies refer to either proteins that were detected at the RNA level and have missense mutations (left) or proteins that were detected at the RNA level regardless of their mutational load (right). D and E, 3D structures of the antigens CHMP7 (D) and RBBP7 (E), from which 5 nonspliced peptides were identified in the HCT116 immunopeptidome, including the two nonspliced neoepitopes CHMP7[A324T]316–325 and RBBP7[N17D]12–20. The structures were predicted using i-Tasser server. The nonspliced peptides (including the nonspliced neoepitopes) are labeled in orange.
Figure 4.
Figure 4.
Relationship between antigen length, abundance, and half-life detected in the cancer cell lines and their probability of representation as MHC-I–spliced peptides. Data refer to the antigenic peptides identified in the MHC-I immunopeptidomes of the HCT116 and HCC1143 (here reported as a combined analysis of the two datasets). A, Correlation between the number of spliced or nonspliced peptides detected in the immunopeptidomes and the antigen length (nonspliced peptides: C = 0.15, P < 10–16; spliced peptides: C = 0.15, P < 10–16). B, Correlation between the number of spliced (light blue dots) or nonspliced (orange dots) peptides per antigen and the antigen abundance as measured by Bassani-Sternberg et al. (19) in the cell lysates. Dark blue lines and red lines indicate a running average of the peptide numbers over the antigen abundance. Both the number of spliced and nonspliced peptides is correlated with antigen abundance (nonspliced: C = 0.7, P < 10–16; spliced peptides: C = 0.4, P = < 10–16). In A and B, the Y-axis is in log scale. C, Relationship between the number of theoretically possible 9-mer spliced or nonspliced peptides, respectively, and the antigen length. The number of nonspliced peptides has been computed as N = antigen length – 8 (red line). The number of unique spliced peptides in the human proteome spliced peptide database was counted and could be approximated by linear regression (dark blue line) with n = 399.12 × antigen length – 7948.4 (P < 10–16 for both estimated parameters using linear regression in R). The dashed green line indicates the ratio of the number of spliced peptides over the number of nonspliced peptides, which asymptotically reaches 398 for antigens longer than 500 amino acids. D, Correlation between the MHC-I peptide sampling probability (D) and the antigen intensity measured in the intracellular proteome (19). E, Correlation between the spliced peptide sampling density and the nonspliced peptide sampling density (C = 0.7, P < 10–16). F, Relationship between the fold over representation (D/D' ) and the antigen half-life, using half-lives based on Boisvert et al. (31) or McShane et al. (32). Only antigens identified in the intracellular proteome of the HCT116 and HCC1143 cell lines by Bassani-Sternberg et al. (19) have been included here.
Figure 5.
Figure 5.
Spliced peptides broaden the antigens' coverage of tumor and nontumor cell lines and locally cluster with nonspliced peptides in antigen hotspots. The values refer to the extended human MHC-I self-immunopeptidome, which includes the immunopeptidomes of HCT116 and HCC1143 cancer cell lines, and GR-LCL. A, Number of antigens represented by only spliced peptides, only nonspliced peptides, or both. Among all identified antigens, 1,096 antigens are represented by 1,197 unique spliced peptides, 3,850 antigens are represented by 6,987 nonspliced peptides, and 910 antigens are represented by both spliced (n = 1,095) and nonspliced (n = 2,481) peptides. B, Frequency of nonspliced peptides, spliced peptides, or any peptide per antigen. C, Coverage of the antigen sequences by either nonspliced peptides, spliced peptides, or both considering a 25- or 50-residue window, respectively. D, Distribution of the number of antigenic peptides (nonspliced, spliced or both) per window (using a 50-residue window). Percentage represents antigen coverage. E, Measured distance between either nonspliced peptides, spliced peptides, or between spliced and nonspliced peptides. The red lines represent the respective random distributions, for which no local clustering can be observed and which significantly differs from the distribution of the distance of the peptides identified in the MHC-I immunopeptidomes (Mann–Whitney test P values are shown).
Figure 6.
Figure 6.
Antigens represented by either spliced or nonspliced peptides have different characteristics. The values refer to the extended human MHC-I self-immunopeptidome, which includes the immunopeptidomes of HCT116 and HCC1143 cancer cell lines, and GR-LCL. A, Correlation between the average hydrophobicity and length for the antigens represented by nonspliced peptides (tan line), spliced peptides (blue line), or both (gray line), and antigens not represented in the extended MHC-I self-immunopeptidome (black line). Running averages are shown. B, Correlation between the average IP and length for antigens represented by nonspliced peptides (tan line), spliced peptides (blue line), or both (gray line), and antigens not represented in the extended MHC-I self-immunopeptidome (black line). Running averages are shown. C, Distributions of computed IPs for all antigens represented by either nonspliced peptides, spliced peptides, or both. All three groups show trimodal distributions (gray histograms), which could be approximated as a Gaussian mixture model (black line) consisting of three Gaussian distributions with differing mean and standard deviations (red, yellow, and green lines). The two Gaussian distributions with average IP < 7 (red and yellow lines) include the acidic set of antigens, whereas the Gaussian distribution with average IP > 7 (green lines) include the set of basic antigens. D, IP bias (isoelectric point bias) for antigens represented by either nonspliced peptides, spliced peptides, or both. The IP bias is the proportion of antigens that fall into the basic set compared with the acidic set (color scheme corresponds to C).

References

    1. Rosenberg SA, Restifo NP. Adoptive cell transfer as personalized immunotherapy for human cancer. Science 2015;348:62–8. - PMC - PubMed
    1. Coulie PG, Van den Eynde BJ, van der Bruggen P, Boon T. Tumour antigens recognized by T lymphocytes: at the core of cancer immunotherapy. Nat Rev Cancer 2014;14:135–46. - PubMed
    1. Liepe J, Ovaa H, Mishto M. Why do proteases mess up with antigen presentation by re-shuffling antigen sequences? Curr Opin Immunol 2018;52:81–6. - PubMed
    1. Vigneron N, Stroobant V, Chapiro J, Ooms A, Degiovanni G, Morel S, et al. An antigenic peptide produced by peptide splicing in the proteasome. Science 2004;304:587–90. - PubMed
    1. Liepe J, Mishto M, Textoris-Taube K, Janek K, Keller C, Henklein P, et al. The 20S proteasome splicing activity discovered by SpliceMet. PLOS Comput Biol 2010;6:e1000830. - PMC - PubMed

Publication types