. 2018 Nov 13;9(1):4768.
doi: 10.1038/s41467-018-07165-2.

A web server for comparative analysis of single-cell RNA-seq data

Affiliations

A web server for comparative analysis of single-cell RNA-seq data

Amir Alavi et al. Nat Commun. .

Abstract

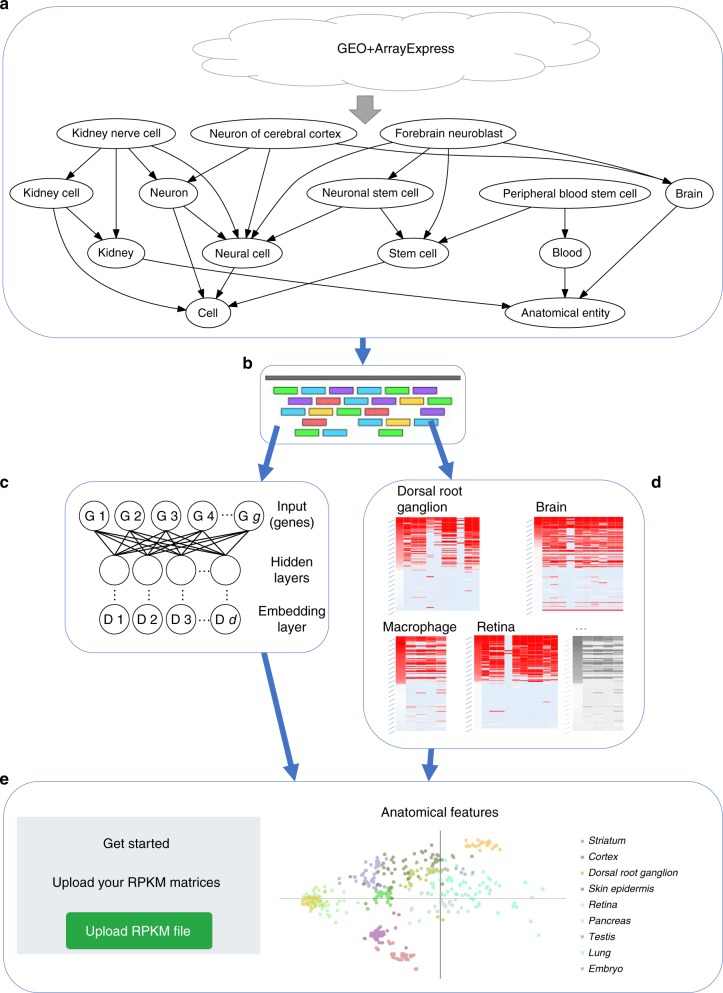
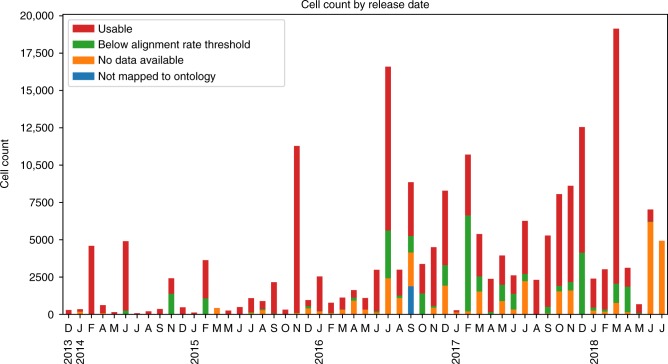
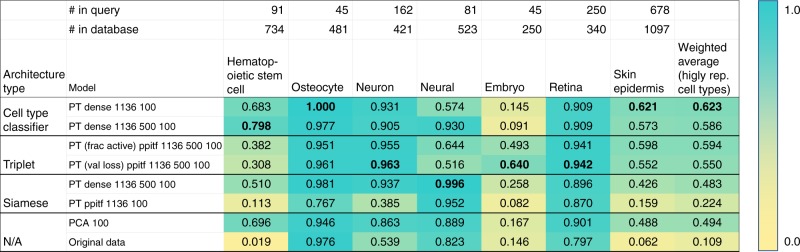
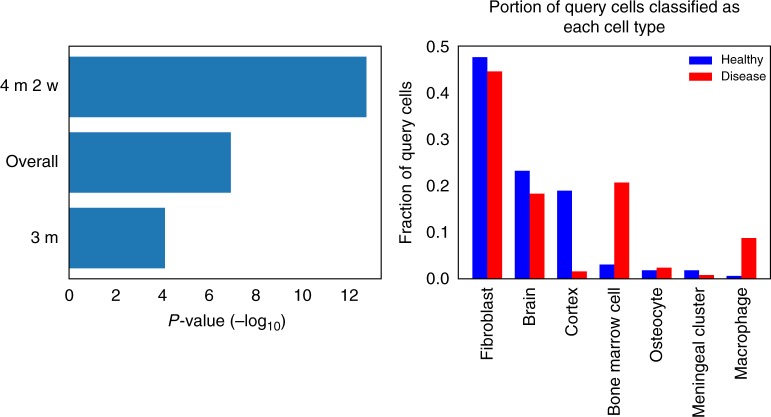
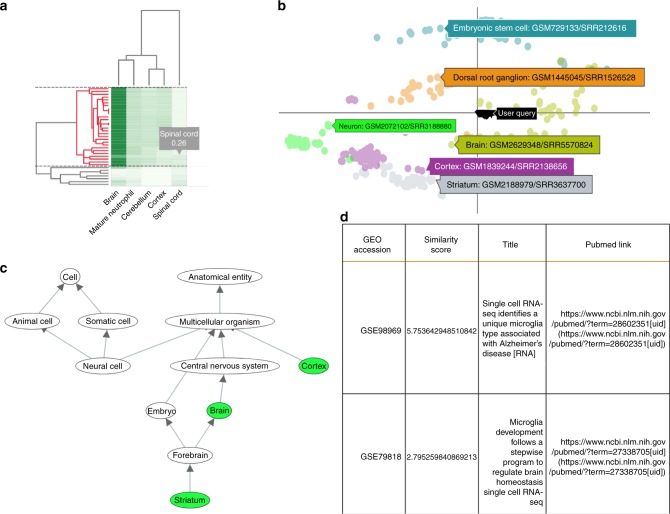
Single cell RNA-Seq (scRNA-seq) studies profile thousands of cells in heterogeneous environments. Current methods for characterizing cells perform unsupervised analysis followed by assignment using a small set of known marker genes. Such approaches are limited to a few, well characterized cell types. We developed an automated pipeline to download, process, and annotate publicly available scRNA-seq datasets to enable large scale supervised characterization. We extend supervised neural networks to obtain efficient and accurate representations for scRNA-seq data. We apply our pipeline to analyze data from over 500 different studies with over 300 unique cell types and show that supervised methods outperform unsupervised methods for cell type identification. A case study highlights the usefulness of these methods for comparing cell type distributions in healthy and diseased mice. Finally, we present scQuery, a web server which uses our neural networks and fast matching methods to determine cell types, key genes, and more.


Conflict of interest statement

The authors declare no competing interests.

Figures

Fig. 1
Fig. 1
Pipeline for large-scale, automated analysis of scRNA-seq data. a Bi-weekly querying of GEO and ArrayExpress to download the latest data, followed by automatic label inference by mapping to the Cell Ontology. b Uniform alignment of all datasets using HISAT2, followed by quantification to obtain RPKM values. c Supervised dimensionality reduction using our neural embedding models. d Identification of cell-type-specific gene lists using differential expression analysis. e Integration of data and methods into a publicly available web application
Fig. 2
Fig. 2
Monthly cell count available on GEO and ArrayExpress. Cell counts by month, separated into four categories: usable, below our alignment rate threshold, no raw or author-processed data available, and unmapped to ontology terms
Fig. 3
Fig. 3
Neural embedding retrieval testing results. Retrieval testing results of various architectures, as well as PCA and the original (unreduced) expression data. Scores are MAFP (mean average flexible precision) values (Supporting Methods). “PT” indicates that the model had been pretrained using the unsupervised strategy (Supporting Methods). “Ppitf” refers to architectures based on protein–protien and protein–DNA interactions (Supporting Methods, Supplementary Fig. 12). Numbers after the model name indicate the hidden layer sizes. For example, “dense 1136 500 100” is an architecture with three hidden layers. The metrics in parenthesis for the triplet architectures indicate the metric used to select the best weights over the training epochs. For example, “frac active” indicates that the weights chosen for that model were the ones that had the lowest fraction of active triplets in each mini-batch. We highlight the best performing model in each cell type with a bolded value. We can see that in every column, the best model is always one of our neural embedding models. The final column shows the weighted average score over those cell types, where the weights are the number of such cells in the query set. The best neural embedding model (PT dense 1136 100, top row) outperformed PCA 100 (0.623 vs. 0.494) with a p-value of 1.253 × 10−41 based on two-tailed t-test. Source data are provided as a Source Data file
Fig. 4
Fig. 4
Analysis of mouse neurodegeneration dataset, late-response cells. a p-Values of the difference in cell-type classification distributions (healthy vs. disease cells) for different time points. Three months was the initial time point in the study, and 4 months 2 weeks was the last time point. “Overall” is the pool of all 1990 cells. The p-values are from conducting Fisher’s exact test (for “overall”, the p-value was simulated based on 1×10⁷ replicates). b Classification distribution for late-stage cells (4 months 2 weeks), showing an increase in immune-related cell types in the disease cell population
Fig. 5
Fig. 5
The scQuery web server. a Cluster heatmap of the nearest neighbor results for a query consisting of 40 “brain” and 10 “spinal cord” cells. The horizontal dashed lines demarcate the currently selected cluster and the corresponding dendrogram sub-cluster is highlighted in red. b 2D scatter plot of the selected sub-cluster (shown as inverted triangles and tagged as “User Query”) along with a handful of other cell types whose tags show cell-type information and GEO submission ids for a single cell from each cluster. c Ontology DAG depicting the retrieved cell types in green while the nodes in gray visualize the path to the root nodes (which reflects paths of cellular differentiation as well as other biological relationships). d Metadata table for the retrieved hits displaying the GEO accession id, similarity score, publication titles, and their respective pubmed links

References

    1. Kolodziejczyk A, Kim JK, Svensson V, Marioni J, Teichmann S. The technology and biology of single-cell rna sequencing. Mol. Cell. 2015;58:610–620. doi: 10.1016/j.molcel.2015.04.005. - DOI - PubMed
    1. Wills QF, et al. Single-cell gene expression analysis reveals genetic associations masked in whole-tissue experiments. Nat. Biotechnol. 2013;31:748–752. doi: 10.1038/nbt.2642. - DOI - PubMed
    1. Zeisel A, et al. Cell types in the mouse cortex and hippocampus revealed by single-cell rna-seq. Science. 2015;347:1138–1142. doi: 10.1126/science.aaa1934. - DOI - PubMed
    1. Patel A. P., Tirosh I., Trombetta J. J., Shalek A. K., Gillespie S. M., Wakimoto H., Cahill D. P., Nahed B. V., Curry W. T., Martuza R. L., Louis D. N., Rozenblatt-Rosen O., Suva M. L., Regev A., Bernstein B. E. Single-cell RNA-seq highlights intratumoral heterogeneity in primary glioblastoma. Science. 2014;344(6190):1396–1401. doi: 10.1126/science.1254257. - DOI - PMC - PubMed
    1. Lescroart Fabienne, Wang Xiaonan, Lin Xionghui, Swedlund Benjamin, Gargouri Souhir, Sànchez-Dànes Adriana, Moignard Victoria, Dubois Christine, Paulissen Catherine, Kinston Sarah, Göttgens Berthold, Blanpain Cédric. Defining the earliest step of cardiovascular lineage segregation by single-cell RNA-seq. Science. 2018;359(6380):1177–1181. doi: 10.1126/science.aao4174. - DOI - PMC - PubMed

Publication types