. 2018 Nov 13;8(1):16717.
doi: 10.1038/s41598-018-34560-y.

An ultra-compact integrated system for brain activity recording and stimulation validated over cortical slow oscillations in vivo and in vitro

Affiliations

An ultra-compact integrated system for brain activity recording and stimulation validated over cortical slow oscillations in vivo and in vitro

Luca Pazzini et al. Sci Rep. .

Abstract

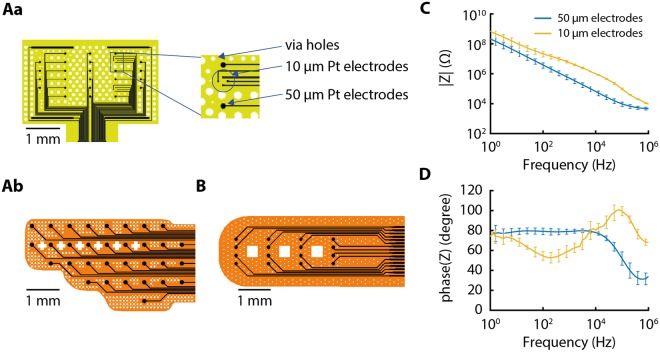
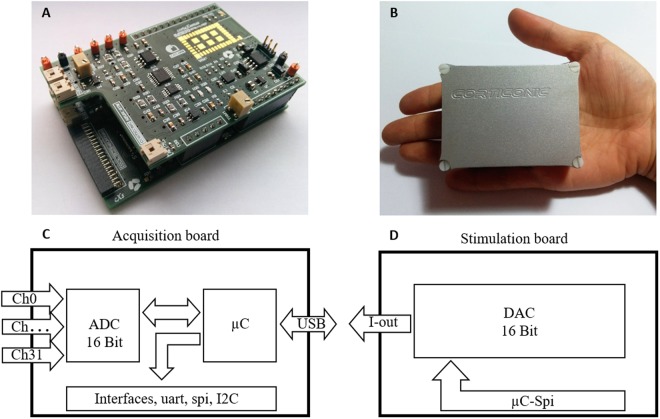
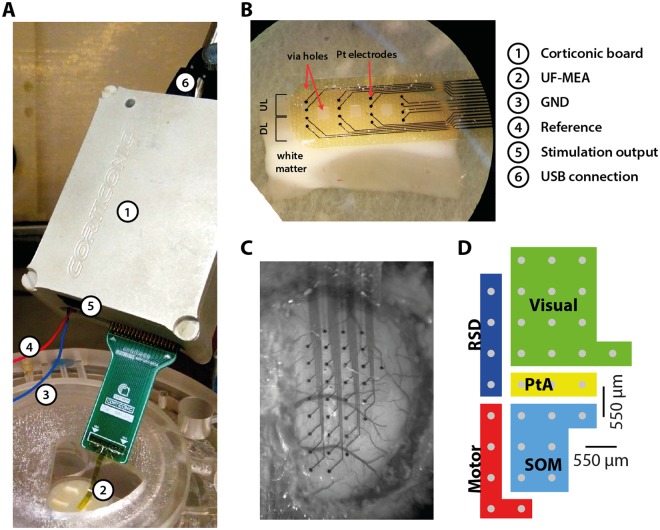
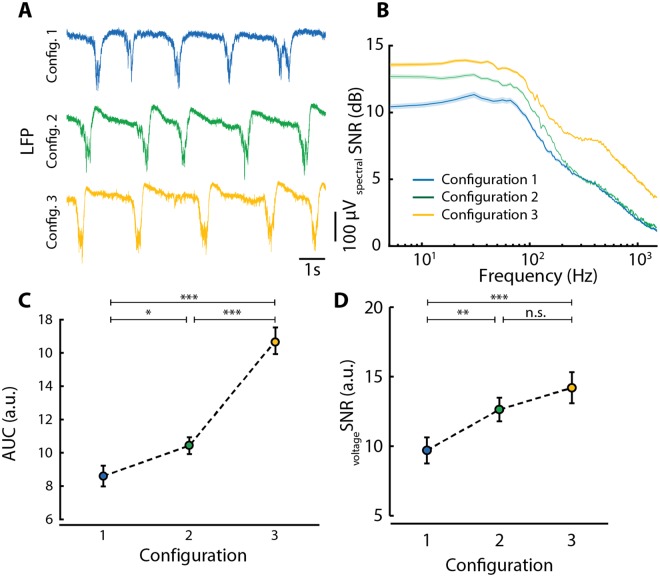
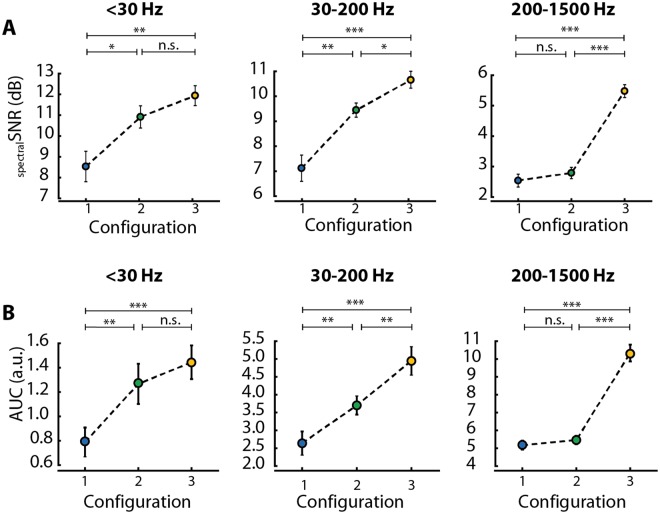
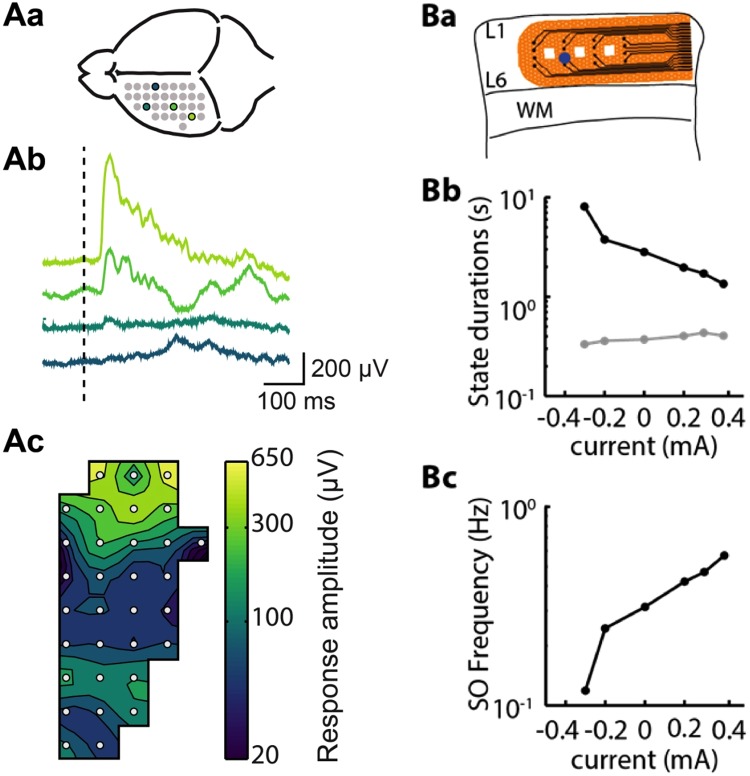
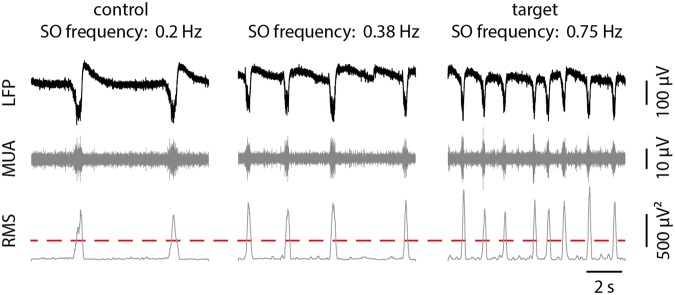
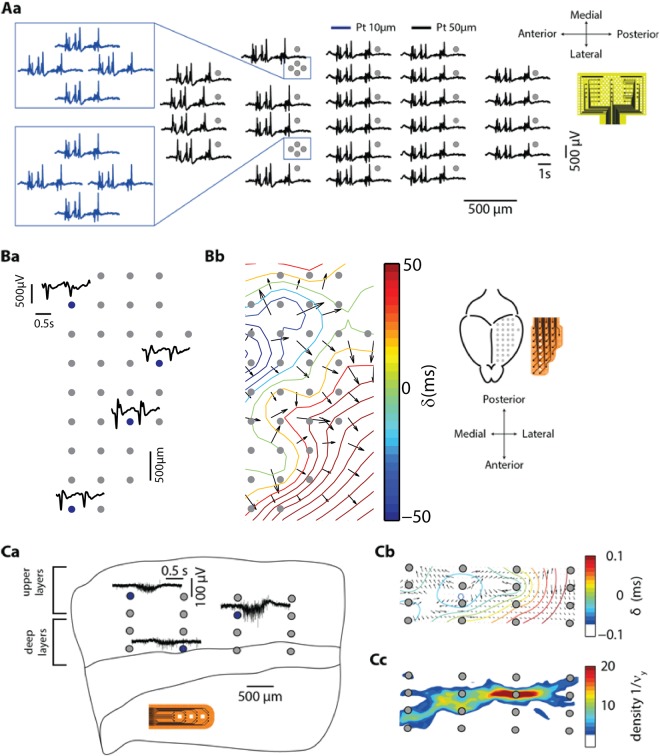
The understanding of brain processing requires monitoring and exogenous modulation of neuronal ensembles. To this end, it is critical to implement equipment that ideally provides highly accurate, low latency recording and stimulation capabilities, that is functional for different experimental preparations and that is highly compact and mobile. To address these requirements, we designed a small ultra-flexible multielectrode array and combined it with an ultra-compact electronic system. The device consists of a polyimide microelectrode array (8 µm thick and with electrodes measuring as low as 10 µm in diameter) connected to a miniaturized electronic board capable of amplifying, filtering and digitalizing neural signals and, in addition, of stimulating brain tissue. To evaluate the system, we recorded slow oscillations generated in the cerebral cortex network both from in vitro slices and from in vivo anesthetized animals, and we modulated the oscillatory pattern by means of electrical and visual stimulation. Finally, we established a preliminary closed-loop algorithm in vitro that exploits the low latency of the electronics (<0.5 ms), thus allowing monitoring and modulating emergent cortical activity in real time to a desired target oscillatory frequency.


Conflict of interest statement

The authors declare no competing interests.

Figures

Figure 1
Figure 1
Ultra-flexible microelectrode array (UF-MEA) designs and impedance measurements. (A) In vivo UF-MEAs with 32 channels. (Aa) In vivo rectangular UF-MEA design with 24 electrodes of 50 µm in diameter and 8 electrodes in a rhomboidal arrangement of 10 µm in diameter (see inset). (Ab) In vivo hemispheric UF-MEA design fabricated to cover one full hemisphere of a mouse cortex with 32 electrodes of 50 µm in diameter. White spaces represent via holes for tissue oxygenation and better material adhesion. (B) In vitro UF-MEA design composed of 16 electrodes of 50 µm in diameter. (C,D) Bode diagrams of the impedance (Z) measurements showing (C) module and (D) phase of the electrode impedance.
Figure 2
Figure 2
The Corticonic board. (A) Recording and stimulation boards connected together in a stacked configuration shown out of the shell. (B) Reduced dimensions of the all-in-one Corticonic board that can lie on a palm hand with its 32 recording channels and its 2 stimulation channels. (C) Scheme of the acquisition board with the main components (analog-to-digital converter (ADC), microcontroller (μC), Hi-Speed USB connection and Input/Output digital interfaces (I/O)). (D) Scheme of the stimulation board with a 16-bit digital-to-analog converter (DAC).
Figure 3
Figure 3
Typical experimental setup for in vitro and in vivo measurements. (A) Full experimental configuration of the Corticonic board (1). Connected to the board there are: the in vitro UF-MEA (2), the ground (3), the reference (4), the stimulation outputs (5) and the USB cable (6). (B) Placement of the in vitro UF-MEA on a cortical slice. Electrodes span across deeper and upper layers (DL and UL, respectively). Electrodes and via holes are indicated with red arrows. (C) In vivo 32-channel hemispheric UF-MEA placed on the cortex of a mouse, covering one hemisphere and spanning across different cortical regions. (D) Areas over which the array lays on while on the mouse cortex: PtA, parietal association; RSD, retrosplenial dysgranular cortex; SOM, somatosensory.
Figure 4
Figure 4
Signal-to-noise ratio (SNR) analysis for the Corticonic system. (A) Representative local field potential (LFP) traces recorded during the three different configurations. Configuration 1 (blue): conventional recording system and conventional MEA; Configuration 2 (green): Corticonic recording system + conventional MEA; Configuration 3 (yellow): Corticonic recording system and in vitro UF-MEA. (B) Averaged spectral SNR across all channels and experiments for the three different configurations across the full frequency spectrum below 1500 Hz. Colored shade: standard error. (C) Average of the area under the curve (AuC) of spectral SNR curves below 1500 Hz for the different configurations. (D) Average of voltage SNR for the three configurations. C + D: Mann-Whitney U test; *p < 0.05, **p < 0.01, ***p < 0.001; data shown as mean ± standard error.
Figure 5
Figure 5
Signal-to-noise ratio analysis for relevant frequency bands. (A) Average of spectral SNR values and (B) AuC values of all three configurations in three relevant frequency ranges: <30 Hz, left; 30–200 Hz, middle; 200–1500 Hz, right. A + B: Mann-Whitney U test; *p < 0.05, **p < 0.01, ***p < 0.001; data shown as mean ± standard error.
Figure 6
Figure 6
Validation of two different stimulation protocols. (Aa) Schema of the UF-MEA placed on the cortical surface in which colored spots represent the locations where the illustrated recordings were obtained (Ab) the averaged response (n = 60) to light pulses of 1 ms applied to the contralateral eye in the channels in (Aa). (Ac) 2D-spline interpolation of the mean response peak in a time window from 0 to 200 ms after the stimulus onset. (Ba) Schematic representation of the slice and in vitro UF-MEA placement. Blue circle indicates recording site. (Bb) Electric field stimulation. Modulation of Up state is shown in gray and Down state duration is shown in black. (Bc) The resulting increase in slow oscillation frequency as function of the injected current. WM: White matter; L1 and L6: cortical layer 1 and layer 6, respectively.
Figure 7
Figure 7
Real-time signal acquisition, filtering and root mean square (RMS) calculation. From left to the right, note the three different time frames with increasing current stimulation, achieving higher SO frequency. Stimulation protocol applied in in vitro experiments consisting in a 60 s pulse train stimulation followed by a 20 s pause. The averaging window used to estimate slow oscillation frequency lasts 40 s. By modulating the stimulation current, it is possible to reach the target SO frequency, thus demonstrating the potentialities of the Corticonic system in closed-loop applications. In raw LFP signal traces, several Up states can be observed. In order to estimate the SO frequency, the signal RMS is calculated in the MUA band.
Figure 8
Figure 8
Propagation of slow oscillations measured with the two in vivo (A,B) and the in vitro (C) UF-MEA designs. (Aa) Map showing 5 s sample traces recorded by each of the 32 electrodes in the in vivo rectangular UF-MEA (24 electrodes of 50 µm in diameter and 8 of 10 µm). In the blue inset tone can observe the traces of the 10-µm electrodes. Up states are detected perfectly in all channels, including in the 10-µm electrodes. (Ba) Example of traces obtained with the 32-channel in vivo hemispherical UF-MEA. (Bb) Up states initiated in the midline propagating in various directions covered by the UF-MEA. (C) Propagation was also detected with the in vitro UF-MEA. (Ca) Representative Up state traces at different recording sites in the cortical slice (blue points). (Cb) Wave propagation pattern. δ is the mean delay between the detection times of the same wave front at the different pads, it is measured as in Capone et al.. (Cc) Wave propagation leading area measured as in Capone et al..

References

    1. Caton R. Electrical Currents of the Brain. J. Nerv. Ment. Dis. 1875;2:610.
    1. Khodagholy D, et al. NeuroGrid: recording action potentials from the surface of the brain. Nat Neurosci. 2015;18:310–315. doi: 10.1038/nn.3905. - DOI - PMC - PubMed
    1. Nicolelis MA, Baccala LA, Lin RC, Chapin JK. Sensorimotor encoding by synchronous neural ensemble activity at multiple levels of the somatosensory system. Science. 1995;268:1353–8. doi: 10.1126/science.7761855. - DOI - PubMed
    1. Rousche PJ, et al. Flexible polyimide-based intracortical electrode arrays with bioactive capability. IEEE Trans. Biomed. Eng. 2001;48:361–370. doi: 10.1109/10.914800. - DOI - PubMed
    1. Castagnola E, et al. PEDOT-CNT-coated low-impedance, ultra-flexible, and brain-conformable micro-ECoG arrays. IEEE Trans Neural Syst Rehabil Eng. 2014;23:342–350. doi: 10.1109/TNSRE.2014.2342880. - DOI - PubMed

Publication types