. 2018 Oct 30:5:272.
doi: 10.3389/fvets.2018.00272. eCollection 2018.

Whole Genome Sequencing for Determining the Source of Mycobacterium bovis Infections in Livestock Herds and Wildlife in New Zealand

Affiliations

Whole Genome Sequencing for Determining the Source of Mycobacterium bovis Infections in Livestock Herds and Wildlife in New Zealand

Marian Price-Carter et al. Front Vet Sci. .

Abstract

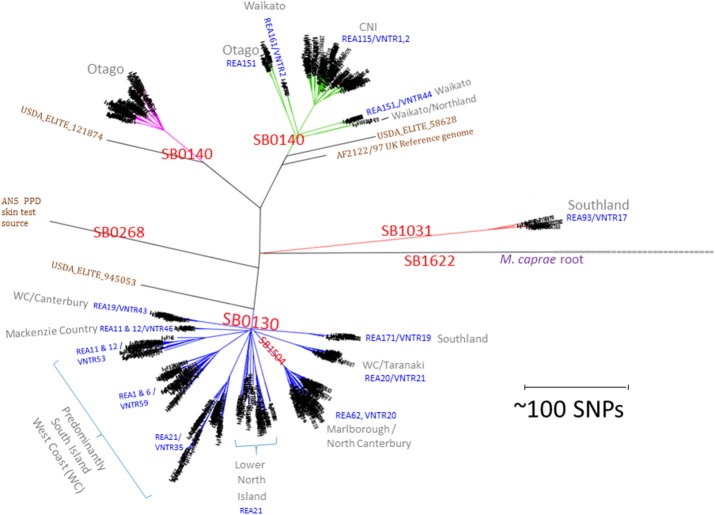
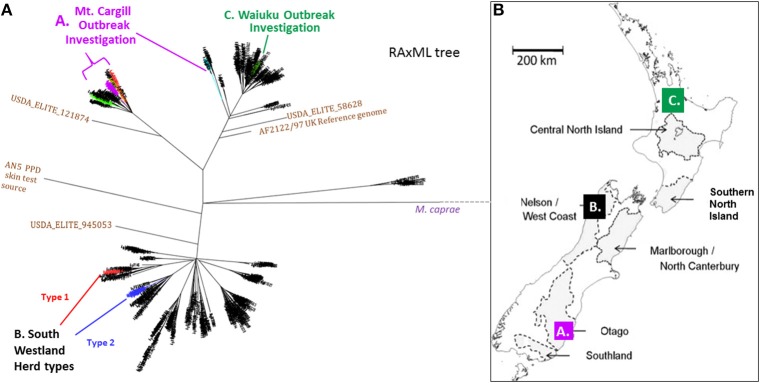
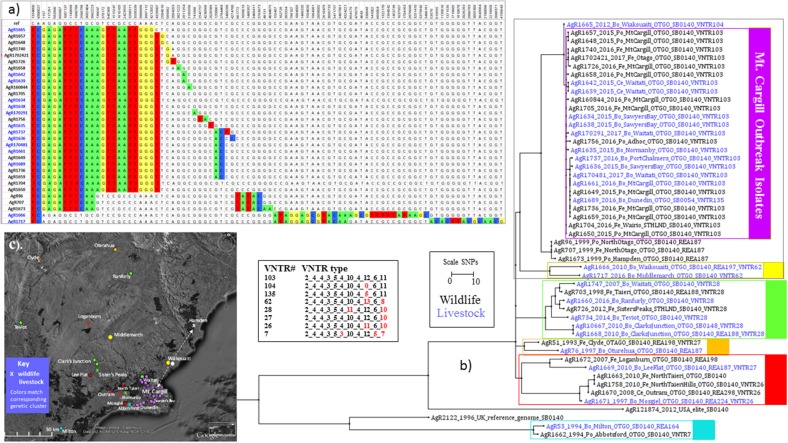
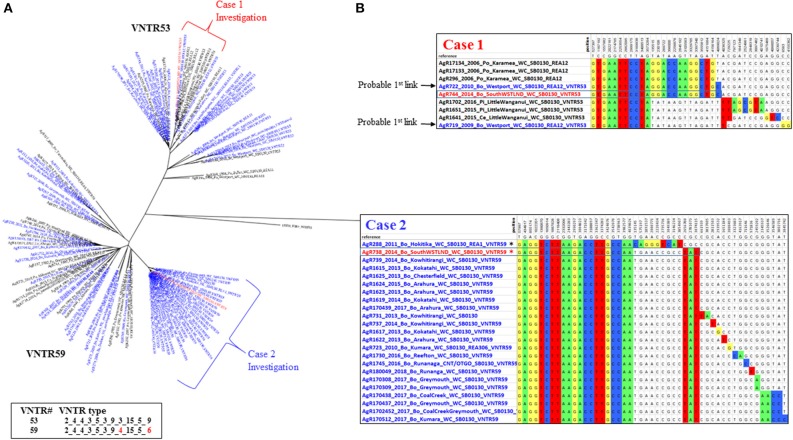
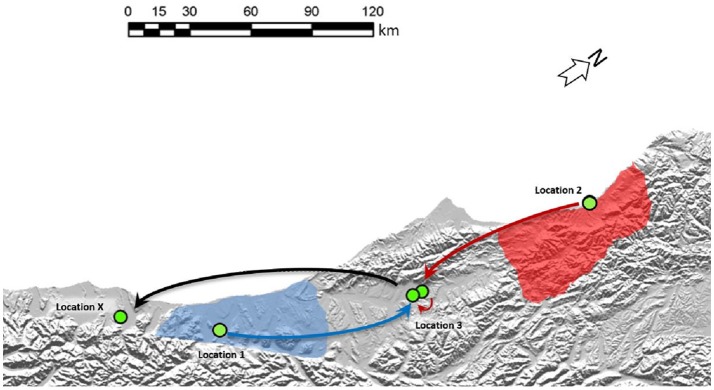
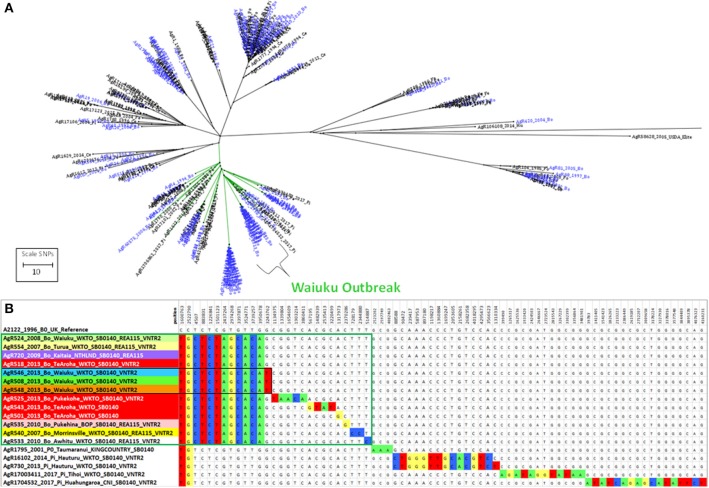
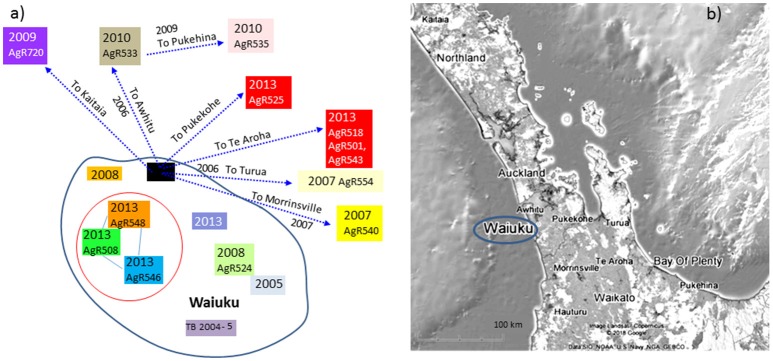
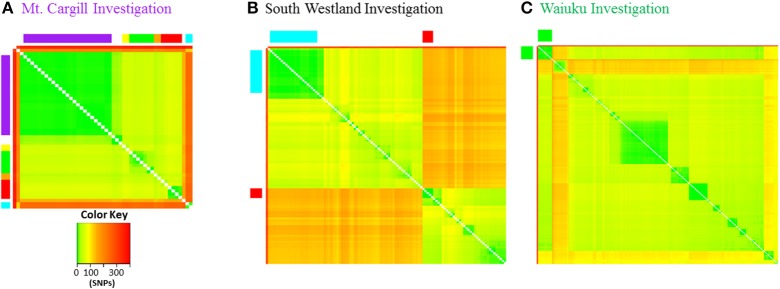
The ability to DNA fingerprint Mycobacterium bovis isolates helped to define the role of wildlife in the persistence of bovine tuberculosis in New Zealand. DNA fingerprinting results currently help to guide wildlife control measures and also aid in tracing the source of infections that result from movement of livestock. During the last 5 years we have developed the ability to distinguish New Zealand (NZ) M. bovis isolates by comparing the sequences of whole genome sequenced (WGS) M. bovis samples. WGS provides much higher resolution than our other established typing methods and greatly improves the definition of the regional localization of NZ M. bovis types. Three outbreak investigations are described and results demonstrate how WGS analysis has led to the confirmation of epidemiological sourcing of infection, to better definition of new sources of infection by ruling out other possible sources, and has revealed probable wildlife infection in an area considered to be free of infected wildlife. The routine use of WGS analyses for sourcing new M. bovis infections will be an important component of the strategy employed to eradicate bovine TB from NZ livestock and wildlife.

Keywords: Mycobacterium bovis; New Zealand; bovine tuberculosis control; epidemiology; molecular fingerprint; whole genome sequencing.


Figures

Figure 1
Figure 1
NZ M. bovis types. Radial Maximum Likelihood (ML) Phylogram illustrating the relationship of NZ M. bovis isolates in the NZ WGS database. The scale bar indicates the approximate distance in SNPs between isolates. “SB” numbers labeled in red are internationally recognized spoligotypes based on differences in the DR/CRISPR region. The REA and VNTR types listed in blue text are the predominant REA type(s) and or VNTR types in the indicated cluster and they are predominant in regions listed in gray. Overseas isolates that are included for comparison are labeled in brown: the UK reference (AF2122/97), the UK strain commonly used as a source of PPD (AN5) and 3 USDA ELITE strains (58628, 945053, and 121874). The branches in the four NZ clusters are colored differently to highlight the distinction from other branches.
Figure 2
Figure 2
(A) NZ M. bovis Radial ML Phylogram illustrating the Phylogenetic relationship of the isolates that will be discussed in more detail below. (A) Mt. Cargill investigation isolates-These isolates cluster in the Otago clade and are colored the same as in the boxed sub-groups in Phylogram in Figure 3a. (B) South Westland breakdown types- The two types isolated from the herd in South Westland and the closest relatives (shown in SNP tables in Figure 4B) are colored differently; the breakdown type 1 isolate clusters in the VNTR53 group and it and its closest known relatives are colored red, the breakdown type 2 isolates clusters in the VNTR59 subgroup and it and its closest known relatives are colored blue. (C) Waiuku outbreak- isolates cluster in the CNI clade and outbreak isolates described in the SNP table in Figure 6B are colored green. (B) Map of NZ indicating vector risk areas (shaded regions) and illustrating geographical source of the isolates from the three outbreak investigations described below. Colored squares on the map indicate the regions of the discussed outbreak investigations. The three different investigations that will be discussed below are indicated by letters and color in the Phylogram in (A) and the map in (B).
Figure 3
Figure 3
Mt. Cargill Outbreak Investigation. Genetic and spatial relationship of M. bovis isolates from southeast Otago. (a) SNP table and Phylogram for selected isolates from the Otago cluster. The SNP table illustrates SNP differences in outbreak isolates and their closest known relatives. Chromosomal positions in genomic reference NC_002945.3 are listed across the top. The DNA base found at the indicated chromosomal position in the reference is listed in the next line. DNA bases in the table are colored to indicate differences from the reference genome. (b) Square ML Phylogram. The scale bar indicates the distance in SNPs between isolates displayed in the phylograph. Livestock metadata in the tree (_Bo_ for bovine _Ce_ for cervine) is colored blue and wildlife metadata (_Po_ for possum, _Fe_ for ferret), is colored black. The numbers for the listed VNTR types are the number of repeats at the 11 loci as described in Price-Carter et al. (15): Miru40_EtrD_EtrC_EtrE_NZ2_QUB18_QUB11a_QUB26_DR2_DR1_QUB3232. Red numbers in this VNTR table indicate differences from the outbreak type VNTR103. (c) Map of sources of isolates shown in the phylogenetic tree in (b). Symbols on the map indicate the approximate regional sources and are colored to match the genetic cluster of the isolate as indicated by the boxes in (b). The arrows on the map in (c) indicate the proposed direction of the spread of this infection based on WGS results.
Figure 4
Figure 4
Multiple South Westland herd infections. (A) Radial ML Phylogram illustrating the genetic relationship of the two types of M. bovis isolates detected during a South Westland breakdown investigation, to other type VNTR59/REA1/REA6 and VNTR53/REA11/REA12 M. bovis isolates in the database. Metadata for isolates from this herd are colored red, other livestock metadata are colored blue and wildlife metadata black. Brackets indicate close relatives of the breakdown isolates and are also described in the SNP table in (B). Also shown are the two different VNTR types, with numbering as described in the legend for Figure 3. (B) SNP tables illustrating the relationship of each type to its closest relatives. The coloring and numbering in this tables is as described in Figure 3. SNPs detected in the case 1 and in case 2 isolates are boxed within the table. The asterisk in the case 2 table indicates an isolate (AgR288) that was ruled out as a possible source of infection by this investigation.
Figure 5
Figure 5
Two separate origins of TB in a South Westland Herd. Cattle movements that led to these two types of infection in the South Westland herd are indicated by arrows. Green circles indicate approximate locations where these animals resided. Shaded areas on the map indicate regions where VNTR53/REA11/REA12 (red) and VNTR59/REA1/REA6 (blue) are endemic in wildlife populations. TB case 1 moved from Location 1 to location 3 before moving to Location X (from where it was identified as TB positive at routine slaughter). TB case 2 was moved from its herd of origin in location 2 to a farm near Location 3 before moving to location 3 and then on to Location X from where it was identified as being infected. The region described here is indicated by the black box in the map in Figure 2A.
Figure 6
Figure 6
Genetic relationship of Waiuku outbreak Isolates. (A) Radial ML Phylogram illustrating the genetic relationship of M. bovis isolates from the Waiuku outbreak to other livestock and wildlife isolates in the Central North Island cluster. Livestock metadata are colored blue and wildlife metadata black. Waiuku isolates are indicated by the bracket. The green colored branch indicates the isolates that are compared in Supplementary File 3e. (B) The relationship of isolates from the Waiuku outbreak is illustrated in a SNP table with DNA bases in the table colored to indicate differences from the reference genome. Metadata for isolates from different herds that were characterized by WGS are shaded differently. Waiuku outbreak isolates characterized for this investigation are boxed in green. Isolates that are boxed in black were not known to be linked by movement but were from farms within 4 km of one another.
Figure 7
Figure 7
Waiuku outbreak Transmission path. (a) The direction of spread deciphered from epidemiological investigation, (b) a map illustrating the geographical sources of the characterized isolates. Isolates that have been characterized by WGS are colored to match the genomic data shown in the SNP table in Figure 6B. Colored boxes without AgR numbers represent isolates that were not characterized by WGS. Isolates that are circled in red were not known to be linked by movement but were from farms within 4 km of one another.
Figure 8
Figure 8
Pairwise genetic distance heat maps. Distance in SNPs between pairs of isolates is illustrated by the different colors as indicated in the color key. (A) Mt. Cargill outbreak isolates are in the same order as in the Phylogram in Figure 3 and colors along the outside of the plot correspond to those in the Phylogram and also to those in the more detailed distance plots in Supplementary File 6. (B) VNTR53 and VNTR59 isolates. Close relatives of South Westland breakdown type 1 are indicated by red squares and type 2 by the blue rectangles along the outside of the plot. Isolates are in the same order as in the more detailed distance plots in Supplementary File 6. (C) CNI branch isolates. Waiuku outbreak isolates are indicated by the green squares along the outside of the plot.

Similar articles

Cited by

References

    1. Livingstone PG, Hancox N, Nugent G, de Lisle GW. Toward eradication: the effect of Mycobacterium bovis infection in wildlife on the evolution and future direction of bovine tuberculosis management in New Zealand. N Z Vet J. (2015) 63 (Suppl. 1):4–18. 10.1080/00480169.2014.971082 - DOI - PMC - PubMed
    1. Livingstone PG, Hancox N, Nugent G, Mackereth G, Hutchings SA. Development of the New Zealand strategy for local eradication of tuberculosis from wildlife and livestock. N Z Vet J. (2015) 1:98–107. 10.1080/00480169.2015.1013581 - DOI - PMC - PubMed
    1. Buddle BM, de Lisle GW, Griffin JF, Hutchings SA. Epidemiology, diagnostics, and management of tuberculosis in domestic cattle and deer in New Zealand in the face of a wildlife reservoir. N Z Vet J. (2015) 63 (Suppl.):19–27. 10.1080/00480169.2014.929518 - DOI - PMC - PubMed
    1. Kao RR, Price-Carter M, Robbe-Austerman S. Use of genomics to track bovine tuberculosis transmission. Rev Sci Tech. (2016) 35:241–58. 10.20506/rst.35.1.2430 - DOI - PubMed
    1. de Lisle GW, Bengis RG, Schmitt SM, O'Brien DJ. Tuberculosis in free-ranging wildlife: detection, diagnosis and management. Rev Sci Tech. (2002) 21:317–34. 10.20506/rst.21.2.1339 - DOI - PubMed

LinkOut - more resources