. 2019 Feb;234(2):274-290.
doi: 10.1111/joa.12912. Epub 2018 Nov 13.

Quantitative analysis of the core 2D arrangement and distribution of enamel rods in cross-sections of mandibular mouse incisors

Affiliations

Quantitative analysis of the core 2D arrangement and distribution of enamel rods in cross-sections of mandibular mouse incisors

Charles E Smith et al. J Anat. 2019 Feb.

Abstract

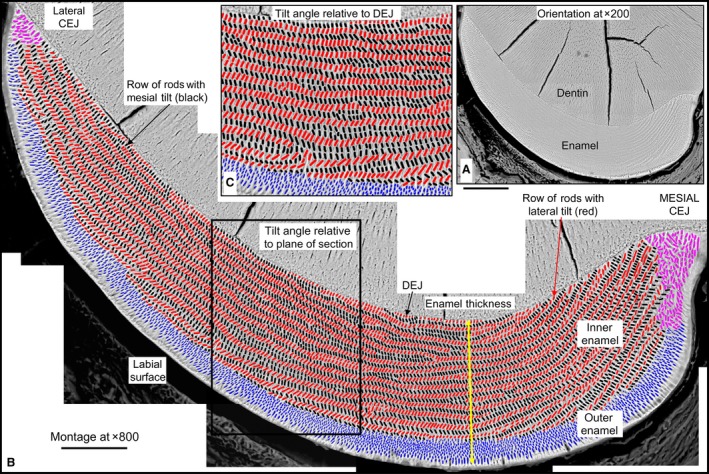
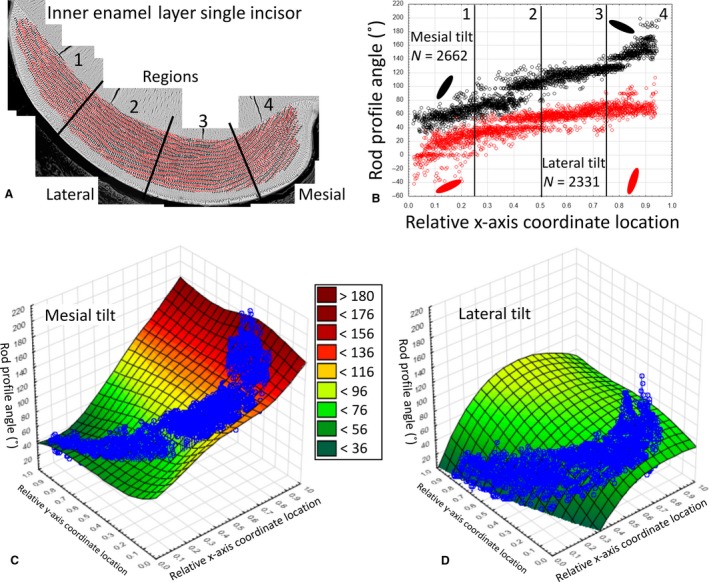
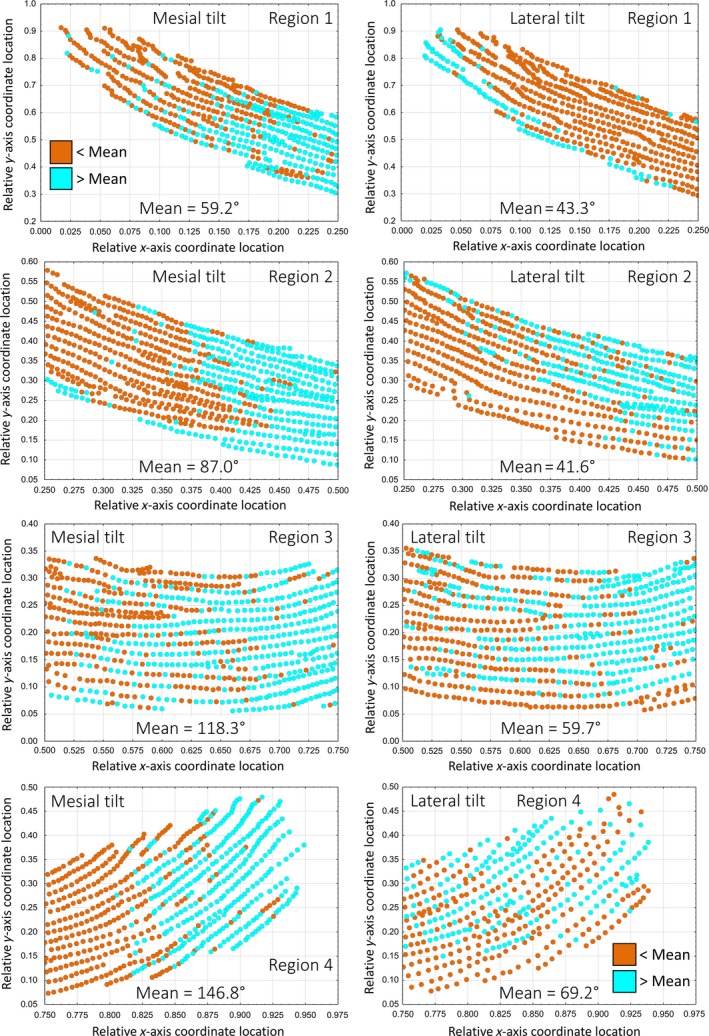
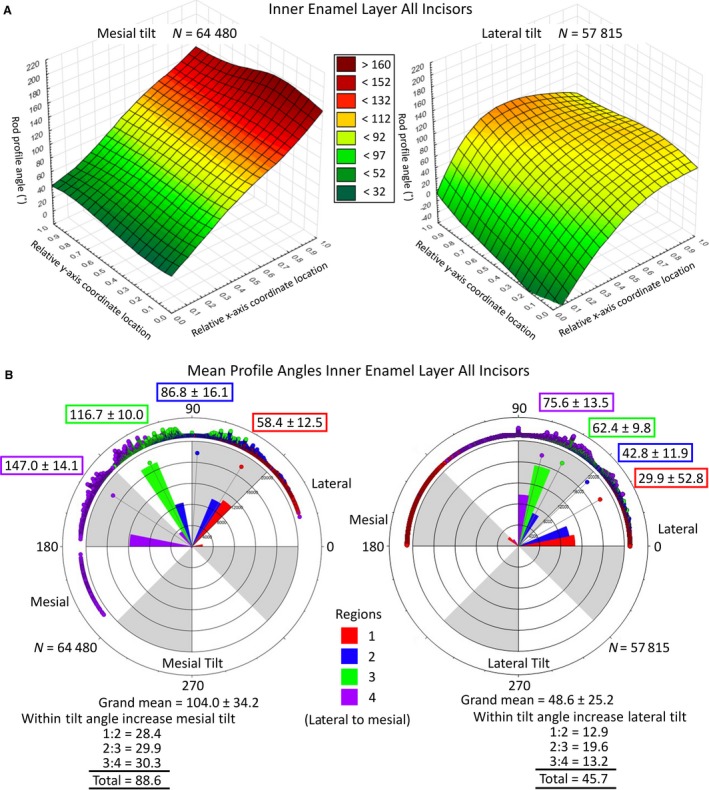
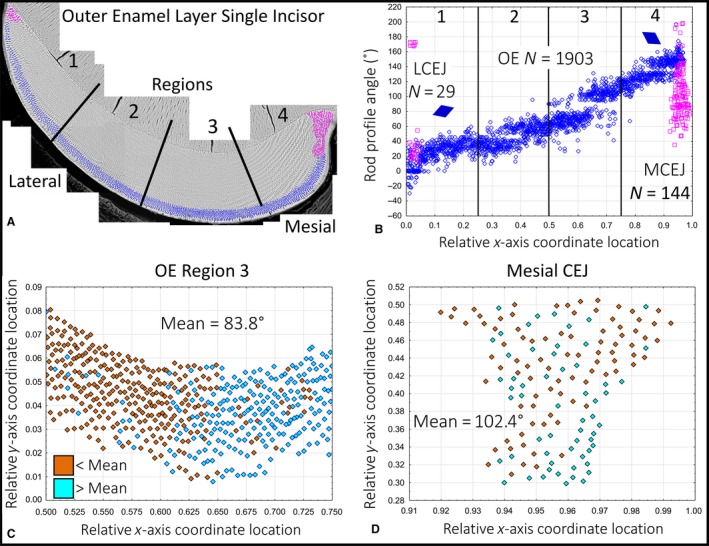
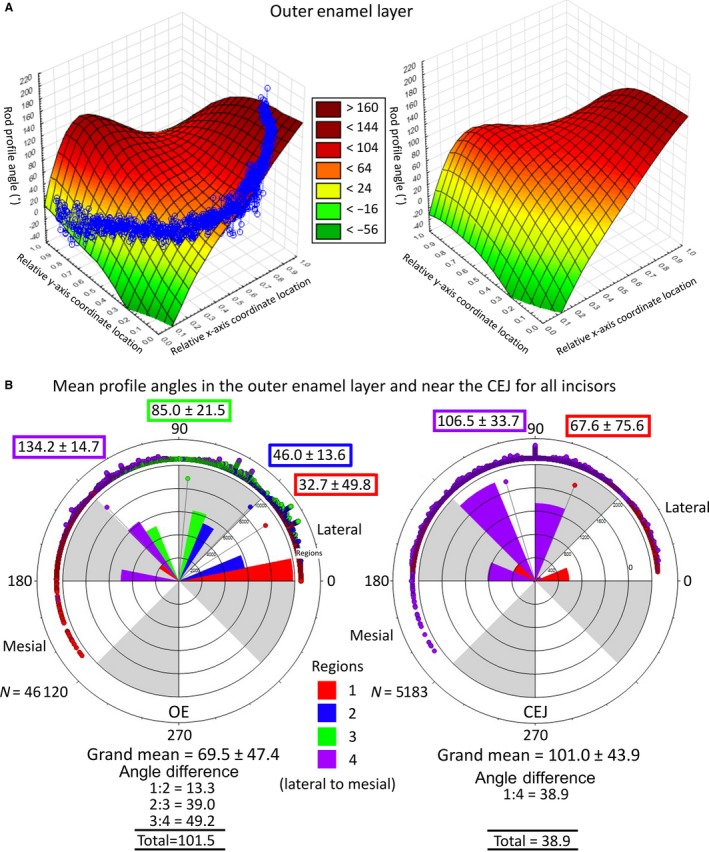
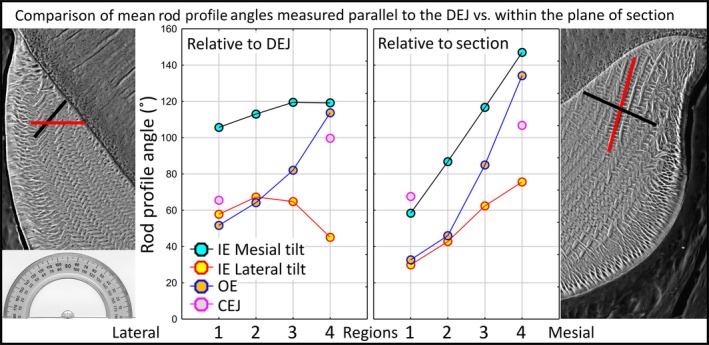
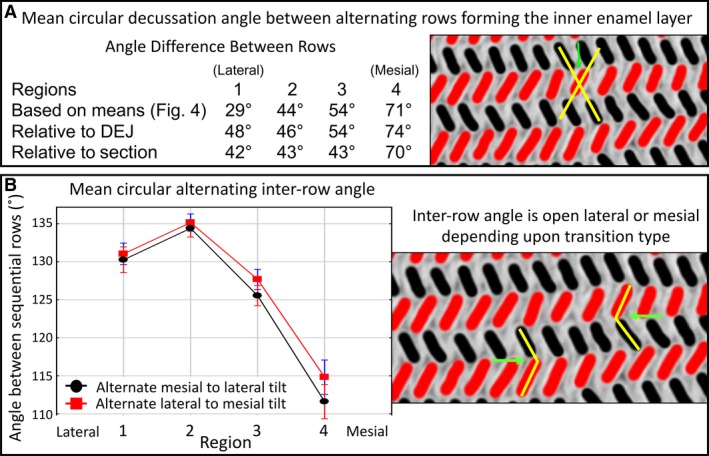
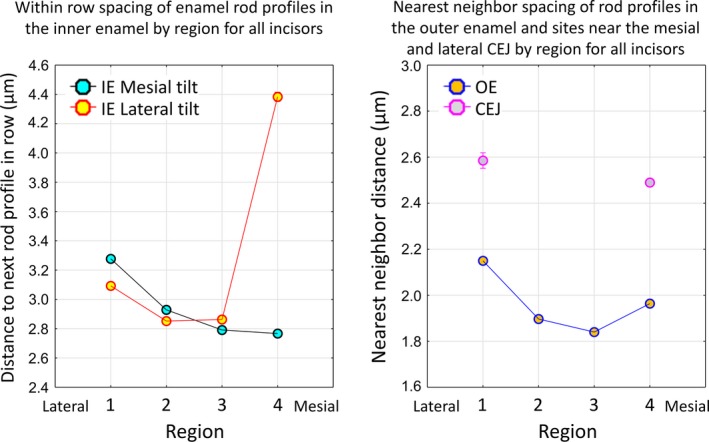
Considerable descriptive information about the overall organization of mouse mandibular incisor enamel is available but almost nothing is known about the quantitative characteristics of enamel rod arrangement and distribution in these teeth. This has important implications concerning cell movement during the secretory stage because each ameloblast makes one enamel rod. Knowing how many enamel rods are cut open in a cross-section of the enamel layer could provide insights into understanding the dynamics of how groups of ameloblasts form the enamel layer. In this study, cross-sections of fully mineralized enamel were cut on 24 mandibular mouse incisors, polished and etched, and imaged by scanning electron microscopy in backscatter mode. Montaged maps of the entire enamel layer were made at high magnification and the enamel rod profiles in each map were color-coded based upon rod category. Quantitative analyses of each color layer in the maps were then performed using standard routines available in imagej. The data indicated that that there were on average 7233 ± 575 enamel rod profiles per cross-section in mandibular incisors of 7-week-old mice, with 70% located in the inner enamel layer, 27% located in the outer enamel layer, and 3% positioned near the mesial and lateral cementoenamel junctions. All enamel rod profiles showed progressive increases in tilt angles, some very large in magnitude, from the lateral to mesial sides of the enamel layer, whereas only minor variations in tilt angle were found relative to enamel thickness at given locations across the enamel layer. The decussation angle between alternating rows of rod profiles within the inner enamel layer was fairly constant from the lateral to central labial sides of the enamel layer, but it increased dramatically in the mesial region of the enamel layer. The packing density of all rod profiles decreased from lateral to central labial regions of the enamel layer and then in progressing mesially, decreased slightly (inner enamel, mesial tilt), increased slightly (outer enamel layer) or almost doubled in magnitude (inner enamel, lateral tilt). It was concluded that these variations in rod tilt angle and packing densities are adaptations that allow the tooth to maintain a sharp incisal edge and shovel-shape as renewing segments formed by around 7200 ameloblasts are brought onto the occluding surface of the tooth by continuous renewal.

Keywords: enamel formation; enamel rods; quantification; rod decussation; spatial distribution.


Figures

Figure 1
Figure 1
Orientation to the enamel layer and method employed for quantifying enamel rods in cross‐section. Illustration of approach employed for making high magnification maps of the labial side of mandibular mouse incisors from montaged BEI images and for color‐coding enamel rod profiles by their regional distribution within the enamel layer: inner enamel layer with rod profiles having a mesial (black) or lateral (red) tilt, outer enamel layer with rod profiles appearing diamond‐shaped (blue), and irregular rod profiles located near the lateral and mesial cementoenamel junctions (CEJ) (magenta). (A) Low magnification BEI image (×200) of labial side of the mandibular mouse incisor showing location of enamel and dentin in a typical cross‐section of the tooth. The cracks in the dentin are an artifact caused by air drying the tissue slice. (B) A high‐resolution map of the same tooth section shown in (A) made from BEI images photographed at ×800 and montaged together to recreate the whole enamel layer. The site for measuring enamel thickness and regional subdivisions of the enamel layer are indicated. (C) Some quantitative measurements of rod profile tilt angles were made by cropping out areas so their edges were oriented parallel to the DEJ rather than within the plane of the cross‐section (box in B). Scale bars: (A) 100 μm, (B) 50 μm.
Figure 2
Figure 2
Example data for rod profile angles in the inner enamel layer measured in a single mandibular mouse incisor. Angle data from a single mandibular mouse incisor for rod profiles in the inner enamel layer having a mesial tilt (black) or a lateral tilt (red). (A) Color map for rod profiles. The enamel layer is partitioned into four equally spaced regions from lateral (1) to mesial (4) sides. (B) Graph of rod profile tilt angle (y‐axis) vs. location across the face of the cross‐section expressed as virtual coordinates (x‐axis). The number of rod profiles plotted from (A) are indicated for each tilt (N =) as are schematic representations of the mean rod profile tilts by the large ovals plotted for the lateral (1) and mesial (4) regions. Rod profiles having a mesial tilt (black) show a linear increase in angulations from lateral to mesial sides, whereas rod profiles having a lateral tilt (red) increase initially from lateral to mid lateral regions (1 to 2) and only gradually thereafter (3 and 4). (C,D) Distance weighted least‐squared 3D surface plots of rod profile angulations (z‐axis) relative to regional location (x‐axis) and location within the thickness of the enamel layer (y‐axis) and row tilt (mesial tilt, C; lateral tilt, D). Data values are overlaid to assist visualizing tooth profile outline relative to the more linear surface plot. Some small variations in rod profile angle occur across the thickness of the enamel layer (uniformity of color across the y‐axis for a given x‐axis coordinate location), but the greatest change in rod profile angle occurs relative to regional location across the face of the cross‐section (change in color relative to x‐axis).
Figure 3
Figure 3
Scatterplots of tilt angle of rod profiles across rows and depth of the inner enamel layer in the lateral (1), mid lateral (2), central labial (3), and mesial (4) regions of the inner enamel layer on a single incisor. Graphs from a single mouse mandibular incisor showing the distribution of rod profile angles for rows having a mesial tilt (left side) or lateral tilt (right side) relative to the mean circular angle (less than, brown; greater than, cyan) computed on a regional basis (lateral, region 1; mid lateral, region 2, central labial, region 3; mesial, region 4). Rod profile angles across different rows or across the thickness of the enamel layer are very variable and show no clear pattern, and less so for rows having a lateral tilt compared with those having a mesial tilt, where changes in the mean circular angle occur more dramatically between regions. The central labial region (3) is the only part of the enamel layer showing some similarities in the distributions of rod profile angles relative to the mean for the two rod tilt categories. In the mesial region (4), rod profiles having a lateral tilt are more widely spaced apart from one another compared with the other regions.
Figure 4
Figure 4
The 3D surface and circular plots of rod profile angles using pooled data from all incisors. The 3D surface plots of rod profile angles across the width and thickness of the inner enamel layer (A). Distance weighted least‐squared 3D surface plots of rod profile angles across the entire inner enamel layer pooled from all mandibular mouse incisors examined in this study (z‐axis) plotted relative to regional location (x‐axis) and location within the thickness of the enamel layer (y‐axis) separated by row tilt (mesial tilt, lateral tilt). These graphs, based on data from 24 incisors, bear a striking similarity to the results obtained from one incisor (Fig. 2C,D), suggesting that the detected rod profile angle changes occur in a highly repetitive manner in mouse incisor enamel (data from one tooth is representative of the pattern present in 24 teeth). In this figure the trends across enamel thickness (y‐axis) and regional location (x‐axis) are merely smoother and more uniform than in Fig. 2. Circular plots of rod profile angles in the inner enamel layer partitioned by region and by tilt (B). Circular plots of rod profile angles in the inner enamel layer partitioned by region (Fig. 2A) and by tilt (mesial, lateral) for all mandibular mouse incisors. Measurements are in a counterclockwise direction from the 3 o'clock position (0°) with the lateral CEJ situated on the right side and mesial CEJ on the left side of each circle. The four regions of the inner enamel layer are represented by color (1, red; 2, blue; 3, green; 4, violet); points = counts, bars = relative number of observations per color, point with line = mean circular direction (also indicated by N ± circular SD). The mean profile tilt angle of rod profiles having a mesial tilt is on average roughly twice as large as rod profiles having a lateral tilt. The regional means and the increase in profile angle from lateral to mesial sides of the inner enamel layer also show this 2 : 1 difference for rod profiles having a mesial tilt compared to those having a lateral tilt. (= total number of rod profiles analyzed in estimating grand means).
Figure 5
Figure 5
Example data for rod profile angles in the outer enamel layer measured in a single mandibular mouse incisor. Angle data from a single mandibular mouse incisor for rod profiles forming the outer enamel layer (blue) and those located near the mesial and lateral CEJ (magenta). (A) Color map for rod profiles. The enamel layer is partitioned into four equally spaced regions (the same as in Fig. 2). (B) Graph of rod profile tilt angle (y‐axis) vs. location across the face of the cross‐section expressed as virtual coordinates (x‐axis). The number of rod profiles plotted from (A) are indicated (N), as is a schematic representation of the mean rod profile tilt in the outer enamel layer by the diamonds plotted for the lateral (1) and mesial (4) regions. Rod profiles forming the outer enamel layer (blue) show a linear increase in angulations from lateral to mesial sides, while rod profiles situated near the CEJ are more randomly arranged. (C) Graph showing the distribution of rod profile angles in the outer enamel layer of the central labial region (A, region 3, blue) relative to the mean circular angle (less than, brown; greater than, cyan). There is a general trend for rod profile angles to increase in a mesial direction (with some irregularities) but no evidence for a similar change relative to enamel thickness. (D) Graph showing the distribution of rod profile angles near the mesial CEJ (A, region 4, magenta) relative to the mean circular angle (less than, brown; greater than, cyan). Enamel rod profiles at this site appear randomly tilted irrespective of location.
Figure 6
Figure 6
The 3D surface and circular plots of rod profile angles across the width and thickness of the outer enamel layer. The 3D surface plots for a single incisor compared to pooled data from all incisors (A). Distance weighted least‐squared 3D surface plots of rod profile angles across the entire outer enamel layer for one mandibular mouse incisor and for data pooled from all mandibular mouse incisors examined in this study (z‐axis) plotted relative to regional location (x‐axis) and location within the thickness of the enamel layer (y‐axis). These graphs (based on one incisor and 24 incisors) bear a striking similarity to each other, suggesting that the detected rod profile angle changes occur in a highly repetitive manner in mouse incisor enamel (data from one tooth is representative of the pattern present in 24 teeth). Circular plots of rod profile angles across the width and thickness of the outer enamel layer partitioned by region and for rod profiles located near the mesial and lateral CEJ (B). Circular plots of rod profile angles in the outer enamel layer and near the mesial and lateral CEJ partitioned by region (Fig. 5A) for all mandibular mouse incisors. Measurements are in a counterclockwise direction from the 3 o'clock position (0°) with the lateral CEJ situated on the right side and mesial CEJ on the left side of each circle. The four regions of the inner enamel layer are represented by color (1, red; 2, blue; 3, green; 4, violet); points = counts, bars = relative number of observations per color, point with line = mean circular direction (also indicated by numbers ± circular SD). Rod profile angles within the outer enamel layer increase fourfold from lateral to mesial sides of the enamel layer, much greater than is seen for rods forming the inner enamel layer (Fig. 4B) or positioned near the CEJ (right panel). (= total number of rod profiles analyzed in estimating grand means).
Figure 7
Figure 7
Graphs summarizing rod profile angle relationships across the four regions of the enamel layer as measured relative to the plane of section or to the DEJ. Graphs summarizing rod profile angle relationships across the four regions of the enamel layer (1, lateral; 2, mid lateral, 3, central labial; 4, mesial) within the inner enamel layer (IE), the outer enamel layer (OE) and near the CEJ as measured either within the plane of section (transverse) or relative to cropping box positioned parallel to the DEJ. At the left and right sides of the graphs are BEI images of the lateral and mesial regions (1 and 4) with example rod profiles having a mesial (black) or lateral (red) tilt for orientation purposes. At the left side an image of a protractor is included for reference. Data are from the right and left mandibular incisors of six mice (12 incisors total). Number of rods analyzed, n = 50 000 relative to the DEJ and n = 92 500 relative to plane of section. Angulation differences from lateral to mesial sides of a cross‐section are much less pronounced for rod profiles forming the inner enamel layer when imaging fields are aligned parallel to the DEJ prior to measurement. Angulation differences are relatively unchanged for rod profiles forming the outer enamel layer and those located near the CEJs irrespective of alignment method.
Figure 8
Figure 8
Decussation and alternating inter‐row angles. Decussation angle between rows alternating between mesial and lateral tilts computed from mean angles or as measured relative to the plane of section or to the DEJ (A). Decussation angle between rows with alternating mesial and lateral tilts measured across the four regions of the inner enamel layer (1, lateral; 2, mid lateral, 3, central labial; 4, mesial). At the left side of the table is a small cropped area of the inner enamel layer from a color map (black = mesial tilt; red = lateral tilt) illustrating with the yellow lines the decussation angle (green arrow). Number of alternating rows analyzed, n = 2974 from 24 mandibular incisors. These results suggest that measurements of the decussation angle are independent of plane of section and tooth curvature (i.e. this variable is row‐dependent rather than dependent on the plane of section or alignment). Considering the manner in which row development occurs in the incisor (see Fig. 10), these data further suggest that the decussation angle between rows with alternating tilts increases sharply as the wave of differentiation spreads mesially from the central labial side of the tooth (region 3 to 4), but the decussation angle changes little as the wave spreads laterally (from region 3 to 2, then to region 1). (B) Alternating inter‐row angle measured across the four regions of the inner enamel layer (1, lateral; 2, mid lateral, 3, central labial; 4, mesial). At the left side of the table is a small cropped area of the inner enamel layer from a color map (black = mesial tilt; red = lateral tilt) illustrating with the yellow lines the inter‐row angle as the alternation from mesial (black) to lateral (red) tilt or from lateral (red) to mesial (black) tilt (green arrows). Number of alternating rows analyzed, n = 480 per tilt category from 12 mandibular incisors. There are no clear differences between the red points and black points within the same region. As expected, the inter‐row angle is smallest in the mesial region (4) where the decussation angle between alternating rows is the greatest (top panel).
Figure 9
Figure 9
Graphs summarizing distance between rod profiles (spacing) across the four regions of the enamel layer within the inner and outer enamel layers and near the CEJ. Graphs summarizing distance between rod profile (spacing) across the four regions of the enamel layer (1, lateral; 2, mid lateral, 3, central labial; 4, mesial) relative to the inner enamel layer (IE), the outer enamel layer (OE) and near the CEJ. Data are from 24 mandibular incisors of 18 mice Inner enamel: n = 62 986 mesial tilt, n = 56 337 lateral tilt; outer enamel: n = 46 120; CEJ: n = 5183. The tightest packing together of rod profiles occurs in the central labial region (3) of the outer enamel layer (right panel) followed by the central labial and mesial (4) regions of the inner enamel layer for rod profiles having a mesial tilt (left panel). The widest spacing of rod profiles occurs in the mesial region of the inner enamel layer for rod profiles having a lateral tilt (left panel). Rod profile spacing in both the inner and outer enamel layers shows a trend to increase in a lateral direction (region 3 toward region 1) and to increase in a mesial direction, but only within the outer enamel layer (region 3 toward region 4). Rod profile spacing near the CEJ is similar at the mesial and lateral sides and is intermediate in distance between spacing seen in the inner and outer enamel layers.
Figure 10
Figure 10
Schematic illustration of the multidirectional developmental pattern for enamel and the step‐like arrangement of enamel rods created relative to the cross‐sectional plane of the mandibular mouse incisor. Low‐magnification BEI image of a cross‐section of the enamel layer covering the labial side of a mandibular mouse incisor (top left side). The boxed area is shown at higher magnification at the bottom. On the right side are schematic drawings illustrating how enamel rods project into or out of the plane of section to varying degrees depending upon their location across the thickness of the enamel layer. Enamel rod profiles, each representing a single 2D slice from the much larger 3D enamel rod, found near the DEJ are the most apical starting points for rods projecting mostly in an incisal direction from the plane of section, whereas rod profiles seen near the outer surface are cut at the incisal end of rods projecting in an apical direction backwards into the tissue block. Rod profiles seen in the middle of the enamel layer would have half their 3D length projecting apically and the other half projecting incisally, with all other profiles inbetween projecting predominately incisally (above midpoint) or apically (below midpoint). During development, enamel formation begins near the DEJ at the central side of the tooth (boxed area, location A) and spreads as a wave in a mesial direction (arrow to location B) and lateral direction (arrow to location C) as the enamel layer increases in thickness by appositional growth (arrow to location D) (Smith & Warshawsky, 1976). A cross‐section of the incisor therefore represents a composite image built up over time of the creation of lamellar sheets of rods stacked in a step‐like arrangement one behind the other with alternating tilts. This formative process spreads as a wave to the mesial and lateral sides of the labial surfaces so that location A begins its development before location B, followed by location C, thereby creating a time composite of development across the whole enamel layer. The thin ring of rod profiles abutting the DEJ and those abutting the outer surface define the entire volume of 3D enamel rod space sampled by the cross‐section.

Similar articles

Cited by

References

    1. Boyde A (1967) The development of enamel structure. Proc R Soc Med 60, 923–928. - PMC - PubMed
    1. Boyde A (1969) Electron microscopic observations relating to the nature and development of prism decussation in mammalian dental enamel. Bull Group Int Rech Sci Stomatol 12, 151–207. - PubMed
    1. Boyde A (1989) Enamel In: Handbook of Microscopic Anatomy: Teeth. (eds Oksche A, Vollrath L.), pp. 309–473, Berlin: Springer‐Verlag.
    1. Cox BN (2013) How the tooth got its stripes: patterning via strain‐cued motility. J R Soc Interface 10, 20130266. - PMC - PubMed
    1. Habelitz S (2015) Materials engineering by ameloblasts. J Dent Res 94, 759–767. - PMC - PubMed

Publication types