Review
. 2019 Jan 1;99(1):427-511.
doi: 10.1152/physrev.00061.2017.

Sarcopenia: Aging-Related Loss of Muscle Mass and Function

Affiliations
Review

Sarcopenia: Aging-Related Loss of Muscle Mass and Function

Lars Larsson et al. Physiol Rev. .

Abstract

Sarcopenia is a loss of muscle mass and function in the elderly that reduces mobility, diminishes quality of life, and can lead to fall-related injuries, which require costly hospitalization and extended rehabilitation. This review focuses on the aging-related structural changes and mechanisms at cellular and subcellular levels underlying changes in the individual motor unit: specifically, the perikaryon of the α-motoneuron, its neuromuscular junction(s), and the muscle fibers that it innervates. Loss of muscle mass with aging, which is largely due to the progressive loss of motoneurons, is associated with reduced muscle fiber number and size. Muscle function progressively declines because motoneuron loss is not adequately compensated by reinnervation of muscle fibers by the remaining motoneurons. At the intracellular level, key factors are qualitative changes in posttranslational modifications of muscle proteins and the loss of coordinated control between contractile, mitochondrial, and sarcoplasmic reticulum protein expression. Quantitative and qualitative changes in skeletal muscle during the process of aging also have been implicated in the pathogenesis of acquired and hereditary neuromuscular disorders. In experimental models, specific intervention strategies have shown encouraging results on limiting deterioration of motor unit structure and function under conditions of impaired innervation. Translated to the clinic, if these or similar interventions, by saving muscle and improving mobility, could help alleviate sarcopenia in the elderly, there would be both great humanitarian benefits and large cost savings for health care systems.


Conflict of interest statement

J. L. Kirkland has a finacial interest related to this work: patents on senolytic drugs are held by Mayo Clinic. This work has been revised by the Mayo Clinic Conflict of Interest Review Board and was conducted in compliance with Mayo Clinic conflict of interest policies. No other conflicts of interest, financial or otherwise, are declared by the authors.

Figures
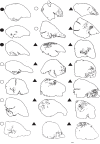
FIGURE 1.
FIGURE 1.
Spatial organization of motor unit fibers in young animals. Camera lucida tracings of glycogen-depleted cross-sections of fast-twitch motor unit fibers from young animals, classified according to their MyHC composition, in 21 cross-sections of tibialis anterior muscle (each section is from a separate rat). The superficial part of the muscle is facing the top of the figure. The type IIa, type IIx, and IIb myosin heavy chain (MyHC) units are identified by filled circles, open circles, and filled triangles, respectively. The horizontal bar represents 1 mm. [The graph is modified from Larsson and co-workers (521, 524).]
FIGURE 2.
FIGURE 2.
Spatial organization of motor unit fibers in old animals. Camera lucida tracings of glycogen-depleted cross-sections of fast-twitch motor unit fibers from old animals, classified according to their MyHC composition, in 16 cross-sections of tibialis anterior muscle (each section is from a separate rat). The superficial part of the muscle is facing the top of the figure. Motor units including type IIa, type IIx, and IIb MyHC muscle fibers are identified by filled circles, open circles, and filled triangles, respectively. Motor units containing more than one type of muscle fiber are identified by two filled circles. The horizontal bar represents 1 mm. [The graph is modified from Larsson and co-workers (521, 524).]
FIGURE 3.
FIGURE 3.
Myelinated neurons in peripheral nerves and ventral roots from young and old rats. Toluidine semithin transverse sections of the soleus motor nerve from a young (A, 5 mo) and an old (B, 24 mo) rat and from the L5 ventral root from a young (C, 4 mo) and an old (D, 22 mo) rat. In D, note myelin ovoids (black arrows), myelin reduplication (unfilled arrow), splitting of myelin sheets (asterisks), thinly myelinated fibers, and clusters of regenerating fibers. Calibration bars, 1 µm (A, B) and 20 µm (C, D). [Redrawn from Ansved and Larsson (24).]
FIGURE 4.
FIGURE 4.
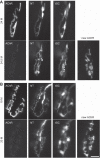
Repeated, vital images of a mouse sternomastoid muscle neuromuscular junction (NMJ) illustrate the utility of vital imaging and the stability of the synapse. Transgenic expression of cyan and green fluorescent proteins (CFP and GFP) labels motor axons and Schwann cells, respectively. The AChRs were labeled with a nonblocking concentration of rhodamine-conjugated α-BTX (red fluorescence). The axon enters the synaptic site from the left and arborizes above pretzel-shaped AChRs on the surface of the target muscle fiber. Several terminal Schwann cell somata (round, brighter staining objects) are present above the NMJ that extend processes to cover the nerve terminal. No discernable changes are observed in the images taken after a 30-day interval (lower row compared with upper row). Image courtesy of Hyuno Kang and adapted from Kang et al. (445).
FIGURE 5.
FIGURE 5.
Abrupt morphological changes occur in a small fraction of neuromuscular junctions (NMJs) over any given interval in aging mice. Repeated vital examination of NMJs in the sternomastoid muscle of aging mice reveals most junctions undergo no changes. However, abrupt morphological changes occur at a small fraction of junctions between each imaging session. NMJs that show such changes are found to have lost most of the AChRs that had been labeled with α-BTX in the prior imaging session. Newly synthesized AChRs then appear that are revealed by the reapplication of α-BTX, (“new AChR”). The new AChRs are, however, found in altered locations demonstrating a change in NMJ morphology. A: Within a period of two weeks, a young-appearing junction with contiguous AChR-rich gutters and matching terminal motor axon branches, a “pretzel,” loses its pre-existing complement of AChRs and comes to have new AChRs whose fragmented appearance becomes more apparent as the fiber grew and the endplate expanded in size (new AChR). Concurrently, the presynaptic nerve terminal becomes varicose. B: Fragmented, old appearing junctions can also undergo further remodeling, a loss of the existing AChRs, insertion of significant amounts of new receptors, and additional fragmentation of the AChR-rich area occurs in this case. Scale bar, 20 µm. Images courtesy of Yue Li and adapted from Li et al. (564).
FIGURE 6.
FIGURE 6.
NMJs on the regenerated muscle fibers undergo remodeling. Repeated vital imaging of AChRs (red), Schwann cells (SCs, green), and nerve terminal (blue) immediately following fiber ablation of a muscle fiber (day 0) using a laser microbeam and after 12 days of recovery. Immediately following the injury to the muscle fiber, the AChR-rich aggregate has a “pretzel”-like appearance apposed by matching terminal branches of a motor axon. Upon regeneration of the ablated muscle fiber (day 12) and earlier (not shown), the AChR aggregate becomes fragmented, and the nerve terminal branches become varicose. This altered morphology is maintained for the remainder of the animal’s life. Scale bar, 10 µm. Images courtesy of Yue Li and adapted from Li and Thompson (565).
FIGURE 7.
FIGURE 7.
“Fragmentation” of postsynaptic AChR aggregates occurs in aging and, in a variety of cases, of damage to sternomastoid muscle fibers. AChRs at normal mature, mouse NMJs occur in mostly contiguous “gutters” that resemble pretzels. In contrast, a large proportion of postsynaptic AChR aggregates in an aged (22 mo) muscle display a fragmented morphology. Similar fragmentation of postsynaptic AChR aggregates is observed in muscles of dystrophic (mdx) mice (in this case, 1 mo old), in wild-type 6-mo-old muscle 7 days after cardiotoxin-induced damage, and in a young muscle where a single muscle fiber was ablated with a laser microbeam applied on each side of the NMJ. Scale bar, 10 µm. Images courtesy of Robert Louis Hastings (CTX) and Yue Li (laser ablation).
FIGURE 8.
FIGURE 8.
Fragmentation of AChRs at NMJs occurs after muscle fiber damage, fiber degeneration, and regeneration. NMJs in a 6-mo-old mouse sternomastoid muscle. More central, large image is a maximum projection of a confocal stack. A young NMJ (left bottom) and an old fragmented junction (top right) are both present. The fragmented NMJ is associated with a string of nuclei located centrally within the muscle fiber (see in YZ virtual section to the right and compare with the outline of the fiber). These central nuclei are hallmarks of muscle fiber segments that have undergone damage/degeneration and have subsequently regenerated from myoblasts created by satellite cells. The myonuclei associated with the young NMJs are peripherally located (seen in XZ virtual section). The vertical and horizontal yellow dotted lines indicate the location of YZ and XZ virtual sections, respectively. Scale bar, 10 µm.
FIGURE 9.
FIGURE 9.
Myonuclear domain (MND) size in muscle fibers from mammalian species with a body mass ranging from 25 g to 2500 kg. Myonuclear domain size is measured in muscle fibers expressing the type I, IIa, IIax, IIx, IIxb, and IIb MyHC isoforms. The MND size in muscle fibers expressing the type (β/slow) MyHC isoform is shown in the inset. Values are means + SD. [From Liu et al. (577).]
FIGURE 10.
FIGURE 10.
Modeling of fiber and myonuclear domains. A: The different steps of modeling the fiber with a parametric general elliptical cylinder (GEC). a: The needed model parameters are the center point. c, the lengths of the major and minor axes, a and b, and the angle θ between the major axis and the x-axis. Here, they are schematically overlaid on an original image slice. b: The result of the fuzzy c-means (FCM) clustering of the pixels, where bright pixels denote likely fiber pixels, and dark pixels denote likely background pixels. c: A slice of the weight volume G, that is created based on the parameters extracted from the FCM thresholded image slice. d: A slice of the GEC model of the fiber surface (red), overlaid on the original image slice. The bar length denotes 50 μm. B, a: A GEC model of a fiber segment. The centroids of the myonuclei are shown as blue spheres merged with the surface rendering. b: The myonuclear domains extracted using the GEC and the nuclei centroids. The representation of each myonuclear domain at the muscle cell surface is indicated by specific colors. [From Cristea et al. (180).]
FIGURE 11.
FIGURE 11.
Confocal microscopy images of myonuclei in individual muscle fibers. A, a: Ordered myonuclei organization in a type IIa fiber from a young man. b: Increased variability in myonuclei distances in a type IIa fiber from an old woman. c: Myonuclei aggregation in a muscle fiber from an old subject [detail from b]. d: Variation in the spatial organization of nuclei in the lower (d) and upper (e) part of a single muscle fiber expressing the type I MyHC isoform from a young man. f: Deep groove-like structures on the fiber surface harboring myonuclei from an old subject. Rhodamine phalloidin (red) was used to stain for actin and DAPI (blue) to stain for the DNA (nuclei). All pictures were captured using a Plan-Neofluar 20x/0.5 objective. The horizontal bar denotes 100 µm. B: Myonuclear domain size in type I (a) and type IIa (b) fibers from young men (YM), young women (YW), old men (OM), and old women (OW). [From Cristea et al. (180).]
FIGURE 12.
FIGURE 12.
Increased variability in myonuclear organization in old age. A: Confocal images at the bottom of single muscle fiber segments from a young (a) and an old (b) subject. Nuclei are DAPI labeled (a) and the centroids of the nuclei are shown as spheres (b). The horizontal bars denote 50 µm. B: Box plots showing the standard deviation (SD) of the nearest neighbor (NN) distances between myonuclei from individual muscle fibers expressing the type I (a) and type IIa (b) MyHC isoforms in young men (YM), young women (YW), old men (OM), and old women (OW). The boxes represent the 25th and 75th percentiles, and the median value is indicated in the box. The horizontal bars denote the 10th and 90th percentiles, and data outside this range are represented as dots. [From Cristea et al. (180).]
FIGURE 13.
FIGURE 13.
The postulated vicious cycle driven by reactive oxygen species (ROS). The classical model of mitochondrial damage by ROS postulates that ROS leaking from the respiratory chain (RC) cause mutations in mitochondrial DNA (mtDNA), which in turn determine the synthesis of dysfunctional RC protein subunits, thus increasing ROS production in a vicious circle.
FIGURE 14.
FIGURE 14.
The central role of coenzyme Q (CoQ) in mitochondria homeostasis. CoQ is essential for energy metabolism (at the level of the RC and of the Krebs cycle) and lipid and pyrimidine metabolism, controls thermogenesis and apoptosis, and is a major antioxidant.
FIGURE 15.
FIGURE 15.
Cellular and biological process controlled by mitochondrial dynamic. Mitochondrial fusion is mediated by mitofusin1/2 (MFN1/2) and OPA1 to produce an elongated mitochondrial network. Elongated mitochondria optimize energy production, prevent apoptosis, and reduce mitophagy. Mitochondrial fission is controlled by DRP1, Mff, and Fis1 to generate a fragmented mitochondrial network. Mitochondrial fission promotes mitophagy to remove the dysfunctional mitochondria but also induces ROS production that cause endoplasmic reticulum (ER) stress and activation of unfolded protein response (UPR). UPR induces the ATF4-dependent upregulation of FGF21 that is secreted by the muscle and causes a premature senescence of epithelial tissues.
FIGURE 16.
FIGURE 16.
The relationship between muscle capillary supply area and aerobic capacity. Frozen sections of human vastus lateralis muscle biopsies stained with lectin (Ulex europaeus) (A) to localize capillaries and succinate dehydrogenase (SDH) (B) as an index of mitochondrial activity. C: Capillary domains represent the area of tissue closer to a given capillary (red dots) than neighboring capillaries. Ci, Cii: Overlap of domains with fast and slow fibers, respectively. Ciii: Magnified region to illustrate overlap of domains (blue outlines) and slow fibers (pink outlines). I: type I fibers; II: type II fibers; arrows indicate corresponding capillary locations in each panel; asterisks identify the same fiber in each panel. Scale bars, 100 μm. [From Bosutti et al. (91).]
FIGURE 17.
FIGURE 17.
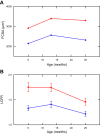
Effects of aging on fiber size and capillary supply. Fiber cross-sectional area (FCSA) (A) and local capillary to fiber ratio (LCFR: number of capillaries supplying a fiber) (B) in normal (blue line) and hypertrophied (red line) plantaris muscles from female Wistar rats of different ages. This picture illustrates 1) maturational increases in FCSA and LCFR between the age of 5 and 13 mo, 2) comparing 5- and 25-mo-old rats would have shown no age effect on FCSA and LCFR, and 3) that at all these ages, there is a maintained hypertrophy and angiogenic response (215, 216).
FIGURE 18.
FIGURE 18.
Depicted principal pathways studied in sarcopenia. The red arrows underline which and how the different factors have been shown to change in sarcopenia.
FIGURE 19.
FIGURE 19.
Effects of physical exercise on physiological parameters. A: Illustration of the impact of aging and training on a physiological parameter (e.g., muscle mass). Note the linear aging-related decrease in the parameter at a rate of 1% per year of the value at 30 yr (this is similar to the often-reported annual 1% loss of muscle mass). The vertical arrows indicate a 30% improvement in aerobic function, muscle mass, or muscle strength in response to a training program, in which, in absolute terms, the improvement that can be gained decreases with age, also causing a decreasing rejuvenation with increasing age, as illustrated by the horizontal arrows. This thus shows that 1) even when the relative gains do not change with age, the 2) absolute gains and 3) attainable rejuvenation decrease with age. B: The data in A are here expressed as a percentage decline in the physiological parameter from the value it had in the year before. This exponential pattern can be explained by a random accumulation of damage in remaining tissue. [From Degens (200).]

Similar articles

Cited by

References

    1. Aagaard P, Suetta C, Caserotti P, Magnusson SP, Kjaer M. Role of the nervous system in sarcopenia and muscle atrophy with aging: strength training as a countermeasure. Scand J Med Sci Sports 20: 49–64, 2010. doi:10.1111/j.1600-0838.2009.01084.x. - DOI - PubMed
    1. Abou-Khalil R, Mounier R, Chazaud B. Regulation of myogenic stem cell behavior by vessel cells: the “ménage à trois” of satellite cells, periendothelial cells and endothelial cells. Cell Cycle 9: 892–896, 2010. doi:10.4161/cc.9.5.10851. - DOI - PubMed
    1. Acakpo-Satchivi LJ, Edelmann W, Sartorius C, Lu BD, Wahr PA, Watkins SC, Metzger JM, Leinwand L, Kucherlapati R. Growth and muscle defects in mice lacking adult myosin heavy chain genes. J Cell Biol 139: 1219–1229, 1997. doi:10.1083/jcb.139.5.1219. - DOI - PMC - PubMed
    1. Acín-Pérez R, Fernández-Silva P, Peleato ML, Pérez-Martos A, Enriquez JA. Respiratory active mitochondrial supercomplexes. Mol Cell 32: 529–539, 2008. doi:10.1016/j.molcel.2008.10.021. - DOI - PubMed
    1. Acosta MJ, Vazquez Fonseca L, Desbats MA, Cerqua C, Zordan R, Trevisson E, Salviati L. Coenzyme Q biosynthesis in health and disease. Biochim Biophys Acta 1857: 1079–1085, 2016. doi:10.1016/j.bbabio.2016.03.036. - DOI - PubMed

Publication types