. 2018 Nov 14:7:e36248.
doi: 10.7554/eLife.36248.

Long-term live imaging of the Drosophila adult midgut reveals real-time dynamics of division, differentiation and loss

Affiliations

Long-term live imaging of the Drosophila adult midgut reveals real-time dynamics of division, differentiation and loss

Judy Lisette Martin et al. Elife. .

Abstract

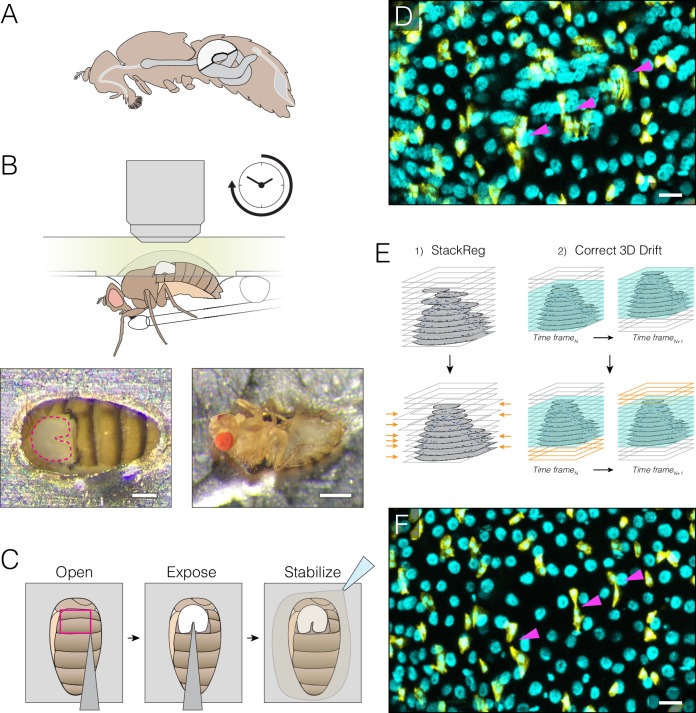
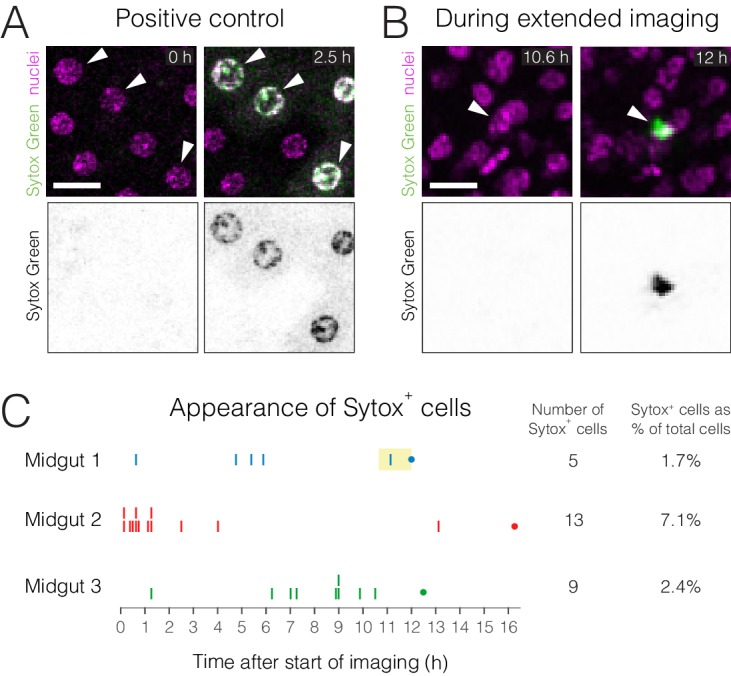
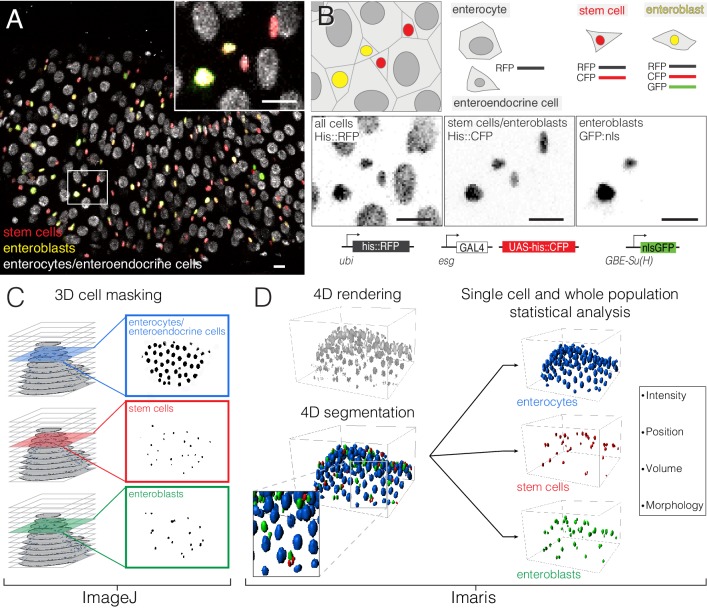
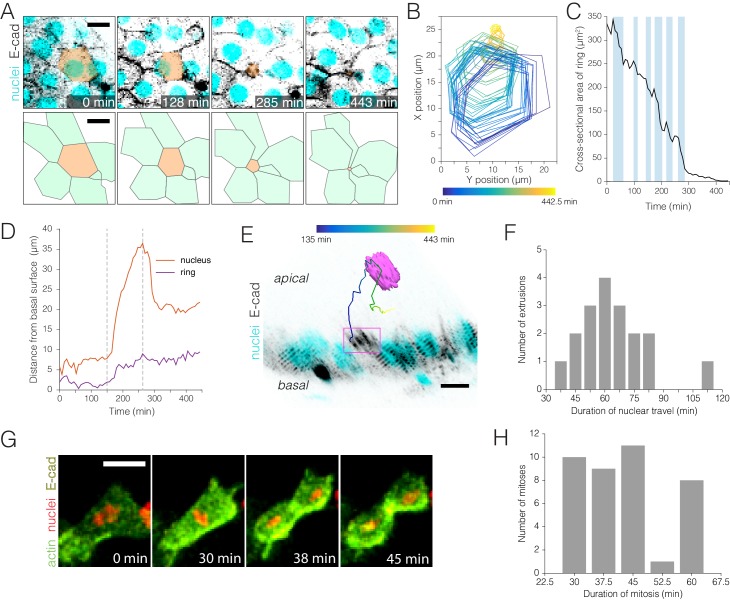
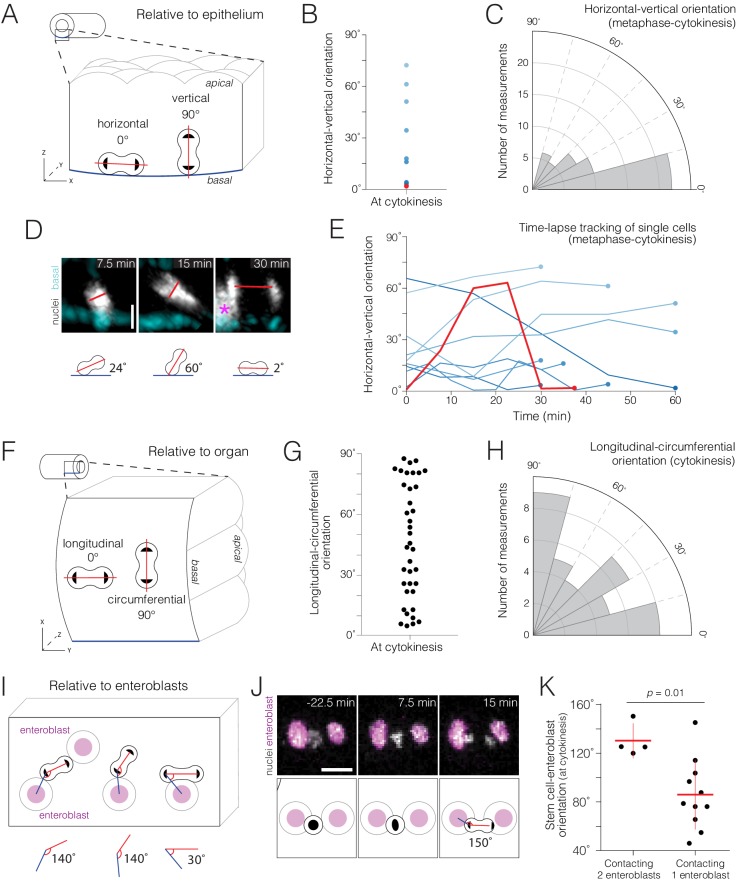
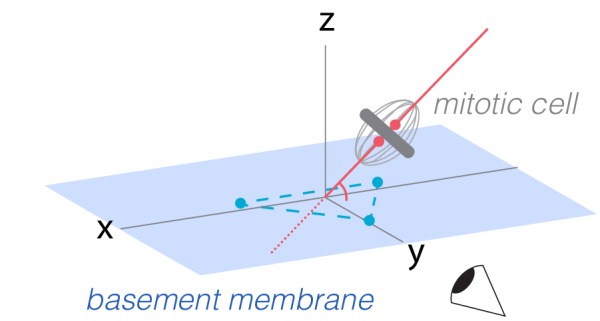
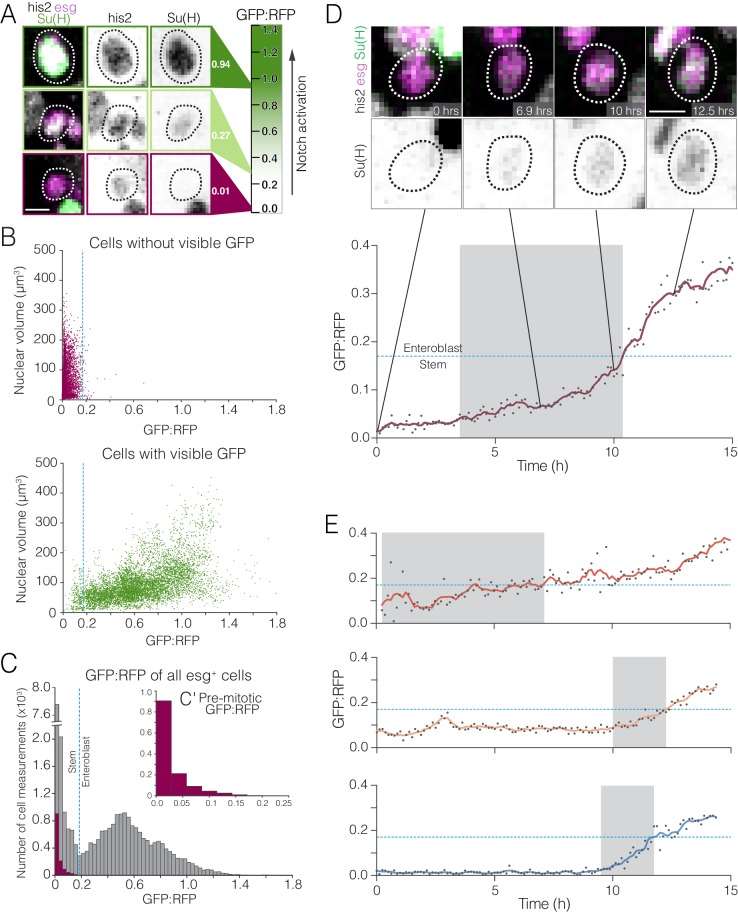
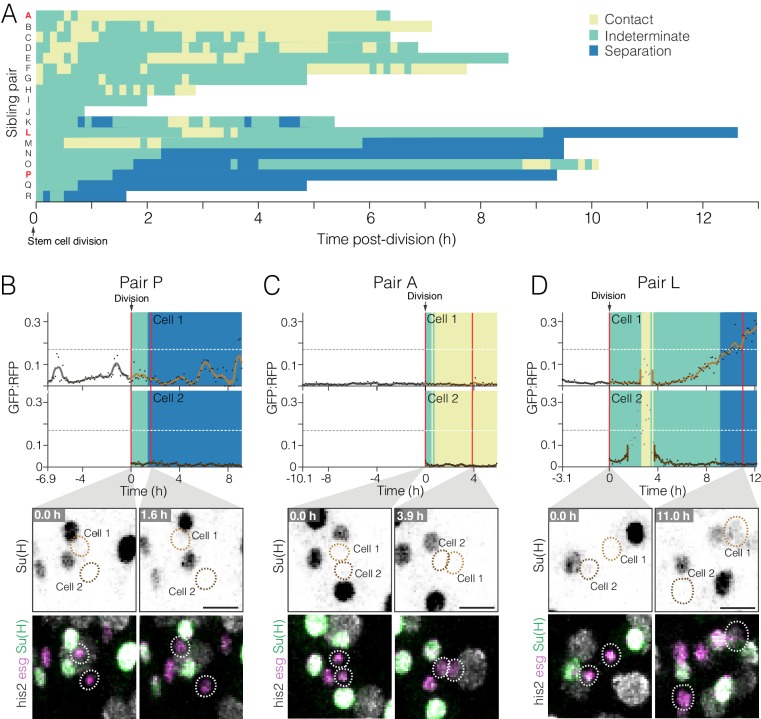
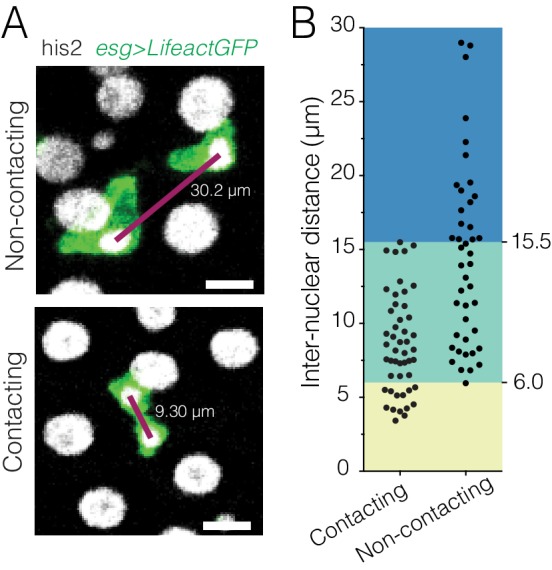
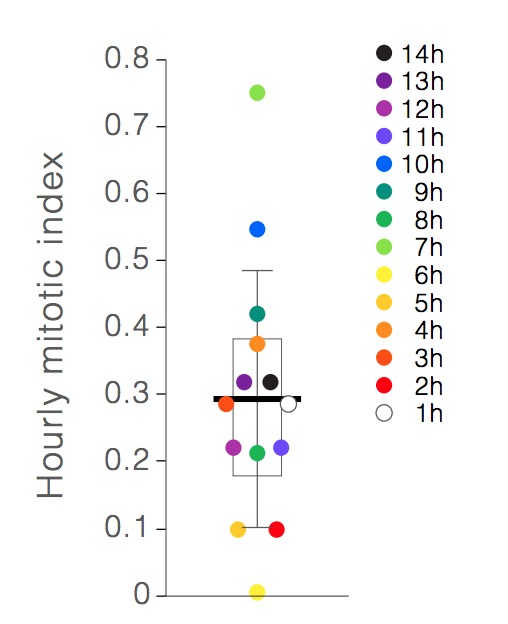
Organ renewal is governed by the dynamics of cell division, differentiation and loss. To study these dynamics in real time, we present a platform for extended live imaging of the adult Drosophila midgut, a premier genetic model for stem-cell-based organs. A window cut into a living animal allows the midgut to be imaged while intact and physiologically functioning. This approach prolongs imaging sessions to 12-16 hr and yields movies that document cell and tissue dynamics at vivid spatiotemporal resolution. By applying a pipeline for movie processing and analysis, we uncover new and intriguing cell behaviors: that mitotic stem cells dynamically re-orient, that daughter cells use slow kinetics of Notch activation to reach a fate-specifying threshold, and that enterocytes extrude via ratcheted constriction of a junctional ring. By enabling real-time study of midgut phenomena that were previously inaccessible, our platform opens a new realm for dynamic understanding of adult organ renewal.

Keywords: D. melanogaster; adult tissue homeostasis; apical extrusion; differentiation; epithelium; imaging; regenerative medicine; stem cells.


Conflict of interest statement

JM, ES, PM, LJ, SB, XD, LO No competing interests declared

Figures

Figure 1.
Figure 1.. Extended imaging of the midgut in live Drosophila adults.
(A) Adult female midgut in situ, sagittal view. The white highlighted area indicates region R4a-b, also known as P1-2, (Buchon et al., 2013a; Marianes and Spradling, 2013)) of the midgut that will be exposed for imaging. (B–C) The midgut is accessed through a small cuticular window cut in the back of a live animal. (B) (Top) Schematic of the imaging apparatus. The animal is affixed to a modified petri dish ‘mount’. The chamber of the mount contains media. The underside of the mount supports a feeder tube. See and Fig. 1-fig. supplement 2. (Bottom) Dorsal (left) and ventral (right) views of an animal in the mount. In the left panel, the exposed midgut is outlined by the magenta dotted line. Scale bars: 0.25 mm (left), 0.5 mm (right). See Video 4. (C), Steps in preparing the midgut for imaging. See Video 1 tutorial. (D–F) Registration macros are applied post-acquisition to correct the blurring caused by tissue movements. (D), Before registration, blurring and duplications (arrowheads) are evident. This panel is a raw z-series projection of one movie time point. (E), During registration, two ImageJ plugins are applied in series. (1) 'StackReg' corrects for tissue movement during z-stack acquisition at a single time point. (2) 'Correct 3D Drift' corrects for global volume movements over multiple time points. (F), After registration, blurring and duplications are negligible. Cyan, all nuclei (ubi-his2av::mRFP); yellow, stem cells and enteroblasts (esg >LifeactGFP). Scale bars, 20 μm. See Video 6.
Figure 1—figure supplement 1.
Figure 1—figure supplement 1.. Mounts for upright, inverted and light-sheet microscopes.
(A–B) Mount for upright microscopes. (A) Schematic of an animal in the mount on a microscope stage. (A′) Isometric illustrations of mount components: (1) modified petri dish, (2) metal shim with cutout for Drosophila abdomen (Fig. 1-fig. supplement 2Figure 1—figure supplement 2), (3) feeder tube, and (4) bottom chamber with wet Kimwipes (light blue). (Bottom chamber is not shown in (A).) (B) Schematic of the humidity box that encloses the mount. Unassembled (B) and assembled (B) views are shown. (C) Mount for inverted microscopes. The midgut is imaged through a glass-bottomed petri dish. To elevate the animal, two spacers are glued to the bottom of the dish, and the metal shim is affixed to the spacers. Media is added to the level of the spacers. (D) Mount for light-sheet microscopes. The barrel of a 1 ml syringe is modified to fit the metal shim. The animal and feeder tube are inside the barrel, and the dorsal surface and exposed midgut are outside the barrel. The barrel is submerged in media with one end remaining open to the air. 3D, side and end-on views are shown.
Figure 1—figure supplement 2.
Figure 1—figure supplement 2.. Specifications for abdomen cutouts.
The metal shim of the imaging mount includes a cutout through which the dorsal abdomen is inserted. ‘Fat’ (left) and ‘skinny’ (right) cutouts accommodate differently sized female abdomens. This diagram can be used as a CAD file for automated laser cutters.
Figure 1—figure supplement 3.
Figure 1—figure supplement 3.. Cell viability during extended imaging.
Cell viability during extended imaging was evaluated using the cell-death stain Sytox Green. (A) Positive control. To induce cell death, midguts were dissected out of the animals and cultured ex vivo. Sytox+ cells (green) are rare at the start of culture (0 hr) but became abundant after 2.5 hr. (B) Appearance of a Sytox+ cell during extended live imaging. In (A–B), arrowheads point to the same cells before and after becoming Sytox+. Nuclei are colored magenta (ubi-his2av::mRFP). Scale bars, 20 µm. See Video 5. (C) Timeline for the appearance of Sytox+ cells during extended live imaging of three midguts. Each vertical line marks the time at which one Sytox+ midgut cell became visible. A dot marks the end of each imaging session. Yellow box in Midgut 1 marks the timepoints that are shown in Video 5 (10.6–12 h).
Figure 2.
Figure 2.. Comprehensive, fate-specific tracking and analysis of individual cells.
(A–B) ‘Fate sensor’ midguts enable the live identification of cell types. (A) Stack projection of a single time point from a 10 hr movie (Video 7). Nuclei are distinguishable for four midgut cell types: stem cells (red pseudocolor), enteroblasts (yellow-green pseudocolor), enterocytes (gray, polyploid), and enteroendocrine cells (gray, diploid). Inset shows the zoom region depicted in (B). (B) Genetic design of the fate sensor line (esg >his2b::CFP, GBE-Su(H)-GFP:nls; ubi-his2av::mRFP). Cell types are distinguished by the combinatorial expression of three fluorescent, nuclear-localized markers: enterocytes/enteroendocrine cells (His2ab::mRFP only), stem cells (His2ab::mRFP, His2b::CFP), and enteroblasts (His2ab::mRFP, His2b::CFP, GFP:nls). All scale bars, 10 μm. (C–D) Workflow to identify, track and analyze cells in volumetric movies. (C) Nuclei from raw, multi-channel z-stacks are digitally separated into stem cell, enteroblast, and enterocyte/entero-endocrine populations using channel masks in ImageJ. (D) The three population sets are rendered in 4D in Imaris. Segmentation is performed on each population to identify individual nuclei. Enteroendocrine nuclei are separated from enterocyte nuclei by a size filter. The positions of individual nuclei are correlated between time points to track single cells over time.
Figure 3.
Figure 3.. Real-time kinetics of enterocyte extrusion and stem cell mitosis.
(A–E) Morphometric analysis of a single-enterocyte extrusion. (A) Time-lapse sequence (top) and schematic (bottom) showing a planar view of an extrusion event. The basal region of the extruding cell (tan pseudocolor) is outlined by a six-sided ‘ring’ of E-cadherin::YFP (inverted gray, ubi-DE-cadherin::YFP). Over time, the basal ring closes to a point, and the six neighbor cells (green in schematic) draw into a rosette. The time-lapse images are stack projections. Cyan (ubi-his2av::mRFP) labels all nuclei. See Video 8. (B) Spatial ‘footprint’ of the E-cadherin::YFP ring in the epithelial plane over time (violet-yellow color scale). The ring remains six-sided throughout closure. (C) Ring closure occurs via ratcheted constrictions. During ring closure, pulses of constriction (shaded background) are interrupted by pulses of relaxation (unshaded background). See Figure 3—figure supplement 1. (D) Kinetics of apical travel. Displacements of the junctional ring (purple) and the cell nucleus (red) are shown over time for the extrusion in (A). The ring (purple trace) advances incrementally via small, apical-and-basal movements. The nucleus (red trace) ejects rapidly into the lumen, then recoils. Apical nuclear travel starts at t = 150 min and ends at t = 263 min (dotted vertical lines). (E) Orthoview of the extrusion depicted in (A). The multicolored line shows the path of the nucleus over time (violet-yellow color scale). Magenta box denotes the E-cadherin::YFP ring, which is visible in this time point (t = 285 min) as a density of YFP at the apical surface. Inverted gray, E-cadherin::YFP (ubi-DE-cadherin::YFP); cyan, all nuclei (ubi-his2av::mRFP). See Video 9. (F) Durations of apical nuclear travel for 18 single-enterocyte extrusions from six movies. Apical travel lasted 37–112 min with a mean ± standard deviation (SD) of 64 ± 18 min. (G–H) Kinetics of stem cell mitoses. (G) Time-lapse sequence of a mitotic event. Green, actin (esg >LifeactGFP); yellow, E-cadherin (ubi-DE-cadherin::YFP); red, nuclei (ubi-his2av::mRFP). Panels are partial stack projections of the basal epithelium. See Video 11. (H) Durations of mitosis for 39 cell divisions from 11 movies. Mitoses lasted from 30 to 60 min with a mean ± SD of 43 ± 11 min. All scale bars, 10 μm.
Figure 3—figure supplement 1.
Figure 3—figure supplement 1.. Enterocyte extrusion occurs via ratcheted constriction of a basal junctional ring.
(A–C) Cross-sectional area of the basal junctional ring over time for three enterocyte extrusions (blue, green, red). Pulses of ring constriction (colored background) alternate with pulses of ring stabilization or relaxation (uncolored background). (A'–C') Rates of change in ring area over time. Rings fluctuate between pulses of constriction (negative values) and pulses of stabilization (near-zero) or relaxation (positive values). Rates of constriction are generally higher than rates of relaxation. (D) Side-by-side comparison of ring area over time for the extrusions in (A–C). The initial area of the ring does not correlate with the overall time required for complete closure (Figure 3—figure supplement 1-source data 1). The blue extrusion in ( A) and (D) is identical to that in Figure 3A–E and Videos 8–9.
Figure 4.
Figure 4.. Real-time orientations of stem-cell divisions in three reference frames.
(A–E) Horizontal-vertical orientations are horizontally biased. (A) Schematic of horizontal (0°) and vertical (90°) orientations. See Figure 4—figure supplement 1. (B) Live orientations of 10 dividing cells specifically at cytokinesis. The distribution is biased toward horizontal (<45°). The red point represents the cell in (D). (C) Live orientations of the same 10 cells throughout mitosis. Each measurement is the orientation of one mitotic cell at one time point, from metaphase to cytokinesis (n = 51 measurements). The distribution is biased toward horizontal (<45°). (D) Two re-orientations in a single mitosis. The red line shows the orientation of condensed chromatin (gray, ubi-his2ab::mRFP) relative to the basal basement membrane (cyan, Concanavalin A-Alexa-647). For clarity, in the 7.5 min and 15 min projections, a clipping plane was applied in the gray channel to exclude an enterocyte nucleus; this nucleus is marked by an asterisk at the left edge of the 30 min projection. Scale bar, 5 µm. See Video 12. (E) Mitotic cells frequently re-orient. Each line shows the horizontal-vertical orientations of a single mitotic cell over time. The 10 cells are the same as those in (B) and (C). All lines start at metaphase (t = 0 min) and continue until cytokinesis (t = 30–60 min). Time intervals were either 5, 7.5, or 15 min. Colors are the same as those in (B); the red line represents the orientation of the cell in (D). (F–H) Longitudinal-circumferential orientations are unbiased. (F) Schematic of longitudinal (0°) and circumferential (90°) orientations. (G–H) Live orientations of 38 dividing cells at cytokinesis. Longitudinal (≤45°) and circumferential (>45°) orientations are near-equal. (I–K) Divisions between two flanking enteroblasts align with the enteroblast-enteroblast axis. (I) Schematic of divisions contacting either two or one enteroblast(s). When two enteroblasts are present, the closer enteroblast is used for measurements (see 'Materials and methods'). (J) Division between two enteroblasts. Orientation is nearly parallel to the axis between the enteroblast nuclei (magenta, GBE-Su(H)-GFP:nls). Gray, stem cell and enteroblast nuclei (esg >his2b::CFP). Scale bar, 10 µm. See Video 14. (K) Live orientations of divisions with two or one flanking enteroblast(s). With two enteroblasts (n = 4 of 18 divisions), orientations are near-parallel to the enteroblast-enteroblast axis. With one enteroblast (n = 11 of 18 divisions), orientations are broadly distributed. Orientations were measured at cytokinesis. Means ± SD are shown. Mann-Whitney test, p=0.01.
Figure 4—figure supplement 1.
Figure 4—figure supplement 1.. Measurement of horizontal-vertical spindle orientation in space.
Horizontal-vertical orientation of the mitotic spindle was measured as the angle at which the presumptive spindle axis intersected a plane tangent to the basal surface of the mitotic cell. Spindle axes and basal planes were determined by examination of volumetric movies in Imaris. To establish coordinates for the spindle axis (red line), two points (red dots) were placed relative to the condensed chromatin (ubi-his2ab::mRFP). To establish coordinates for the basal plane (blue rectangle), three points (blue dots) were placed on the basal epithelial surface underlying the spindle. The (x,y,z) coordinates of these five points were input into a vector algebra expression to calculate the horizontal-vertical spindle angle (see 'Material and methods').
Figure 5.
Figure 5.. Whole-population and single-cell analyses of real-time Notch activation.
(A–C) A threshold level of Notch activation distinguishes stem cells and enteroblasts. (A) Single-cell measurements of the Notch reporter GBE-Su(H)-GFP:nls from live movies. Cells additionally co-express esg >his2ab::CFP (magenta) and ubi-his2ab::mRFP (gray). GBE-Su(H)-GFP:nls activation is quantified as GFP:RFP (see 'Materials and methods'). For the indicated cells, GFP:RFP = 0.94, 0.27, and 0.01, respectively. (B) GFP:RFP values correlate with visible GFP and nuclear volume. Progenitor (esg+) cells were scored by eye as either GFP-negative (top) or -positive (bottom). In cells without visible GFP, nearly all GFP:RFP values cluster between 0.0 and 0.2, and most nuclear volumes are small (<200 µm3). In cells with visible GFP, most GFP:RFP values are spread between 0.1 and 1.4, and large nuclear volumes (≥200 µm3), indicative of late enteroblasts, are associated with high GFP:RFPs. The blue dotted lines show the 0.17 enteroblast threshold from (C). (C) GFP:RFP values quantitatively distinguish stem cells and enteroblasts. Gray bars show real-time GFP:RFPs for all esg+ cells in two movies (29,102 GFP:RFPs from 251 cells). Two peaks (GFP:RFP = 0.015, 0.528) are separated by a local minimum (blue dotted line; GFP:RFP = 0.17). Purple bars (C’ inset) show real-time GFP:RFPs for ‘benchmark’ stem cells prior to an observed mitosis (1,294 GFP:RFPs from 18 pre-mitotic cells). The benchmark stem cell distribution matches the left peak of the esg+ cells, and 99.6% of ‘benchmark’ GFP:RFPs are less than 0.17. Data in (B) and (C) are aggregated from two movies. (D–E) Stem-like cells transition to enteroblasts over multiple hours. (D) Real-time activation of GBE-Su(H)-GFP:nls reveals a transition from a stem-like to an enteroblast state. During a transition period lasting 6.9 hr (gray background), GFP:RFP increases from a baseline of ~0.049 at t = 3.5 hr to the enteroblast threshold of 0.17 (blue dotted line) at t = 10.4 hr. After the transition, GFP:RFP continues to increase and reaches 0.364 at t = 15.0 hr. GBE-Su(H)-GFP:nls shown in green (top) and inverted gray (bottom); esg >his2ab::CFP, magenta; ubi-his2ab::mRFP, gray. See Video 15. (E) Kinetics of three additional enteroblast transitions. Initial baseline GFP:RFPs are <0.17. GFP:RFPs increase from baseline to 0.17 during transition periods lasting from 2.3 to 6.9 hr (gray backgrounds: t = 0.3–7.1 hr (top), 10.0–12.4 hr (middle), 9.5–11.8 hr (bottom)). Initial and final GFP:RFPs are as follows: 0.058, 0.426 (top); 0.069, 0.281 (middle); 0.022, 0.257 (bottom). All cells in (D) and (E) were born before imaging started. Genotype in all panels: esgGal4, UAS-his2b::CFP, Su(H)GBE-GFP:nls; ubi-his2av::mRFP. All scale bars are 5 µm.
Figure 6.
Figure 6.. Dynamics of cell contact and Notch reporter activation in sibling cells after birth.
(A) Contacts between newborn siblings are highly variable. Eighteen pairs of sibling cells (rows A–R) were tracked from birth (t = 0.0 hr) to the end of imaging. Color shows the likelihood of sibling–sibling contact based on inter-nuclear distance (Figure 6—figure supplement 1): yellow, inferred contact (inter-nuclear distance <6.0 µm); green, indeterminate (inter-nuclear distance = 6.0–15.5 µm); blue, inferred separation (inter-nuclear distance >15.5 µm). Pairs are ordered from highest A to lowest P contact. Pairs A, L, and P (red labels) are featured in (C), (D), and (B), respectively. (B–D) Contacts between siblings do not correlate with real-time GBE-Su(H)-GFP:nls activation. Graphs show real-time contact status (background colors same as A) and GFP:RFP ratios. Sibling birth is at t=0.0 h. Red vertical lines are the time points shown in the bottom images. (B) Low-contact pair P does not exhibit persistent activation of GBE-Su(H)-GFP:nls. (C) High-contact Pair A does not exhibit persistent activation of GBE-Su(H)-GFP:nls. (D) Indeterminate-low contact Pair L exhibits persistent activation of GBE-Su(H)-GFP:nls in one sibling. The Pair L siblings are probably in contact from t=2.6–3.6 h and are probably separated after t=9.1 h. Note that between t=2.6–3.5 h (Cell 1) and t=1.5–3.6 h (Cell 2), GFP:RFP measurements (grayed dots) are artifactually high because the two cells collide with a third cell, which was a mature enteroblast (Video 18). Because of the intimate proximity between the mature enteroblast and the Pair L siblings during the collision, the high GFP signal of the enteroblast bled over into the surfaces for Cells 1 and 2. The duration of artifactual bleed-over is indicated by gaps in the cells’ interpolated GFP:RFP lines. Genotypes for all panels: esgGal4, UAS-his2b:CFP, Su(H)GBE-GFP:nls; ubi-his2av::mRFP. All scale bars are 10 µm. See Videos 16–18.
Figure 6—figure supplement 1.
Figure 6—figure supplement 1.. Comparison of cell-cell contact and inter-nuclear distance for live pairs of progenitor cells.
(A) Examples of contacting and separated progenitor pairs. Contact is revealed using esg-driven LifeactGFP (green) to label the actin cytoskeleton of progenitor cells. Inter-nuclear distances (purple lines) are the distances between the centroids of the two nuclei (gray). Images are projections of single time points; but contact and inter-nuclear distances were assessed in volumetric space. Scale bars, 10 µm. (B) Inter-nuclear distances of contacting and separated pairs. All pairs with inter-nuclear distances <6.0 µm (yellow background) are in contact (26% of all contacting pairs). Pairs with inter-nuclear distances from 6.0 to 15.5 µm (green background) are split between contacting and separated (73% of all contacting pairs; 58% of all separated pairs). All pairs with inter-nuclear distances >15.5 µm (blue background) are separated (42% of all separated pairs). These three ranges are used in Figure 6 to infer the probable contact behavior of esg+ + pairs that express only nuclear markers (inter-nuclear distance <6.0 µm, probable contact; 6.0–15.5 µm, indeterminate;>15.5 µm, probably separated). n = 49 contacting and 43 separated pairs. Pairs were designated as two esg+ + that were mutually closer to each other than to any other esg+ + and were selected randomly from single time points of four movies. Genotype: esgGal4, UAS-LifeactGFP; ubi-his2av::mRFP.
Author response image 1.
Author response image 1.. Hourly mitotic indices.
Individual points show the mitotic index for hours 1-14 of live imaging. Earlier hours are denoted by lighter colors, and later hours are denoted by darker colors. Box shows the mean of the hourly indices (bar) and the first and third quartiles (0.18% and 0.38%). Whiskers show the standard deviation (0.19%). No correlation between mitotic index and imaging hour is observed.

References

    1. Antonello ZA, Reiff T, Ballesta-Illan E, Dominguez M. Robust intestinal homeostasis relies on cellular plasticity in enteroblasts mediated by miR-8-Escargot switch. The EMBO Journal. 2015;34:2025–2041. doi: 10.15252/embj.201591517. - DOI - PMC - PubMed
    1. Arganda-Carreras I, Sorzano COS, Marabini R, Carazo JM, Ortiz-de-Solorzano C, Kybic J. Consistent and elastic registration of histological sections using vector-spline regularization. In: Beichel RR, Sonka M, editors. Computer Vision Approaches to Medical Image Analysis. CVAMIA 2006. Lecture Notes in Computer Science. 4241. Berlin, Heidelberg: Springer; 2006a. pp. 85–95.
    1. Arganda-Carreras I, Sorzano COS, Marabini R, Carazo JM, Ortiz-de-Solorzano C, Kybic J. Consistent and Elastic Registration of Histological Sections Using Vector-Spline Regularization. Lecture Notes in Computer Science. 2006b:85–95.
    1. Balleza E, Kim JM, Cluzel P. Systematic characterization of maturation time of fluorescent proteins in living cells. Nature Methods. 2018;15:47–51. doi: 10.1038/nmeth.4509. - DOI - PMC - PubMed
    1. Barad O, Rosin D, Hornstein E, Barkai N. Error minimization in lateral inhibition circuits. Science Signaling. 2010;3:ra51. doi: 10.1126/scisignal.2000857. - DOI - PubMed

Publication types

Substances

LinkOut - more resources