. 2018 Nov 14:7:e41115.
doi: 10.7554/eLife.41115.

High-resolution mapping of fluoroquinolones in TB rabbit lesions reveals specific distribution in immune cell types

Affiliations

High-resolution mapping of fluoroquinolones in TB rabbit lesions reveals specific distribution in immune cell types

Landry Blanc et al. Elife. .

Abstract

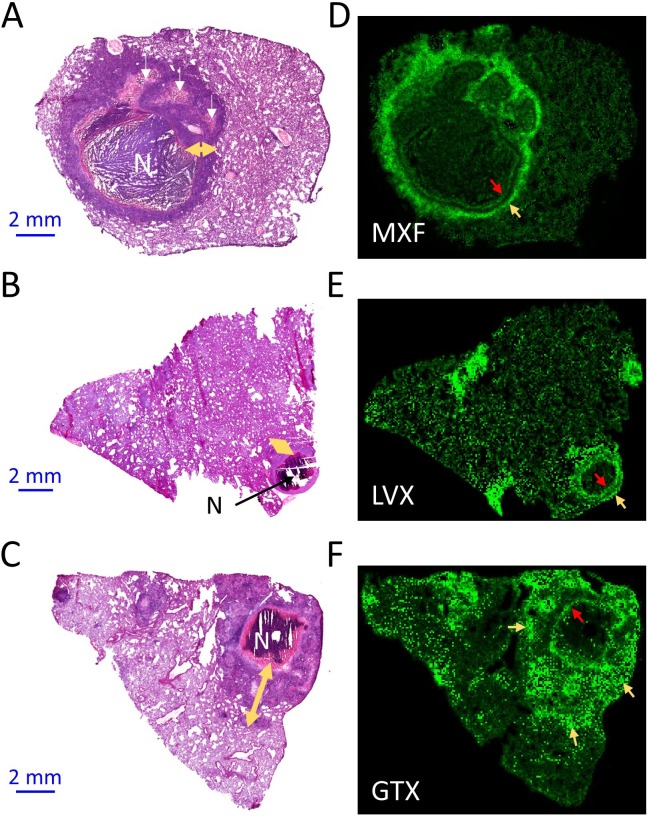
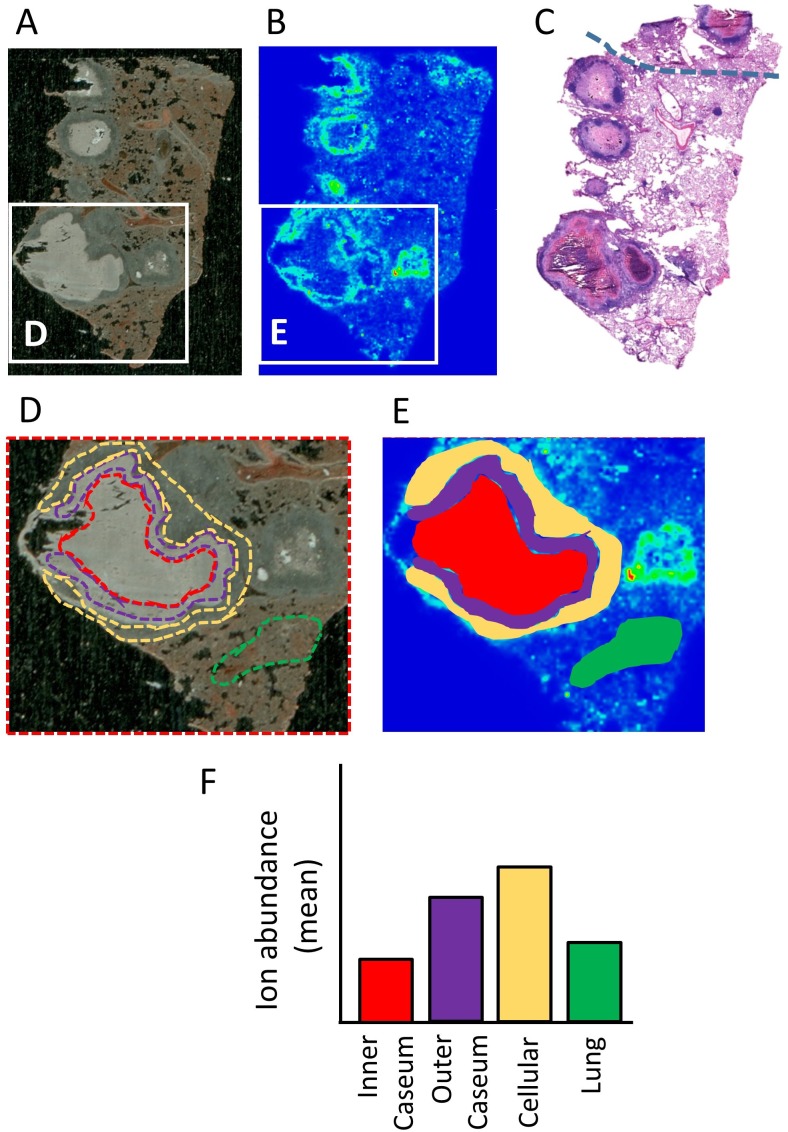
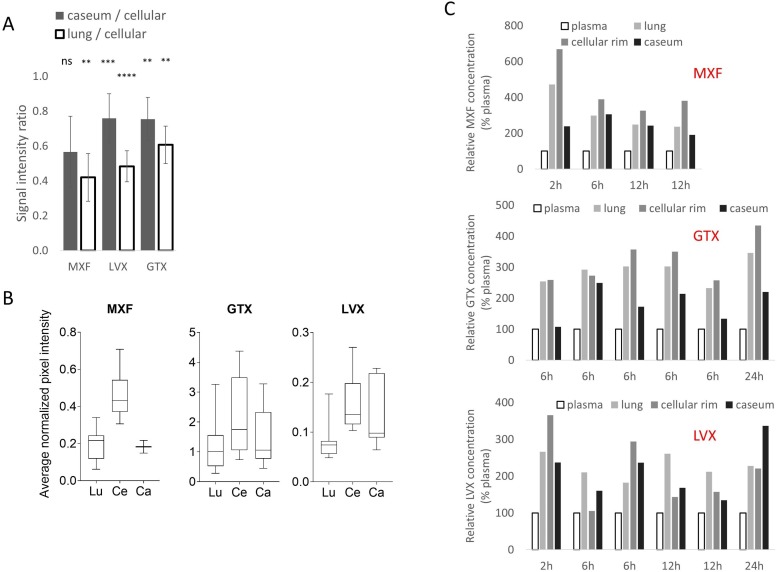
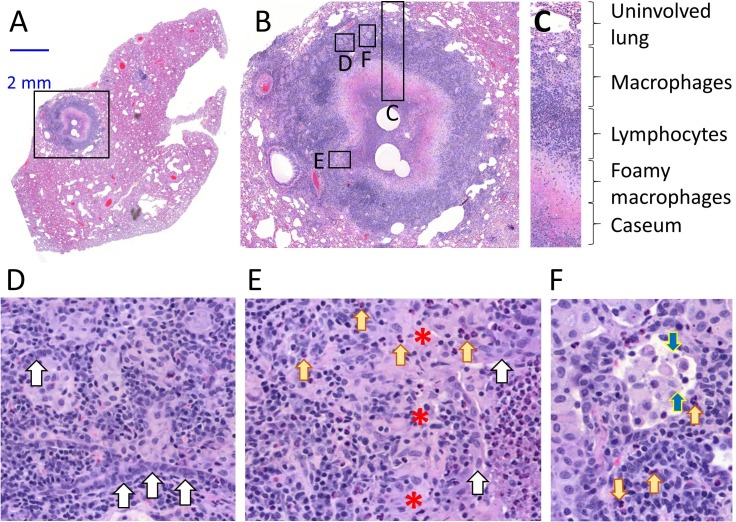
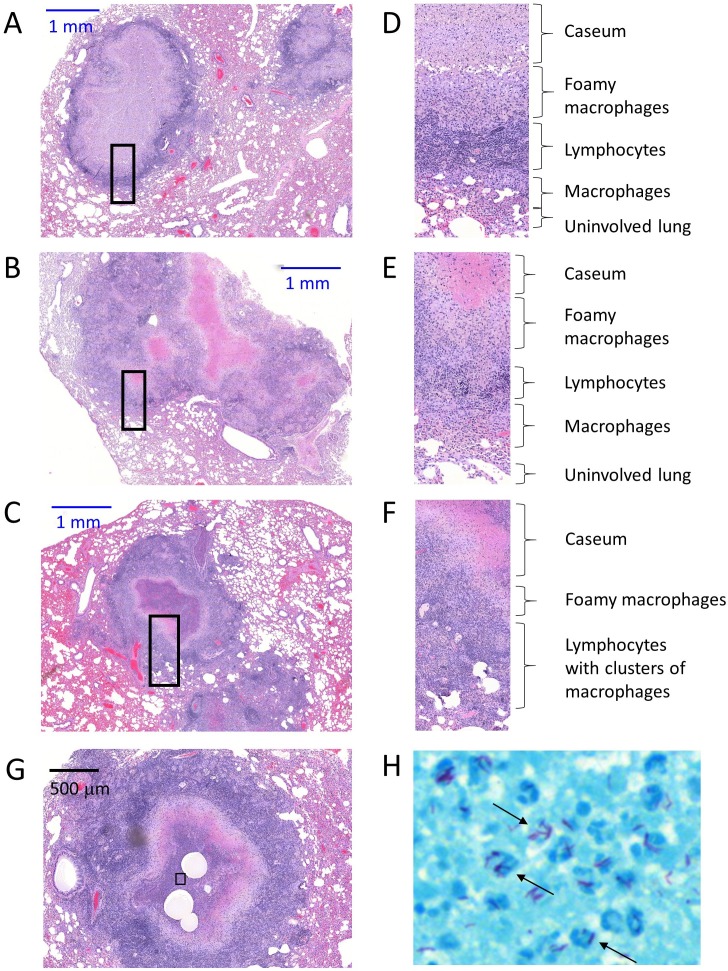
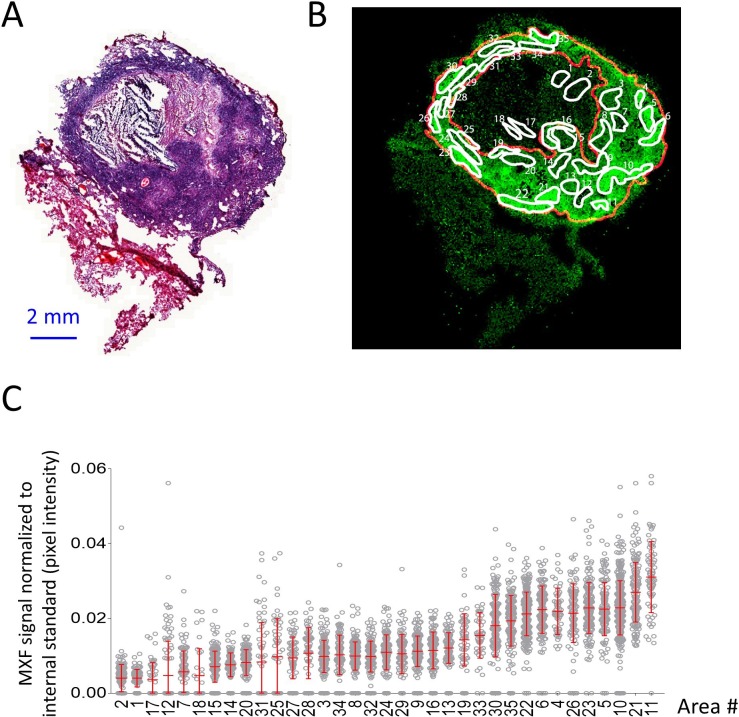
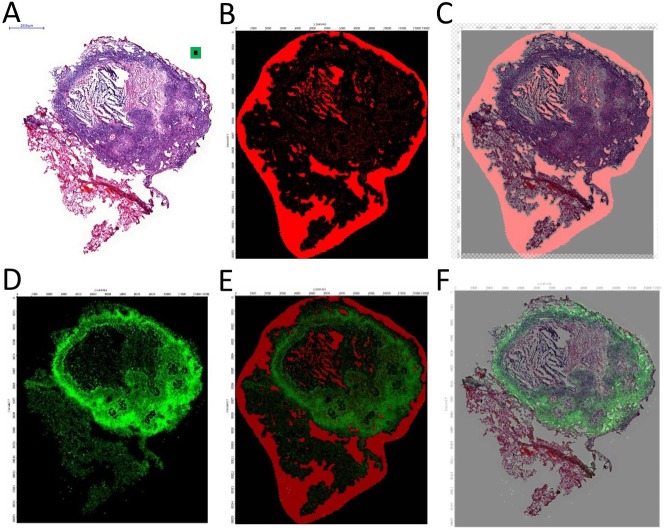
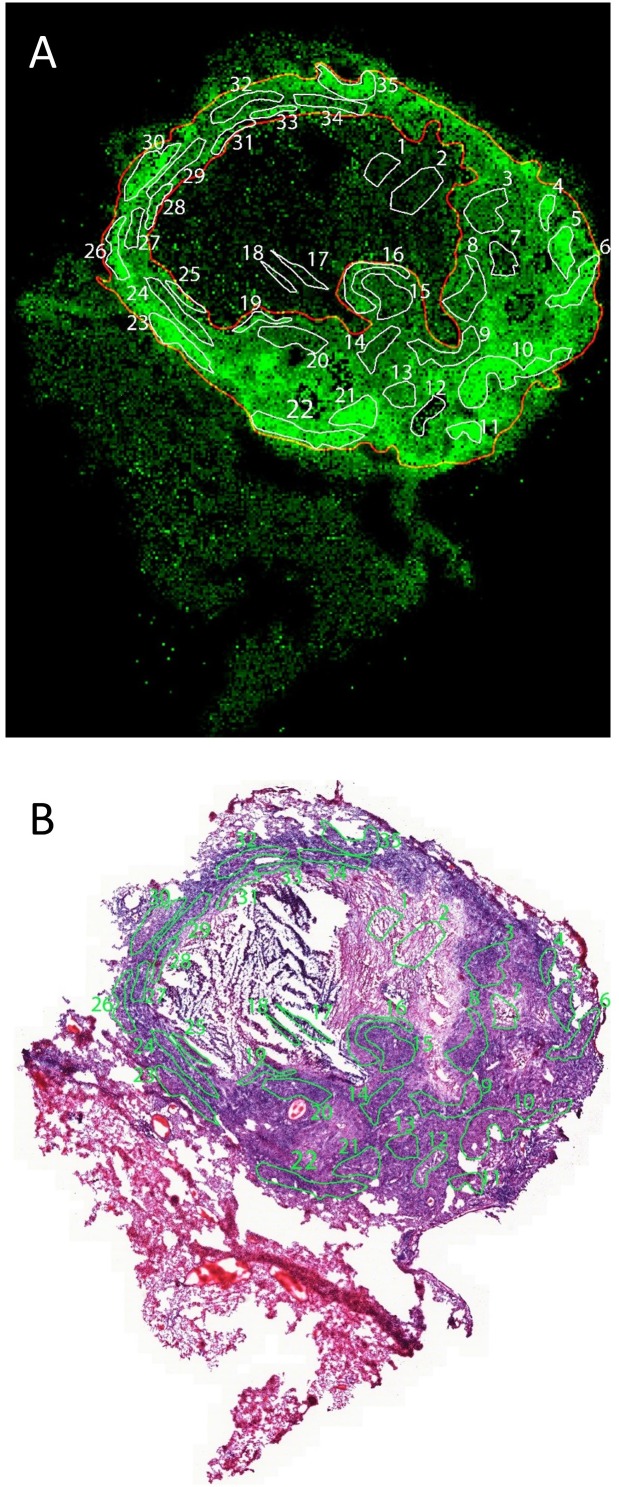
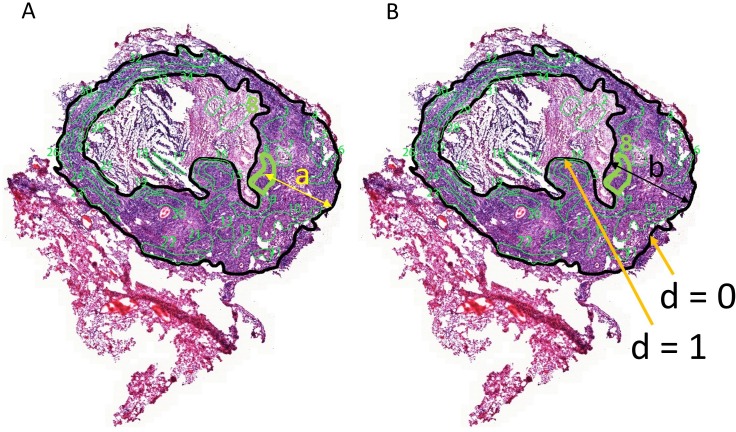
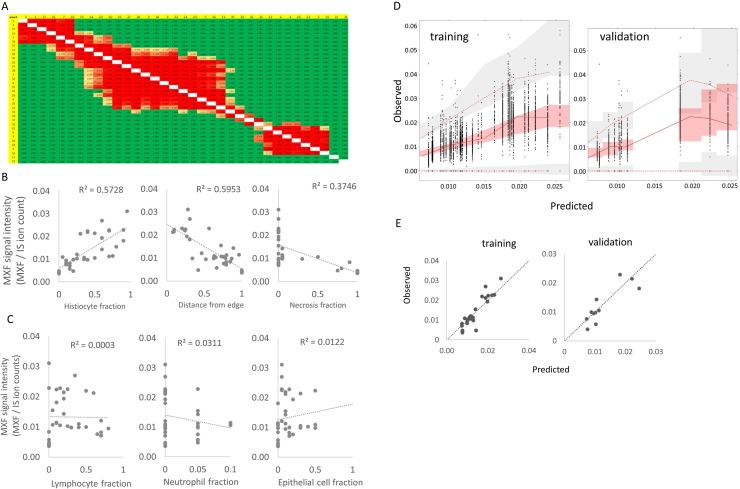
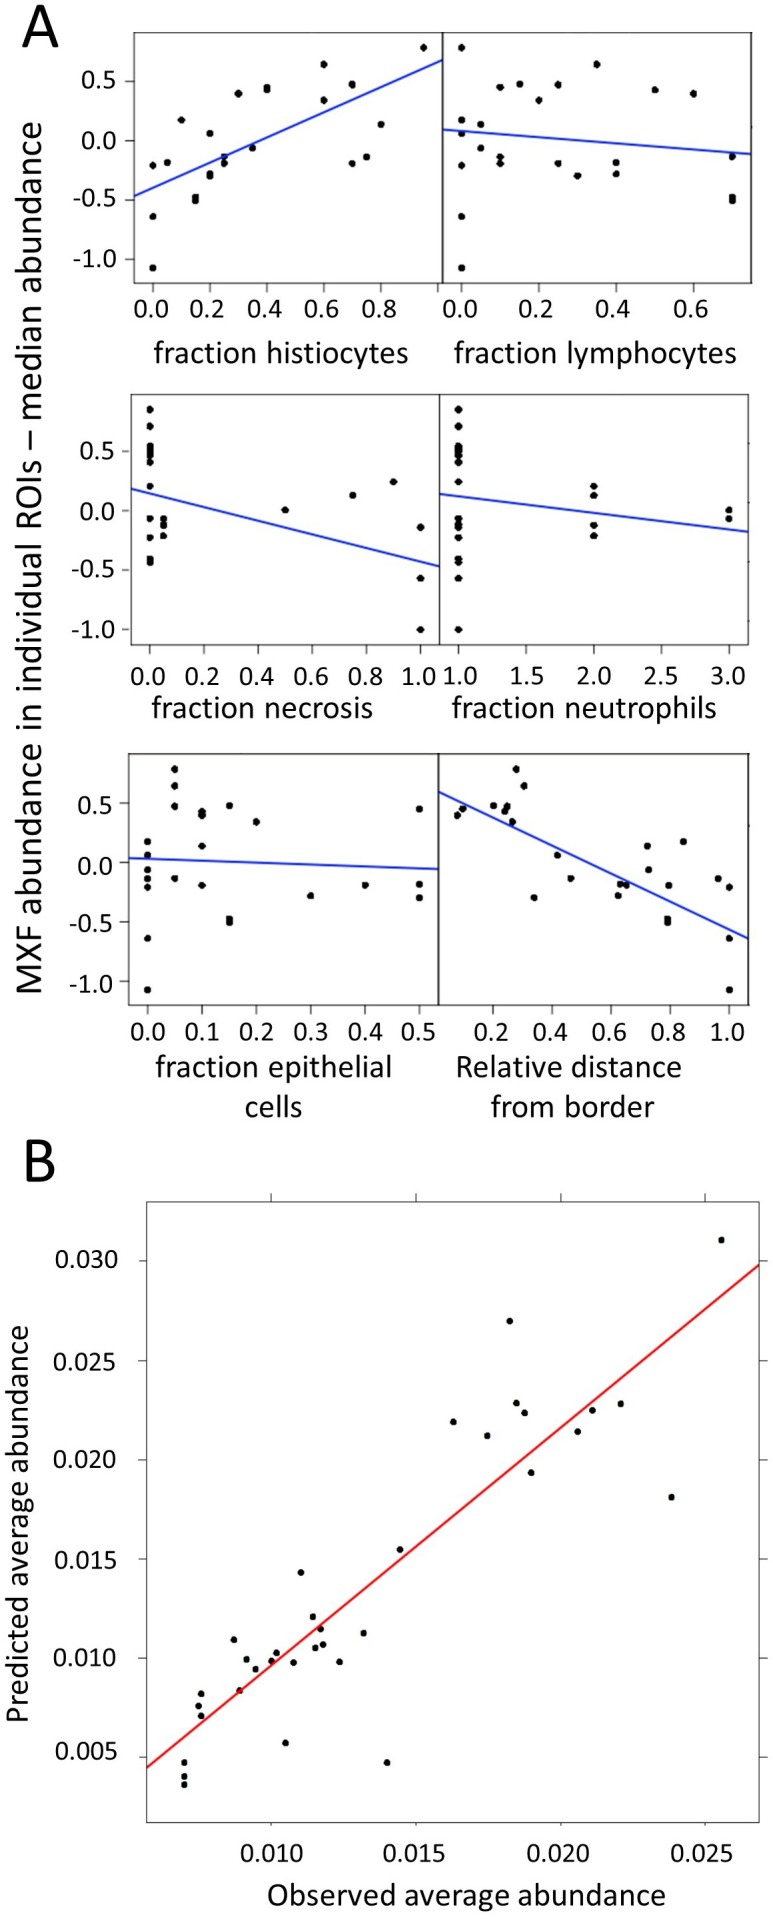
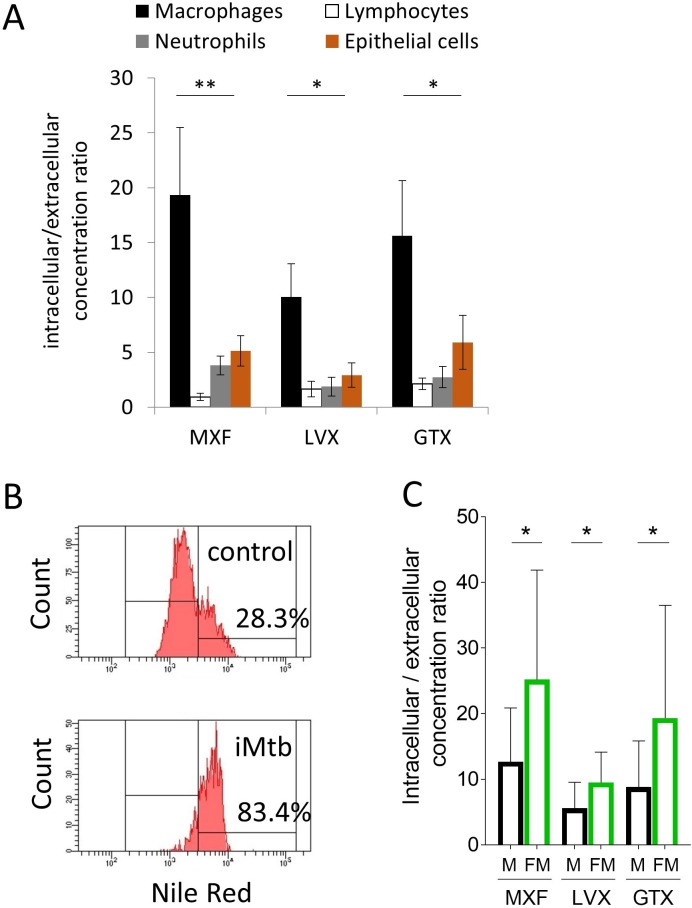
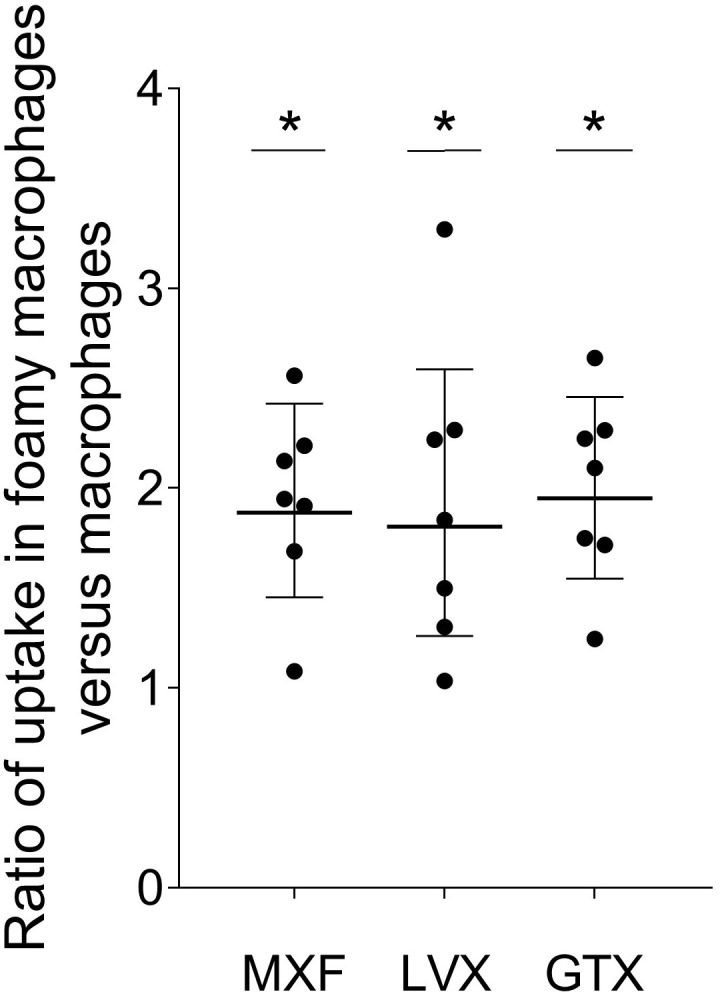
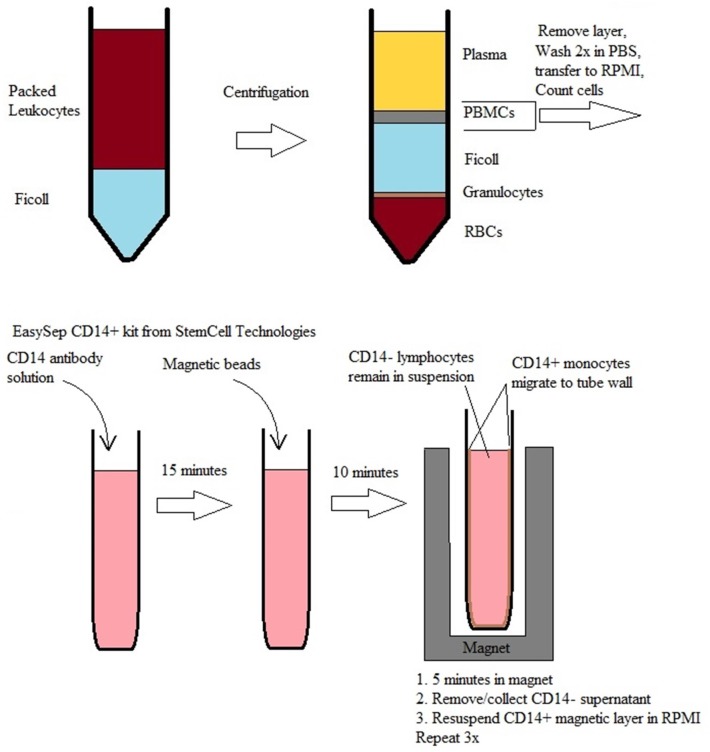
Understanding the distribution patterns of antibiotics at the site of infection is paramount to selecting adequate drug regimens and developing new antibiotics. Tuberculosis (TB) lung lesions are made of various immune cell types, some of which harbor persistent forms of the pathogen, Mycobacterium tuberculosis. By combining high resolution MALDI MSI with histology staining and quantitative image analysis in rabbits with active TB, we have mapped the distribution of a fluoroquinolone at high resolution, and identified the immune-pathological factors driving its heterogeneous penetration within TB lesions, in relation to where bacteria reside. We find that macrophage content, distance from lesion border and extent of necrosis drive the uneven fluoroquinolone penetration. Preferential uptake in macrophages and foamy macrophages, where persistent bacilli reside, compared to other immune cells present in TB granulomas, was recapitulated in vitro using primary human cells. A nonlinear modeling approach was developed to help predict the observed drug behavior in TB lesions. This work constitutes a methodological advance for the co-localization of drugs and infectious agents at high spatial resolution in diseased tissues, which can be applied to other diseases with complex immunopathology.

Keywords: MALDI mass spectrometry imaging; drug distribution; fluoroquinolones; infectious disease; microbiology; rabbit model; tuberculosis.


Conflict of interest statement

LB, ID, BP, PC, MZ, AM, RS, BP, VD No competing interests declared

Figures

Figure 1.
Figure 1.. Spatial distribution of fluoroquinolones in infected rabbit lung and lesions.
(a–b–c) Hematoxylin and Eosin (H and E) histology staining of lesions and surrounding lung tissue resected from rabbits that received a single dose of moxifloxacin (MXF) (a), levofloxacin (LVX) (b) or gatifloxacin (GTX) (c). N: necrotic core; white arrows: early caseating foci; yellow double arrows: cellular rim encompassing mostly lymphocytes, macrophages, foamy macrophages, interspersed epithelial cells and neutrophils. Panels d-e-f show the corresponding MALDI-MS ion maps of each drug in a tissue section adjacent to the one stained by H and E. Red arrows highlight the inner drug accumulation ring subtending the caseous core; yellow arrows highlight outer rings or pockets of higher drug abundance further outward from the core.
Figure 1—figure supplement 1.
Figure 1—figure supplement 1.. Schematic of the workflow for the relative quantitation of drug ions in specific areas delineated on MALDI ion maps.
(A–B) Optical and MALDI MS images of one rabbit lesion section collected following a single dose of MXF. (C) H and E staining of the adjacent section showing the position of necrotic lesions. The grey dotted line indicates the region that ruptured upon sectioning in (A–B). (D) Areas that encompass uninvolved lung (green), cellular rim (yellow), outer caseum (purple) and inner caseum (red) are first delineated on the optical image. (E) The optical image and MALDI ion map are superimposed and each colored area is redrawn on the ion map. (F) The software Quantinetix from ImaBiotech (France) is used to quantify the signal intensity (ion abundance) of the drug of interest in each area.
Figure 1—figure supplement 2.
Figure 1—figure supplement 2.. Relative quantitation of the fluoroquinolones in infected rabbit lung and lesion compartments.
(A) Relative quantitation of moxifloxacin (MXF), levofloxacin (LVX) and gatifloxacin (GTX), in caseum and uninvolved lung relative to the cellular rim, determined from MALDI ion maps using ImaBiotech Software Quantinetix (v 1.7, Loos, France). Areas of interest encompassing uninvolved lung, cellular rim, and caseum were delineated by first aligning and superimposing the MALDI MS image over the optical scan of the tissue. The MS image layer was made transparent and the areas were drawn based upon the optical scan. The average drug abundance [ion count of drug/ion count of internal standard] ratios between caseum and cellular rim or uninvolved lung and cellular rim are shown. To detect statistically significant differences between signal intensities in lung versus cellular lesion, and cellular lesion versus caseum, the data were analyzed using the Wilcoxon matched-pairs signed rank test. *p<0.05, **p<0.01, ***p<0.001, ****p<0.0001. (B) Absolute measurements of average fluoroquinolone pixel intensities, normalized to internal standard, which were used to calculate the intensity ratios shown in (A). (C) Spatial quantitation of MXF, GTX and LVX in and around necrotic granulomas at different times following a single oral dose in rabbits with active TB, relative to plasma concentrations at the time of lesion dissection. Uninvolved lung tissue, cellular rim and central caseum of necrotic lesions were isolated by laser-capture microdissection and analyzed by HPLC coupled to mass spectrometry (LC-MS/MS). Plasma concentrations were determined by standard LC-MS/MS.
Figure 2.
Figure 2.. Architecture and cellular composition of typical necrotic rabbit granuloma.
(A) H and E histology staining of a large cavitating necrotic granuloma and surrounding lung tissue, obtained from a rabbit infected with M. tuberculosis HN878 for 12 weeks. (B) Magnification of the region highlighted in a, showing the areas magnified in panels c through f. (C) Typical concentric cellular layers found in mature necrotic granulomas. (D) Magnification of the outer cellular layer showing epithelial cells that form ribbons or rings inside areas of immune cell infiltration (white arrows). (E) Magnification of the inner cellular layer showing residual epithelial lining of airway remnants (white arrows), fibrous connective tissue (red asterisks) and interspersed neutrophils (yellow arrows). (F) Magnification of the macrophage rich layer showing individual macrophage cell death (blue arrows) and isolated neutrophils (yellow arrows), surrounded by residual airway epithelium.
Figure 2—figure supplement 1.
Figure 2—figure supplement 1.. Architecture and cellular composition of typical necrotic rabbit granulomas.
(A–B–C) H and E histology staining of large necrotic granulomas and surrounding lung tissue, obtained from rabbits infected with M. tuberculosis HN878 for 12 to 16 weeks. (D–E–F) Corresponding magnification of the regions highlighted in A-B-C, showing the typical concentric cellular layers found in mature necrotic granulomas. (G–H) H and E staining of an early cavity and corresponding Ziehl-Neelsen acid fast staining of the caseous region highlighted in (G) showing large numbers of Mtb bacilli (black arrows) associated with mostly karyorrhectic neutrophils or dying neutrophils as evidenced by irregularly distributed chromatin throughout the cytoplasm (H).
Figure 3.
Figure 3.. Heterogeneous distribution of MXF in the cellular cuff of a necrotic lesion.
(A) H and E staining of a cavitating necrotic granuloma. (B) Ion map of moxifloxacin (MXF) [M + H]+obtained by MALDI mass spectrometry imaging of the same section, according to the workflow and procedure described in Figure 3—figure supplement 4; (C) relative MXF abundance in 35 sub-areas delineated in the cellular rim of the MXF ion map shown in b (Contours of the 35 sub-areas are shown in Figure 3—figure supplement 2). Each dot represents the signal intensity of individual pixels in the ion map shown in (B). Pixel intensity mean and standard deviation are shown for each area. The number of pixel per sub-area ranged from 48 to 429 (48 < n < 429). Raw data can be found in Figure 3—source data 1).
Figure 3—figure supplement 1.
Figure 3—figure supplement 1.. Workflow for overlaying MALDI-MSI and histology images.
(A) H and E stained tissue, obtained from the same section used for MALDI MS imaging, after washing of the DHB matrix; (B) Map of matrix ion m/z 362,217, a matrix-related peak highly abundant outside of the tissue and used to revealed contours of the tissue border and hollow bronchioles within; (C) Alignment of the matrix ion and H and E images; (D) Moxifloxacin [M + K]+ion image (m/z 440,138 normalized to internal standard MXF-d4 m/z 444,1638); (E) Normalized MXF image aligned with the matrix marker image using the Thermo ImageQuest image ruler; (F) MXF intensity map aligned and overlaid with H and E image of the same section.
Figure 3—figure supplement 2.
Figure 3—figure supplement 2.. Regions of interest in MALDI-MSI MXF ion map (A) and histology staining (B) of the same section.
Thirty-five ROIs were delineated on the MXF ion map and superimposed onto the image of the H and E stained section as described in Blanc et al., 2018.
Figure 3—figure supplement 3.
Figure 3—figure supplement 3.. Correlations between MXF abundance, distance to edge of granuloma and cell types.
(A–B) Description of the method used to measure the distance of each area to the outer edge of the granuloma, relative to the total distance between the inner and outer edges of the cellular rim (d = a/b). This measure was used since the thickness of the cellular rim is not constant, and vascular efficiency was shown to decrease as the distance from granuloma edge increases (Datta et al., 2015). Region #8 is used to illustrate the method. (A) Distance a (yellow arrow) was measured from the centroid (https://en.wikipedia.org/wiki/Centroid#Centroid_of_polygon) of each area to the nearest point on the outer edge (black contour line) of the granuloma. (B) A straight line was then drawn from the nearest point on the outer edge, through the centroid, and all the way to the inner edge of the cellular rim (black contour line), at the border with caseum (black arrow, distance b). The ratio between a and b was used as the relative distance to the outer border of the granuloma, a surrogate of vascular efficiency. Thus d is maximum (=1) at the cellular/caseum interface, and d = 0 at the outer edge of the granuloma.
Figure 3—figure supplement 4.
Figure 3—figure supplement 4.. Identification of the drivers of moxifloxacin distribution in cellular lesion compartments.
(A) Statistical analysis of MXF relative abundance per area: average pixel intensities in each ROI were compared using a one-way analysis of variance (ANOVA) comparing the mean MXF pixel intensity in each of the 35 areas, and a Tukey post-hoc test for multiple comparisons. The number of pixels per ROI ranged from 48 and 429. Green cells indicate comparisons with p≤0.05. (B) Plots of the Spearman rank correlations between MXF abundance and the fraction of histiocytes (including macrophages and foamy macrophages), relative distance of ROI to granuloma edge and fraction of necrosis. The method used to measure the relative distance of each sub-area to granuloma edge, a surrogate of vascular efficiency, is described in Figure 3—figure supplement 3. (C) Plots of Spearman rank correlations between MXF abundance and fraction of lymphocytes, neutrophils, and epithelial cells. (D) Visual Predictive checks of the final model developed on the training dataset (left), and internal validation showing predicted MXF abundance using ROI-specific measurements of histiocytes, distance ratio and % necrotic cells in the final model equation. MXFabundance=θ1×eθ2×(Histiocytes%-0.35)×eθ3×(DistanceRatio-0.65)×(1+θNecrosis) where θ1-3andθnecrosis are model estimated constants and are reported in supplementary file 1 The lines and shaded areas in D are as follows: continuous red line: observed data median; dotted red line: 5th and 95th percentile of the observed data; light red shaded area: predicted median with uncertainty; light grey shaded area: predicted percentiles of the data with uncertainty. (E) Visual Predictive Checks (VPC) similar to the plots described in (D) but showing only the median signal intensity for each ROI. Dotted line: line of identity.
Figure 4.
Figure 4.. Modeling of MXF abundance as a function of histology parameters (raw data can be found in Figure 4—source data 1).
(A) Diagnostic plots of Empirical Bayes Estimates (EBEs) supporting the covariate search and showing MXF abundance differences to the median (Y axes) as a function of each of the six candidate predictors, as indicated. The blue line indicates the correlation trend: positive for % histiocytes, negative for % necrosis and relative distance to lesion border, and neutral for the other predictors, thus illustrating the biological relationship between drug abundance and % histocyte as well as distance from the border; (B) Visual Predictive Checks (VPC) showing model-predicted MXF abundance versus observed abundance, indicating that drug abundance can reliably be predicted based on macrophage content, relative distance from granuloma border, and necrosis content, according the model equation: MXFabundance=θ1×eθ2×(Histiocytes%-0.35)×eθ3×(DistanceRatio-0.65)×(1+θNecrosis).
Figure 5.
Figure 5.. Comparative uptake of fluoroquinolones into human blood derived lymphocytes, neutrophils, macrophages and foamy macrophages, and into A549 epithelial cells.
(A) Intracellular to extracellular concentration ratios of MXF, LVX and GTX in the major cell types present in the cellular rim of necrotic lesions. Data were analyzed using the Friedman test (all means are significantly different from each other): *p<0.05, **p<0.01; (B) FACS analysis of Nile Red stained human bone marrow derived macrophages showing higher frequency of stained cells in macrophage populations stimulated with heat-inactivated M. tuberculosis (iMtb) compared to unstimulated macrophages. The percentage of Nile Red high cells is indicated. (C) Intracellular/extracellular drug concentration ratio of MXF, LVX, and GTX in unstimulated bone marrow derived macrophages (black bars, (M), and in iMTB stimulated foamy macrophages (green bars, FM), derived from seven individual donors (raw data in Figure 5—source data 1). Data were analyzed using the Wilcoxon matched-pairs signed rank test. *p<0.05, **p<0.01, ***p<0.001, ****p<0.0001.
Figure 5—figure supplement 1.
Figure 5—figure supplement 1.. Ratio of fluoroquinolone uptake in foamy macrophages relative to non-foamy macrophages isolated from seven individual blood donors.
Figure 5—figure supplement 2.
Figure 5—figure supplement 2.. Workflow for isolation and purification of lymphocytes and monocytes from donated packed leukocytes.
Packed Leukocytes are carefully pipetted over a layer of Ficoll in 50 ml falcon tubes, and centrifuged at 1600 rpm/530 G for 30 min with no brake. PBMC layer is extracted with a pipette and washed 2 times in PBS and the final pellet is re-suspended in RPMI to a concentration of 108 cells/mL. EasySep CD14 antibody solution is added at 100 μL/10^8 cells. Incubation at room temperature for 15 min followed by EasySep magnetic beads at 50 μL/108 cells. After 10 min incubation to allow antibody binding to beads, the tube is placed in the magnet for 5 min. CD14+ cells (monocytes) migrate to the walls of the tube leaving only CD14- cells (lymphocytes) in suspension. While the tube remains in the magnet, the supernatant is poured off and collected. The tube is removed from the magnet, RPMI added, pipetting up and down to resuspend CD14+ cells, and the tube is returned to the magnet. The process is repeated 3 times.

References

    1. Ahuja SD, Ashkin D, Avendano M, Banerjee R, Bauer M, Bayona JN, Becerra MC, Benedetti A, Burgos M, Centis R, Chan ED, Chiang CY, Cox H, D'Ambrosio L, DeRiemer K, Dung NH, Enarson D, Falzon D, Flanagan K, Flood J, Garcia-Garcia ML, Gandhi N, Granich RM, Hollm-Delgado MG, Holtz TH, Iseman MD, Jarlsberg LG, Keshavjee S, Kim HR, Koh WJ, Lancaster J, Lange C, de Lange WC, Leimane V, Leung CC, Li J, Menzies D, Migliori GB, Mishustin SP, Mitnick CD, Narita M, O'Riordan P, Pai M, Palmero D, Park SK, Pasvol G, Peña J, Pérez-Guzmán C, Quelapio MI, Ponce-de-Leon A, Riekstina V, Robert J, Royce S, Schaaf HS, Seung KJ, Shah L, Shim TS, Shin SS, Shiraishi Y, Sifuentes-Osornio J, Sotgiu G, Strand MJ, Tabarsi P, Tupasi TE, van Altena R, Van der Walt M, Van der Werf TS, Vargas MH, Viiklepp P, Westenhouse J, Yew WW, Yim JJ, Collaborative Group for Meta-Analysis of Individual Patient Data in MDR-TB Multidrug resistant pulmonary tuberculosis treatment regimens and patient outcomes: an individual patient data meta-analysis of 9,153 patients. PLOS Medicine. 2012;9:e1001300. doi: 10.1371/journal.pmed.1001300. - DOI - PMC - PubMed
    1. Azzi S, Hebda JK, Gavard J. Vascular permeability and drug delivery in cancers. Frontiers in Oncology. 2013;3 doi: 10.3389/fonc.2013.00211. - DOI - PMC - PubMed
    1. Bastos ML, Hussain H, Weyer K, Garcia-Garcia L, Leimane V, Leung CC, Narita M, Penã JM, Ponce-de-Leon A, Seung KJ, Shean K, Sifuentes-Osornio J, Van der Walt M, Van der Werf TS, Yew WW, Menzies D, Collaborative Group for Meta-analysis of Individual Patient Data in MDR-TB Treatment outcomes of patients with multidrug-resistant and extensively drug-resistant tuberculosis according to drug susceptibility testing to first- and second-line drugs: an individual patient data meta-analysis. Clinical Infectious Diseases. 2014;59:1364–1374. doi: 10.1093/cid/ciu619. - DOI - PMC - PubMed
    1. Berry MP, Graham CM, McNab FW, Xu Z, Bloch SA, Oni T, Wilkinson KA, Banchereau R, Skinner J, Wilkinson RJ, Quinn C, Blankenship D, Dhawan R, Cush JJ, Mejias A, Ramilo O, Kon OM, Pascual V, Banchereau J, Chaussabel D, O'Garra A. An interferon-inducible neutrophil-driven blood transcriptional signature in human tuberculosis. Nature. 2010;466:973–977. doi: 10.1038/nature09247. - DOI - PMC - PubMed
    1. Blanc L, Lenaerts A, Dartois V, Prideaux B. Visualization of Mycobacterial Biomarkers and Tuberculosis Drugs in Infected Tissue by MALDI-MS Imaging. Analytical Chemistry. 2018;90:6275–6282. doi: 10.1021/acs.analchem.8b00985. - DOI - PMC - PubMed

Publication types

MeSH terms