. 2019 Feb 1;121(2):371-395.
doi: 10.1152/jn.00144.2018. Epub 2018 Nov 14.

Functional and anatomical relationships between the medial precentral cortex, dorsal striatum, and head direction cell circuitry. II. Neuroanatomical studies

Affiliations

Functional and anatomical relationships between the medial precentral cortex, dorsal striatum, and head direction cell circuitry. II. Neuroanatomical studies

Max L Mehlman et al. J Neurophysiol. .

Abstract

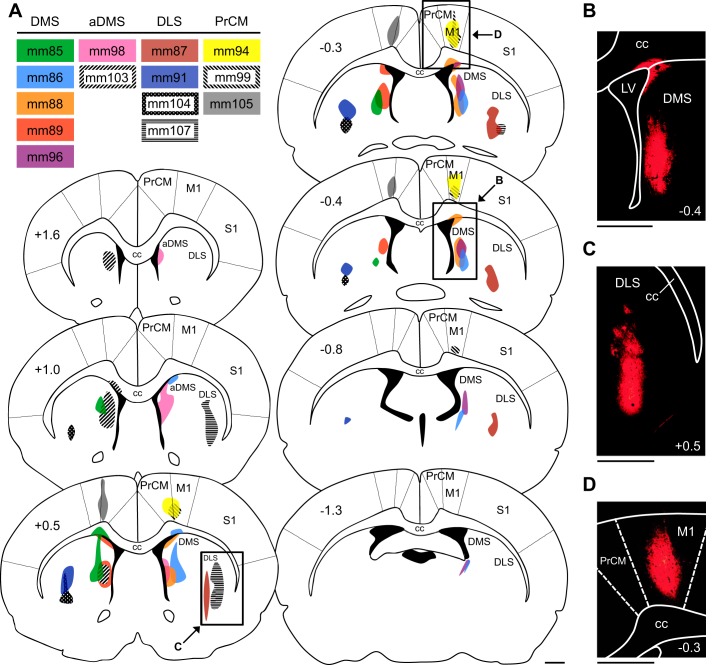
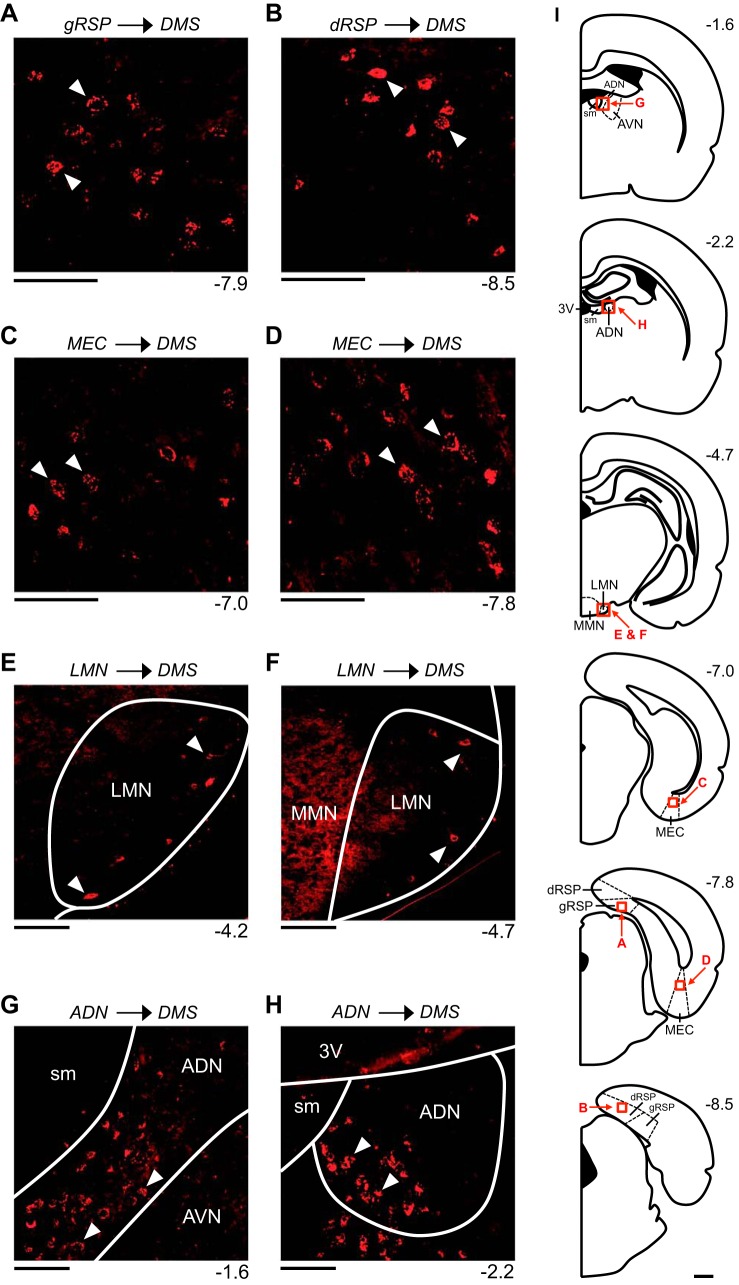
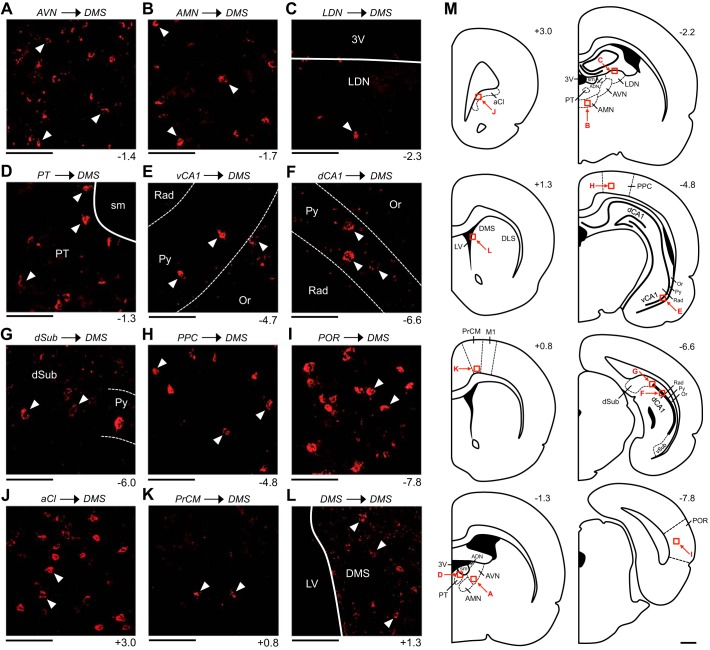
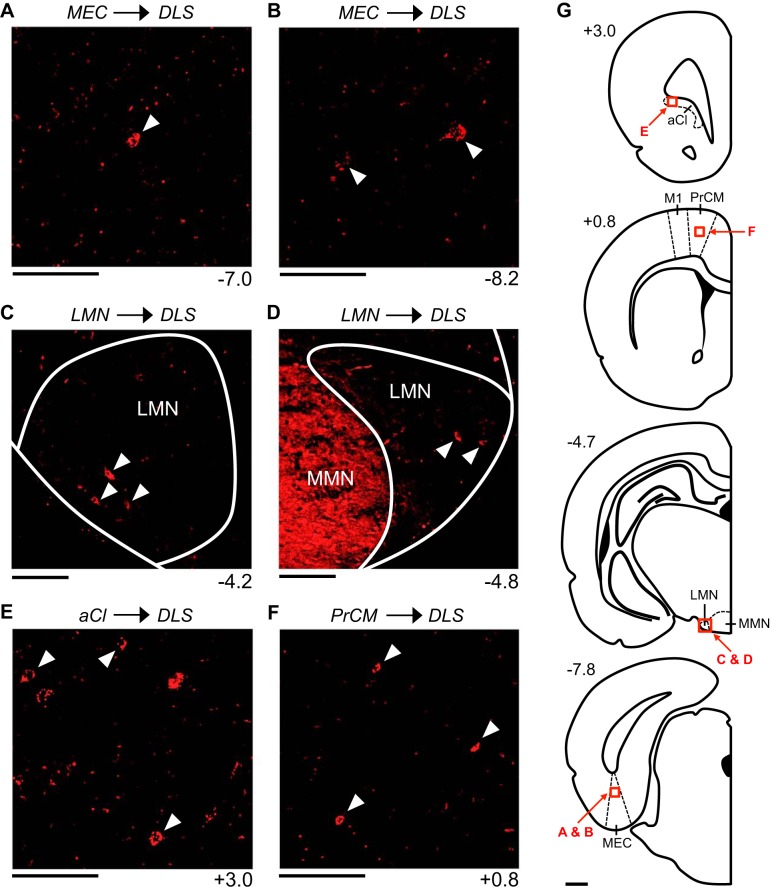
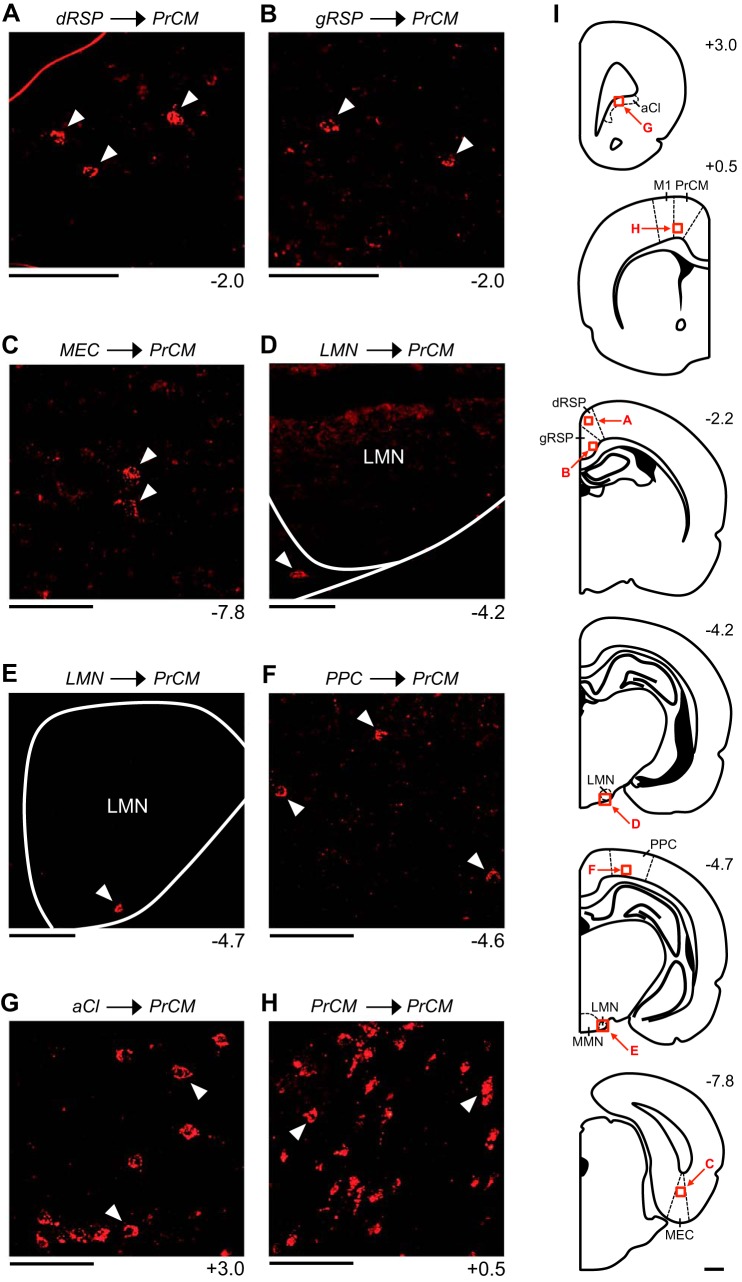
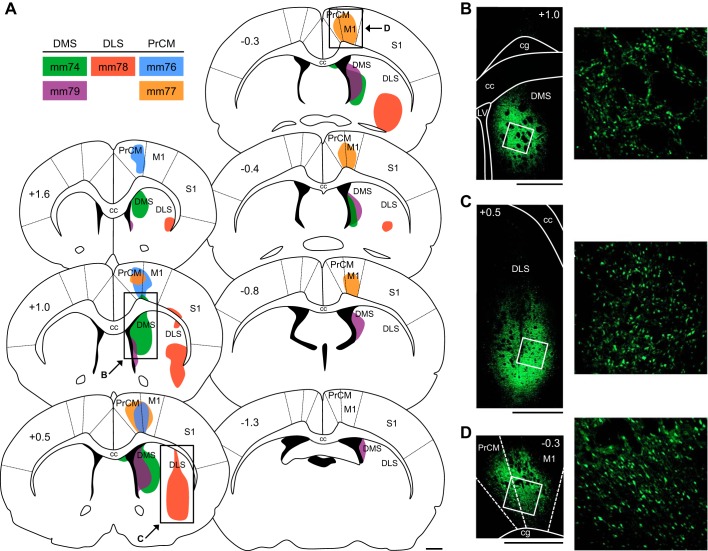
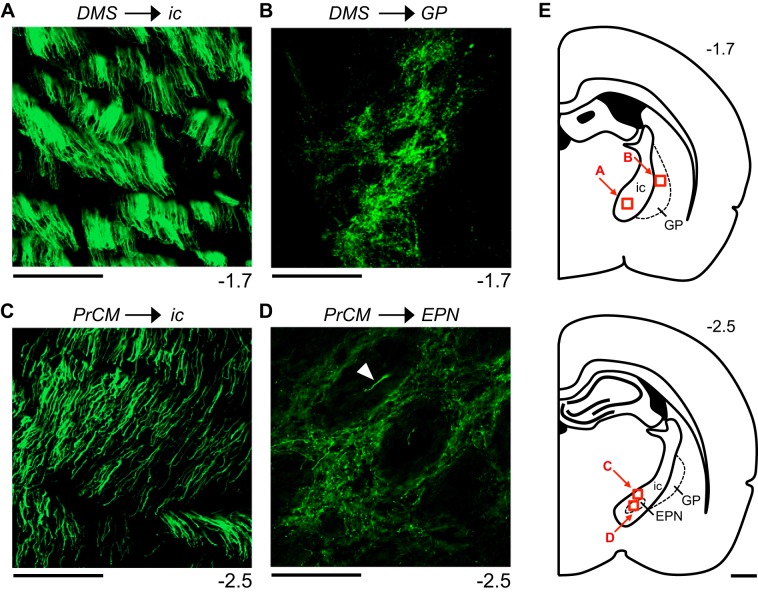
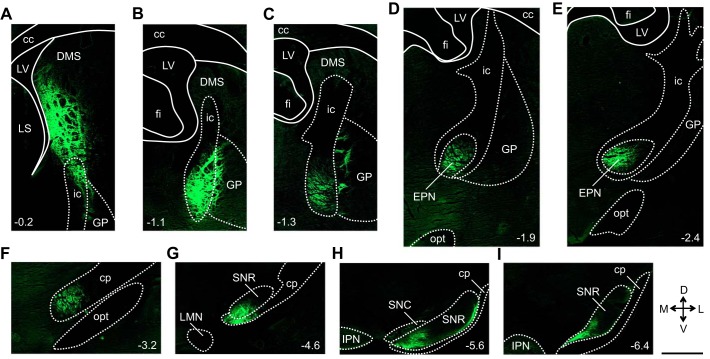
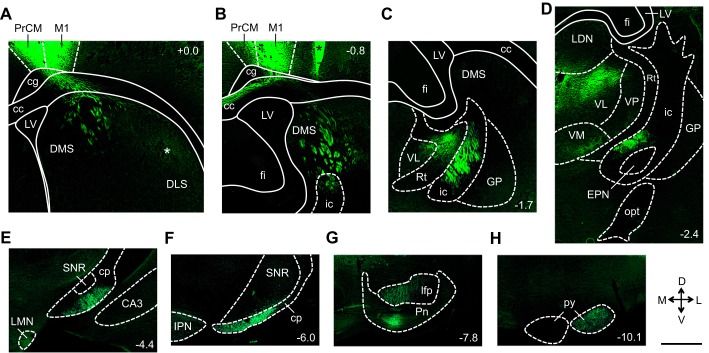
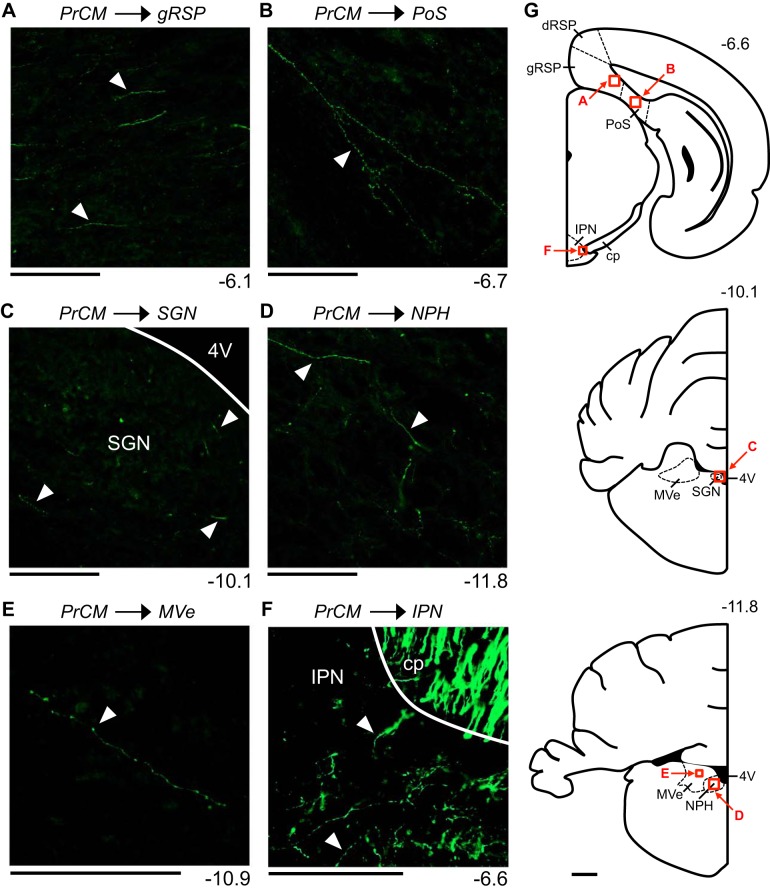
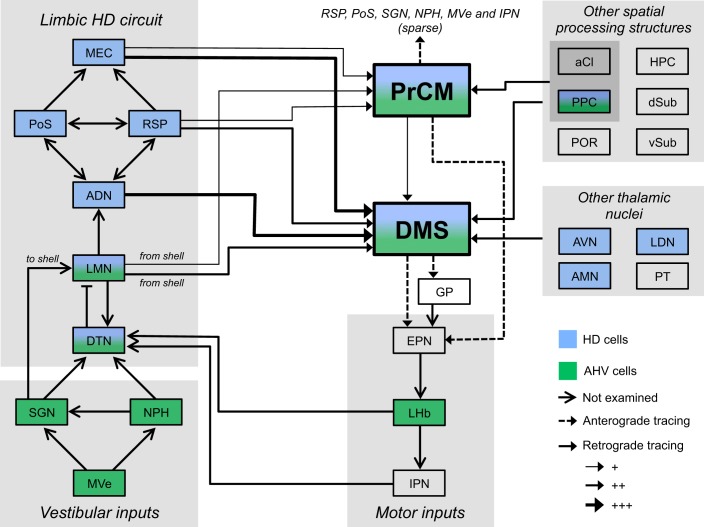
An animal's directional heading within its environment is encoded by the activity of head direction (HD) cells. In rodents, these neurons are found primarily within the limbic system in the interconnected structures that form the limbic HD circuit. In our accompanying report in this issue, we describe two HD cell populations located outside of this circuit in the medial precentral cortex (PrCM) and dorsal striatum (DS). These extralimbic areas receive their HD signals from the limbic system but do not provide critical input or feedback to limbic HD cells (Mehlman ML, Winter SS, Valerio S, Taube JS. J Neurophysiol 121: 350-370, 2019.). In this report, we complement our previous lesion and recording experiments with a series of neuroanatomical tracing studies in rats designed to examine patterns of connectivity between the PrCM, DS, limbic HD circuit, and related spatial processing circuitry. Retrograde tracing revealed that the DS receives direct input from numerous structures known to contain HD cells and/or other spatially tuned cell types. Importantly, these projections preferentially target and converge within the most medial portion of the DS, the same area in which we previously recorded HD cells. The PrCM receives direct input from a subset of these spatial processing structures. Anterograde tracing identified indirect pathways that could permit the PrCM and DS to convey self-motion information to the limbic HD circuit. These tracing studies reveal the anatomical basis for the functional relationships observed in our lesion and recording experiments. Collectively, these findings expand our understanding of how spatial processing circuitry functionally and anatomically extends beyond the limbic system into the PrCM and DS. NEW & NOTEWORTHY Head direction (HD) cells are located primarily within the limbic system, but small populations of extralimbic HD cells are found in the medial precentral cortex (PrCM) and dorsal striatum (DS). The neuroanatomical tracing experiments reported here explored the pathways capable of transmitting the HD signal to these extralimbic areas. We found that projections arising from numerous spatial processing structures converge within portions of the PrCM and DS that contain HD cells.

Keywords: dorsal striatum; head direction cell; limbic system; medial precentral cortex; navigation; spatial cognition.


Conflict of interest statement

No conflicts of interest, financial or otherwise, are declared by the authors.

Figures

Fig. 1.
Fig. 1.
Retrograde tracer injections in the dorsal striatum (DS) and medial precentral cortex (PrCM). A: atlas plates depicting coronal sections throughout the anterior/posterior (A/P) axis of the DS and PrCM. The number at top left of each plate indicates its A/P location in mm relative to bregma. The injection site for each animal is illustrated (color coded by animal, listed in inset), with shaded areas representing the extent of cholera toxin subunit B diffusion. Labeled arrows point to the approximate locations of the images in BD (the area shown in each image is outlined by a black rectangle). B: image of an injection site in the dorsomedial striatum (DMS; acquired from mm88). C: image of an injection site in the dorsolateral striatum (DLS; acquired from mm107). D: image of an injection site in the PrCM (acquired from mm94). In BD, the number at bottom right of each image indicates its A/P location in mm relative to bregma. All scale bars are 1 mm. aDMS, anterior dorsomedial striatum; cc, corpus callosum; LV, lateral ventricle; M1, primary motor cortex; S1, primary somatosensory cortex.
Fig. 2.
Fig. 2.
Retrograde labeling patterns observed within limbic head direction (HD) circuit structures following an injection into the dorsomedial striatum (DMS). All images are acquired from mm88, a representative animal that received a cholera toxin subunit B injection into the right DMS. A and B: labeled cells within the superficial layers of the granular retrosplenial cortex (gRSP; A) and the deep layers of the dysgranular retrosplenial cortex (dRSP; B). C and D: labeled cells within the deep layers of the medial entorhinal cortex (MEC). E and F: labeled cells within the shell region of the lateral mammillary nucleus (LMN). G and H: labeled cells within the anterodorsal thalamic nucleus (ADN). In AH, the number at bottom right of each image indicates its anterior/posterior (A/P) location in mm relative to bregma, and the white arrowheads in each image indicate examples of labeled cells. All images show labeling within the hemisphere ipsilateral to the injection site and are oriented as follows: top is dorsal, bottom is ventral, left is medial, and right is lateral. Scale bars in AH are 100 μm. I: atlas plates depicting coronal sections. The number at top right of each plate indicates its A/P location in mm relative to bregma. Labeled arrows point to the approximate locations of the images in AH (the area shown in each image is outlined by a red square). Scale bar in I is 1 mm. 3V, third ventricle; AVN, anteroventral thalamic nucleus; MMN, medial mammillary nucleus; sm, stria medullaris.
Fig. 3.
Fig. 3.
Retrograde labeling patterns observed within spatial processing structures following an injection into the dorsomedial striatum (DMS). All images are acquired from mm88, a representative animal that received a cholera toxin subunit B injection into the right DMS. A: labeled cells within the ventral portion of the anteroventral thalamic nucleus (AVN). B: labeled cells within the anteromedial thalamic nucleus (AMN). C: labeled cell within the dorsal portion the laterodorsal thalamic nucleus (LDN). D: labeled cells within the parataenial nucleus of the thalamus (PT). E and F: labeled cells within the pyramidal cell (Py) layer of the ventral (vCA1; E) and the dorsal CA1 area of the hippocampus (dCA1; F). G: labeled cells within the portion of the dorsal subiculum (dSub) located immediately adjacent to the dCA1. H: labeled cells within the deep layers of the posterior parietal cortex (PPC). I: labeled cells within the deep layers of the postrhinal cortex (POR). J: labeled cells within the anterior claustrum (aCl). K: labeled cells within layer VI of the medial precentral cortex (PrCM). L: labeled cells within the portion of the DMS located immediately anterior to the injection site. In AL, the number at bottom right of each image indicates its anterior/posterior (A/P) location in mm relative to bregma, and the white arrowheads in each image indicate examples of labeled cells. All images show labeling within the hemisphere ipsilateral to the injection site and are oriented as follows: top is dorsal, bottom is ventral, left is medial, and right is lateral. Scale bars in AL are 100 μm. M: atlas plates depicting coronal sections. The number at top right of each plate indicates its A/P location in mm relative to bregma. Labeled arrows point to the approximate locations of the images in AL (the area shown in each image is outlined by a red square). Scale bar in M is 1 mm. 3V, third ventricle; ADN, anterodorsal thalamic nucleus; DLS, dorsolateral striatum; LV, lateral ventricle; M1, primary motor cortex; Or, oriens layer of the hippocampus; Rad, stratum radiatum layer of the hippocampus; sm, stria medullaris; vSub, ventral subiculum.
Fig. 4.
Fig. 4.
Retrograde labeling patterns observed within limbic head direction (HD) circuit structures and other spatial processing structures following an injection into the dorsolateral striatum (DLS). All images are acquired from mm104, a representative animal that received a cholera toxin subunit B injection into the left DLS. A and B: labeled cells within the deep layers of the medial entorhinal cortex (MEC). C and D: labeled cells within the shell region of the ipsilateral (C) and contralateral (D) lateral mammillary nucleus (LMN). E: labeled cells within the lateral portion of the anterior claustrum (aCl). F: labeled cells within the intermediate layers of the medial precentral cortex (PrCM). In AF, the number at bottom right of each image indicates its anterior/posterior (A/P) location in mm relative to bregma, and the white arrowheads in each image indicate examples of labeled cells. All images (except D) show labeling within the hemisphere ipsilateral to the injection site and are oriented as follows: top is dorsal, bottom is ventral, left is lateral, and right is medial (in D, left is medial and right is lateral). Scale bars in AF are 100 μm. G: atlas plates depicting coronal sections. The number at top left of each plate indicates its A/P location in mm relative to bregma. Labeled arrows point to the approximate locations of the images in AF (the area shown in each image is outlined by a red square). Scale bar in G is 1 mm. M1, primary motor cortex; MMN, medial mammillary nucleus.
Fig. 5.
Fig. 5.
Retrograde labeling patterns observed within limbic head direction (HD) circuit structures and other spatial processing structures following an injection into the medial precentral cortex (PrCM). All images are acquired from mm94, a representative animal that received a cholera toxin subunit B injection into the right PrCM. A and B: labeled cells within the superficial layers of the dysgranular retrosplenial cortex (dRSP; A) and the deep layers of the granular retrosplenial cortex (gRSP; B). C: labeled cells within the deep layers of the medial entorhinal cortex (MEC). D and E: labeled cells within the shell region of the lateral mammillary nucleus (LMN). F: labeled cells within the deep layers of the posterior parietal cortex (PPC). G: labeled cells within the anterior claustrum (aCl). H: labeled cells within the deep layers of the contralateral PrCM. In AH, the number at bottom right of each image indicates its anterior/posterior (A/P) location in mm relative to bregma, and the white arrowheads in each image indicate examples of labeled cells. All images (except H) show labeling within the hemisphere ipsilateral to the injection site and are oriented as follows: top is dorsal, bottom is ventral, left is medial, and right is lateral (in H, left is lateral and right is medial). Scale bars in AH are 100 μm. I: atlas plates depicting coronal sections. The number at top right of each plate indicates its A/P location in mm relative to bregma. Labeled arrows point to the approximate locations of the images in AH (the area shown in each image is outlined by a red square). Scale bar in I is 1 mm. M1, primary motor cortex; MMN, medial mammillary nucleus.
Fig. 6.
Fig. 6.
Anterograde tracer injections in the dorsal striatum (DS) and medial precentral cortex (PrCM). A: atlas plates depicting coronal sections throughout the anterior/posterior (A/P) axis of the DS and PrCM. The number at top left of each plate indicates its A/P location in mm relative to bregma. The injection site for each animal is illustrated (color coded by animal, listed in inset), with shaded areas representing the portion of tissue infected by the virus. Labeled arrows point to the approximate locations of the images in BD (the area shown in each image is outlined by a black rectangle). B: image of an injection site in the dorsomedial striatum (DMS; acquired from mm74). C: image of an injection site in the dorsolateral striatum (DLS; acquired from mm78). D: image of an injection site in the PrCM (acquired from mm77). In BD, right, the image shows the area outlined by the white square (left) at higher magnification. In BD, left, the number at top right or top left of each image indicates its A/P location in mm relative to bregma. All scale bars are 1 mm. cc, Corpus callosum; cg, cingulum; LV, lateral ventricle; M1, primary motor cortex; S1, primary somatosensory cortex.
Fig. 7.
Fig. 7.
Appearance of labeled fibers following an injection into the dorsomedial striatum (DMS) or medial precentral cortex (PrCM). A: image of large-diameter fibers within the internal capsule (ic), acquired from mm74, a representative animal that received a virus injection into the right DMS. B: image of small-diameter fibers forming a putative terminal field within the globus pallidus (GP), acquired from mm74. C: image of large-diameter fibers within the ic, acquired from mm77, a representative animal that received a virus injection into the right PrCM. D: image of small-diameter fibers forming a putative terminal field within the entopeduncular nucleus (EPN), acquired from mm77. These small-diameter fibers are located outside of the small, circular fascicles that stipple the EPN; the white arrowhead indicates a single large-diameter fiber located within a fascicle. In AD, the number at bottom right of each image indicates its anterior/posterior (A/P) location in mm relative to bregma. All images show fiber labeling within the hemisphere ipsilateral to the injection site and are oriented as follows: top is dorsal, bottom is ventral, left is medial, and right is lateral. Scale bars in AD are 100 μm. E: atlas plates depicting coronal sections. The number at top right of each plate indicates its A/P location in mm relative to bregma. Labeled arrows point to the approximate locations of the images in AD (the area shown in each image is outlined by a red square). Scale bar in E is 1 mm.
Fig. 8.
Fig. 8.
Reconstruction of the primary dorsomedial striatum (DMS) output pathways. AI show a series of images acquired from mm74, a representative animal that received a virus injection into the right DMS. Starting at the injection site (A), this series of images illustrates the location of labeled fibers at progressively more posterior levels, ultimately tracing a pathway from the DMS to the substantia nigra pars reticulata (SNR). The number at bottom left or bottom right of each image indicates its anterior/posterior location in mm relative to bregma. All images show fiber labeling within the hemisphere ipsilateral to the injection site and are oriented as indicated in inset (D, dorsal; V, ventral; M, medial; L, lateral). Scale bar is 1 mm and applies to all panels. cc, Corpus callosum; cp, cerebral peduncle; EPN, entopeduncular nucleus; fi, fimbria of the hippocampus; GP, globus pallidus; ic, internal capsule; IPN, interpeduncular nucleus; LMN, lateral mammillary nucleus; LS, lateral septal nucleus; LV, lateral ventricle; opt, optic tract; SNC, substantia nigra pars compacta.
Fig. 9.
Fig. 9.
Reconstruction of the primary medial precentral cortex (PrCM) output pathways. AH show a series of images acquired from mm77, a representative animal that received a virus injection into the right PrCM. Starting at the injection site (A), this series of images illustrates the location of labeled fibers at progressively more posterior levels, ultimately tracing a pathway from the PrCM to the pyramidal tract (py). White asterisk in A indicates the location of a putative terminal field formed by small-diameter fibers. Black asterisk in B denotes an area not infected by the virus (bright green appearance is due to autofluorescence caused by tissue folding, not enhanced yellow fluorescent protein expression). The number at top right or bottom right of each image indicates its anterior/posterior location in mm relative to bregma. All images show fiber labeling within the hemisphere ipsilateral to the injection site and are oriented as indicated in inset (D, dorsal; V, ventral; M, medial; L, lateral). Scale bar is 1 mm and applies to all panels. CA3, CA3 area of the hippocampus; cc, corpus callosum; cg, cingulum; cp, cerebral peduncle; DLS, dorsolateral striatum; DMS, dorsomedial striatum; EPN, entopeduncular nucleus; fi, fimbria of the hippocampus; GP, globus pallidus; ic, internal capsule; IPN, interpeduncular nucleus; LDN, laterodorsal thalamic nucleus; lfp, longitudinal fasciculus of the pons; LMN, lateral mammillary nucleus; LV, lateral ventricle; M1, primary motor cortex; opt, optic tract; Pn, pontine nuclei; Rt, reticular thalamic nucleus; SNR, substantia nigra pars reticulata; VL, ventrolateral thalamic nucleus; VM, ventromedial thalamic nucleus; VP, ventral posterolateral thalamic nucleus.
Fig. 10.
Fig. 10.
Fiber labeling patterns observed within spatial processing structures following an injection into the medial precentral cortex (PrCM). All images are acquired from mm77, a representative animal that received a virus injection into the right PrCM. A: small-diameter fibers within the deep layers of the granular retrosplenial cortex (gRSP). B: small-diameter fiber within the intermediate layers of the postsubiculum (PoS). C: small-diameter fibers within the supragenual nucleus (SGN). D: small-diameter fibers within the nucleus prepositus hypoglossi (NPH). E: small-diameter fibers within the medial vestibular nucleus (MVe). F: small-diameter fibers within the interpeduncular nucleus (IPN) and large-diameter fibers within the cerebral peduncle (cp). In AF, the number at bottom right of each image indicates its anterior/posterior (A/P) location in mm relative to bregma, and the white arrowheads in each image indicate examples of labeled fibers. Images in A, B, and F show fiber labeling within the hemisphere ipsilateral to the injection site and are oriented as follows: top is dorsal, bottom is ventral, left is medial, and right is lateral. Images in C, D, and E show fiber labeling within the hemisphere contralateral to the injection site and are oriented as follows: top is dorsal, bottom is ventral, left is lateral, and right is medial. Scale bars in AF are 100 μm. G: atlas plates depicting coronal sections. The number at top right of each plate indicates its A/P location in mm relative to bregma. Labeled arrows point to the approximate locations of the images in AF (the area shown in each image is outlined by a red square). Scale bar in G is 1 mm. 4V, fourth ventricle; dRSP, dysgranular retrosplenial cortex.
Fig. 11.
Fig. 11.
Circuit diagram summarizing the patterns of connectivity between the medial precentral cortex (PrCM), dorsomedial striatum (DMS), and spatial processing circuitry. Left portion of the diagram depicts the limbic head direction (HD) circuit; the reciprocally connected dorsal tegmental nucleus (DTN) and lateral mammillary nucleus (LMN) are thought to generate the HD signal, which is serially transmitted from the LMN to the anterodorsal thalamic nucleus (ADN) and, in turn, to the retrosplenial cortex (RSP), postsubiculum (PoS), and medial entorhinal cortex (MEC) (Taube 2007). The limbic HD circuit receives critical inputs conveying self-motion information from vestibular structures (bottom left) and motor structures (bottom center) (Clark et al. 2009; Clark and Taube 2012). Other spatial processing structures are listed on the right portion of the diagram; arrows arising from the gray shaded boxes indicate projections from all structures contained within the shaded area. Blue shading denotes structures containing HD cells, and green shading indicates structures containing angular head velocity (AHV) cells (Jankowski et al. 2015; Mizumori and Williams 1993; Sharp et al. 2006; Taube 2007; Tsanov et al. 2011; Wilber et al. 2014; Winter and Taube 2014). Arrows with solid lines indicate connections observed in retrograde tracing experiments, with the weight of each line representing the relative density of the projection. Arrows with dashed lines indicate connections observed in anterograde tracing experiments. Solid lines terminating in an open arrowhead denote connections reported previously but not examined here. Note that numerous projections arising from limbic HD circuit structures and other spatial processing structures, many of which contain HD cells, converge within the DMS, and to a lesser extent, within the PrCM. These two extralimbic areas project to the limbic HD circuit indirectly via the entopeduncular nucleus (EPN); additionally, the PrCM sends sparse but direct projections to structures in the limbic HD circuit, vestibular input structures, and a motor input structure. +, sparse; ++, intermediate; +++, dense; aCl, anterior claustrum; AMN, anteromedial thalamic nucleus; AVN, anteroventral thalamic nucleus; dSub, dorsal subiculum; GP, globus pallidus; HPC, hippocampus; IPN, interpeduncular nucleus; LDN, laterodorsal thalamic nucleus; LHb, lateral habenula; MVe, medial vestibular nucleus; NPH, nucleus prepositus hypoglossi; POR, postrhinal cortex; PPC, posterior parietal cortex; PT, parataenial nucleus of the thalamus; SGN, supragenual nucleus; vSub, ventral subiculum.

References

    1. Aggleton JP, O’Mara SM, Vann SD, Wright NF, Tsanov M, Erichsen JT. Hippocampal-anterior thalamic pathways for memory: uncovering a network of direct and indirect actions. Eur J Neurosci 31: 2292–2307, 2010. doi:10.1111/j.1460-9568.2010.07251.x. - DOI - PMC - PubMed
    1. Agster KL, Tomás Pereira I, Saddoris MP, Burwell RD. Subcortical connections of the perirhinal, postrhinal, and entorhinal cortices of the rat. II. Efferents. Hippocampus 26: 1213–1230, 2016. doi:10.1002/hipo.22600. - DOI - PMC - PubMed
    1. Alexander AS, Nitz DA. Retrosplenial cortex maps the conjunction of internal and external spaces. Nat Neurosci 18: 1143–1151, 2015. doi:10.1038/nn.4058. - DOI - PubMed
    1. Alexander AS, Nitz DA. Spatially periodic activation patterns of retrosplenial cortex encode route sub-spaces and distance traveled. Curr Biol 27: 1551–1560.e4, 2017. doi:10.1016/j.cub.2017.04.036. - DOI - PubMed
    1. Aschauer DF, Kreuz S, Rumpel S. Analysis of transduction efficiency, tropism and axonal transport of AAV serotypes 1, 2, 5, 6, 8 and 9 in the mouse brain. PLoS One 8: e76310, 2013. doi:10.1371/journal.pone.0076310. - DOI - PMC - PubMed

Publication types

LinkOut - more resources