. 2019 Feb 1;121(2):350-370.
doi: 10.1152/jn.00143.2018. Epub 2018 Nov 14.

Functional and anatomical relationships between the medial precentral cortex, dorsal striatum, and head direction cell circuitry. I. Recording studies

Affiliations

Functional and anatomical relationships between the medial precentral cortex, dorsal striatum, and head direction cell circuitry. I. Recording studies

Max L Mehlman et al. J Neurophysiol. .

Abstract

Head direction (HD) cells fire as a function of the animal's directional heading and provide the animal with a sense of direction. In rodents, these neurons are located primarily within the limbic system, but small populations of HD cells are found in two extralimbic areas: the medial precentral cortex (PrCM) and dorsal striatum (DS). HD cell activity in these structures could be driven by output from the limbic HD circuit or generated intrinsically. We examined these possibilities by recording the activity of PrCM and DS neurons in control rats and in rats with anterodorsal thalamic nucleus (ADN) lesions, a manipulation that disrupts the limbic HD signal. HD cells in the PrCM and DS of control animals displayed characteristics similar to those of limbic HD cells, and these extralimbic HD signals were eliminated in animals with complete ADN lesions, suggesting that the PrCM and DS HD signals are conveyed from the limbic HD circuit. Angular head velocity cells recorded in the PrCM and DS were unaffected by ADN lesions. Next, we determined if the PrCM and DS convey necessary self-motion signals to the limbic HD circuit. Limbic HD cell activity recorded in the ADN remained intact following combined lesions of the PrCM and DS. Collectively, these experiments reveal a unidirectional functional relationship between the limbic HD circuit and the PrCM and DS; the limbic system generates the HD signal and transmits it to the PrCM and DS, but these extralimbic areas do not provide critical input or feedback to limbic HD cells. NEW & NOTEWORTHY Head direction (HD) cells have been extensively studied within the limbic system. The lesion and recording experiments reported here examined two relatively understudied populations of HD cells located outside of the canonical limbic HD circuit in the medial precentral cortex and dorsal striatum. We found that HD cell activity in these two extralimbic areas is driven by output from the limbic HD circuit, revealing that HD cell circuitry functionally extends beyond the limbic system.

Keywords: angular head velocity cell; anterodorsal thalamic nucleus; dorsal striatum; head direction cell; medial precentral cortex; navigation; spatial cognition.


Conflict of interest statement

No conflicts of interest, financial or otherwise, are declared by the authors.

Figures

Fig. 1.
Fig. 1.
Diagrams of head direction (HD) cell recording arenas and procedures. A: during HD cell recording, animals foraged for food pellets in a cylinder containing a single polarizing visual landmark (i.e., the cue card). Each HD cell was recorded across a sequence of 5 sessions: standard (STD1) → rotation (ROT) → standard (STD2) → dark (DRK) → standard (STD3). B: one HD cell per animal was recorded in the dual-chamber apparatus (DCA). The HD cell was first recorded in a familiar cylinder (CYL1), and then the animal walked through a novel passageway into a novel rectangle and the cell was recorded again (REC). Finally, the animal walked back through the passageway into the cylinder and the cell was recorded a third time (CYL2). In A and B, the curved or straight lines along the outside edge of the arenas represent cue card locations.
Fig. 2.
Fig. 2.
Head direction (HD) cell and angular head velocity (AHV) cell recording locations in the medial precentral cortex (PrCM) and dorsal striatum (DS). A: histogram illustrating the distribution of the depths of all HD cells recorded in the control, lesion, and extended-DS groups. The border between the PrCM and DS was defined as −2.3 mm dorsal/ventral; all cells dorsal were classified as PrCM cells and all cells ventral were classified as DS cells. B: atlas plates representing coronal sections throughout the anterior/posterior (A/P) axis of the PrCM and DS. For each animal, the path of the electrode array was reconstructed and is represented by a vertical line. Blue lines represent control animals, red lines represent animals with anterodorsal thalamic nucleus (ADN) lesions, the orange line represents the animal with a small hippocampal (HPC) lesion, and green lines represent the extended-DS animals with electrode arrays implanted at more anterior, lateral, and/or ventral coordinates within the DS. Overlaid symbols represent the locations at which HD cells (○) and AHV cells (×) were recorded. Adjacent symbols represent cells that were recorded simultaneously at the same location along the reconstructed path. The number at top left of each plate indicates its A/P location in mm relative to bregma. Scale bar, 1 mm. M1, primary motor cortex; cc, corpus callosum.
Fig. 3.
Fig. 3.
Tuning properties of head direction (HD) cells recorded in the medial precentral cortex (PrCM), dorsal striatum (DS), and anterodorsal thalamic nucleus (ADN) of control animals. A: tuning curves illustrating the activity of a representative PrCM, DS, and ADN HD cell. B: grouped scatterplots illustrating the Rayleigh r (left), directional firing range (middle), and peak firing rate (right) of all HD cells recorded in the control groups. Group means are indicated by the overlaid horizontal lines. **P < 0.01, one-way ANOVA, post hoc pairwise comparison (PrCM and DS). ***P < 0.001, one-way ANOVA, post hoc pairwise comparison (PrCM and ADN).
Fig. 4.
Fig. 4.
Responses to environmental manipulations displayed by head direction (HD) cells recorded in the medial precentral cortex (PrCM), dorsal striatum (DS), and anterodorsal thalamic nucleus (ADN) of control animals. A: example HD cell recorded in the DS during the first standard (STD1), rotation (ROT), and second standard (STD2) sessions. B: circular histograms illustrating the angular shift of each HD cell’s preferred firing direction (PFD) from STD1 to ROT (left) and from STD1 to STD2 (right). Each circle represents the PFD shift of a single HD cell recorded in the PrCM, DS, or ADN. For each brain area, the circular mean of all shift values is indicated and represented by the arrow in the center of the plot. The length of each arrow indicates the Rayleigh r of the shift values (ranging from 0 to 1, with the circle’s radius representing 1). C: example HD cell recorded in the DS during the STD2, dark (DRK), and third standard (STD3) sessions. D: same recordings as in C, illustrating HD cell activity over time. Each circle represents the HD of the animal when the cell’s firing rate was ≥75% of its peak firing rate. E: mean directional firing range (left), PFD stability (middle), and Rayleigh r (right) of all HD cells recorded in the PrCM, DS, and ADN under light and dark conditions for 8 min. Error bars are SE. ***P < 0.001, repeated-measures ANOVA, main effect of condition (light and dark). F: example HD cell recorded in the PrCM during the first session in the familiar cylinder (CYL1), the session in the novel rectangle (REC), and the second session in the cylinder (CYL2). G: circular histograms (as in B) illustrating the response of each PrCM and DS HD cell recorded in the dual-chamber apparatus. PFD shifts from CYL1 to REC (left) and from CYL1 to CYL2 (right) are shown.
Fig. 5.
Fig. 5.
Tuning properties of angular head velocity (AHV) cells recorded in the medial precentral cortex (PrCM) and dorsal striatum (DS) of control and lesioned animals. A: example symmetric AHV cell recorded in the PrCM of a control animal. B: example symmetric AHV cell recorded in the PrCM of a lesioned animal. C: example symmetric AHV cell recorded in the DS of a lesioned animal. D: example symmetric AHV cell recorded in the DS of an extended-DS animal. In contrast to the AHV cells in AC, which displayed increased firing rates during head turns, this AHV cell displayed a firing rate that decreased during head turns. E: example asymmetric AHV cell recorded in the PrCM of a lesioned animal. F: example asymmetric AHV cell recorded in the DS of a lesioned animal. The AHV cell in E responded oppositely to clockwise (CW) vs. counterclockwise (CCW) rotation, displaying a firing rate that decreased during CW head turns and increased during CCW head turns. In contrast, the AHV cell in F was responsive to head turns in one direction (CW), but unresponsive when the head turned in the other direction. In AF, positive velocities indicate rotation in the CCW direction and negative velocities indicate rotation in the CW direction. G: scatterplot illustrating the CW and CCW slope of all AHV cells recorded in the PrCM and DS of control, extended-DS, and lesioned animals. Symmetric AHV cells appear near the diagonal in quadrants II and IV (indicated by the shaded areas), whereas asymmetric AHV cells appear in quadrants I and III, and away from the diagonal in quadrants II and IV (i.e., outside of the shaded areas). The labeled arrows point to the AHV cells illustrated in AF. H: mean unsigned slope values (left) and correlation values (right) for the tuning curves of all PrCM and DS AHV cells recorded in control and lesioned animals. Error bars are SE. **P < 0.01, two-way ANOVA, main effect of brain area (PrCM and DS).
Fig. 6.
Fig. 6.
Anterodorsal thalamic nucleus (ADN) lesions. A: representative images illustrating the right ADN of a control animal (left; the ADN is outlined by the dashed line) and a lesioned animal (right; the lesioned area is outlined by the dashed line). The number at top right of each image indicates its anterior/posterior (A/P) location in mm relative to bregma. Scale bars, 500 μm. B: atlas plates representing coronal sections throughout the A/P axis of the ADN. Red shading illustrates the extent of the average ADN lesion; the darkness of an area corresponds to the number of animals in which that area was lesioned (i.e., darker areas are lesioned across more animals compared with lighter areas). The number at top left of each plate indicates its A/P location in mm relative to bregma. Scale bar, 1 mm. AVN, anteroventral thalamic nucleus; AMN, anteromedial thalamic nucleus; LDN, laterodorsal thalamic nucleus; MDN, mediodorsal thalamic nucleus.
Fig. 7.
Fig. 7.
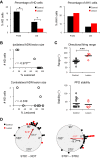
Effects of anterodorsal thalamic nucleus (ADN) lesions. A: percentage of head direction (HD) cells (left) and angular head velocity (AHV) cells (right) recorded in the medial precentral cortex (PrCM) and dorsal striatum (DS) of control and lesioned animals. *P < 0.05; +P = 0.05, Pearson’s chi-squared test. B: scatterplots illustrating the relationship between lesion size and the number of HD cells recorded in the DS of lesioned animals. The number of HD cells is plotted relative to the size of the ADN lesion in the hemisphere ipsilateral (top) or contralateral (bottom) to the recording electrode. The number at bottom left of each plot indicates the correlation between lesion size and number of HD cells recorded. ***P < 0.001, Pearson’s r. C: grouped scatterplots illustrating the directional firing range (top) and preferred firing direction (PFD) stability (bottom) of all HD cells recorded in the DS of control and lesioned animals. Group means are indicated by the overlaid horizontal lines. ***P < 0.001, independent-samples t-test. D: circular histograms (as in Fig. 4) illustrating the angular shift of each DS HD cell’s PFD from the first standard session (STD1) to the rotation session (ROT; left) and from STD1 to the second standard session (STD2; right). Arrows represent the circular mean and Rayleigh r of all shift values within each group.
Fig. 8.
Fig. 8.
Combined medial precentral cortex (PrCM) and dorsal striatum (DS) lesions. Atlas plates representing coronal sections throughout the anterior/posterior (A/P) axis of the PrCM and DS. As in Fig. 6, red shading illustrates the extent of the average PrCM and DS lesion; darker areas are lesioned more consistently across animals compared with lighter areas. The number at top left of each plate indicates its A/P location in mm relative to bregma. Scale bar, 1 mm. Note that the lesions were largely confined to the portions of the PrCM and DS in which HD cells and AHV cells were recorded in experiment 1. M1, primary motor cortex; S1, primary somatosensory cortex.
Fig. 9.
Fig. 9.
Effects of combined medial precentral cortex (PrCM) and dorsal striatum (DS) lesions. A: percentage of head direction (HD) cells recorded in the anterodorsal thalamic nucleus (ADN) of control and lesioned animals. B: circular histograms (as in Fig. 4) illustrating the angular shift of each ADN HD cell’s preferred firing direction (PFD) from the first standard session (STD1) to the rotation session (ROT; left) and from STD1 to the second standard session (STD2; right). Arrows represent the circular mean and Rayleigh r of all shift values within each group. C: mean PFD stability of all ADN HD cells recorded in control and lesioned animals under dark conditions for 8 min. D: average distance traveled (left), mean linear speed (middle), and mean angular head speed (right) during STD1 for the control and lesion groups. Error bars are SE.

References

    1. Balleine BW, Delgado MR, Hikosaka O. The role of the dorsal striatum in reward and decision-making. J Neurosci 27: 8161–8165, 2007. doi:10.1523/JNEUROSCI.1554-07.2007. - DOI - PMC - PubMed
    1. Bassett JP, Taube JS. Neural correlates for angular head velocity in the rat dorsal tegmental nucleus. J Neurosci 21: 5740–5751, 2001. doi:10.1523/JNEUROSCI.21-15-05740.2001. - DOI - PMC - PubMed
    1. Bassett JP, Tullman ML, Taube JS. Lesions of the tegmentomammillary circuit in the head direction system disrupt the head direction signal in the anterior thalamus. J Neurosci 27: 7564–7577, 2007. doi:10.1523/JNEUROSCI.0268-07.2007. - DOI - PMC - PubMed
    1. Batschelet E. Circular Statistics in Biology. New York: Academic, 1981.
    1. Berke JD, Okatan M, Skurski J, Eichenbaum HB. Oscillatory entrainment of striatal neurons in freely moving rats. Neuron 43: 883–896, 2004. doi:10.1016/j.neuron.2004.08.035. - DOI - PubMed

Publication types

LinkOut - more resources