. 2018 Nov 14;13(11):e0198705.
doi: 10.1371/journal.pone.0198705. eCollection 2018.

Automated high-throughput light-sheet fluorescence microscopy of larval zebrafish

Affiliations

Automated high-throughput light-sheet fluorescence microscopy of larval zebrafish

Savannah L Logan et al. PLoS One. .

Abstract

Light sheet fluorescence microscopy enables fast, minimally phototoxic, three-dimensional imaging of live specimens, but is currently limited by low throughput and tedious sample preparation. Here, we describe an automated high-throughput light sheet fluorescence microscope in which specimens are positioned by and imaged within a fluidic system integrated with the sheet excitation and detection optics. We demonstrate the ability of the instrument to rapidly examine live specimens with minimal manual intervention by imaging fluorescent neutrophils over a nearly 0.3 mm3 volume in dozens of larval zebrafish. In addition to revealing considerable inter-individual variability in neutrophil number, known previously from labor-intensive methods, three-dimensional imaging allows assessment of the correlation between the bulk measure of total cellular fluorescence and the spatially resolved measure of actual neutrophil number per animal. We suggest that our simple experimental design should considerably expand the scope and impact of light sheet imaging in the life sciences.


Conflict of interest statement

The authors have declared that no competing interests exist.

Figures

Fig 1
Fig 1. Instrument design.
(A) Schematic of the instrument design, with labels corresponding to the parts list in S1 Table. See also S1 Movie. The excitation laser line is selected by an acousto-optic tunable filter (AOTF2), then directed to a galvanometer mirror (G3) and objective lens (L4) to create a time-averaged sheet of light in the sample chamber (C) via a prism (Pr5). Specimens flow through a system of tubing controlled by a syringe pump (Pu9) and valves (V10) and are automatically positioned in a square-walled capillary (Cap11) for imaging. Bright field images are used for positioning the sample and are illuminated with an LED (LED6). After imaging, specimens are directed into a reservoir (R). (B) Schematic of the imaging area. The 3D-printed sample chamber (C), prism (Pr5), and imaging capillary (Cap11) are apparent. (C) Photograph of the imaging area corresponding to the schematic in (B).
Fig 2
Fig 2. Specimen positioning and image quality.
(A) Composite brightfield image of a larval zebrafish positioned in a glass capillary. Scale bar: 500 μm. (B) Normalized intensity averaged along the short axis of the brightfield image, and the intensity of the template image that best matches the fish in (A). Cross-correlation with the template is used to automatically position the fish for light sheet fluorescence imaging. (C) Light sheet fluorescence images of a 28 nm diameter fluorescent microsphere, showing x-y and z-y planes centered on the particle. (D) Line-scan of intensity along the detection axis (z) through a fluorescent microsphere, with a Gaussian fit showing a width of approximately 3 μm.
Fig 3
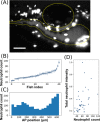
Fig 3. Imaging neutrophils in larval zebrafish.
(A) A maximum intensity projection of a three-dimensional light sheet fluorescence image of GFP-expressing neutrophils near the intestine of a 5 dpf larval zebrafish. The 3D scan is provided as S2 Movie. The intestine and swim bladder are roughly outlined by the yellow dotted lines. Scale bar: 100 μm. (B) The total number of neutrophils in each fish; the x-axis is ordered by neutrophil count. (C) Neutrophil count along the anterior-posterior dimension, summed over all fish examined (N = 41). The x-axis corresponds approximately to the horizontal range of (A). (D) The total intensity of the detected neutrohils per fish vs the total number of neutrophils in that fish. The two measures are weakly correlated with a coefficient of determination R2 = 0.4.
Fig 4
Fig 4. Neutrophil counts after exposure to LPS.
The number of neutrophils counted from light sheet fluorescence images of larval zebrafish after exposure to 150 μg/ml LPS for 0 (control), 2, or 24 hours. At 2 hours post-exposure, there was no discernible difference between the LPS-treated group and the control group. At 24 hours post-exposure, the LPS group displayed an increase in mean neutrophil count of 1.2 ± 0.1.

References

    1. Keller PJ, Schmidt AD, Wittbrodt J, Stelzer EHK. Reconstruction of Zebrafish Early Embryonic Development by Scanned Light Sheet Microscopy. Science. 2008. November 14;322(5904):1065–9. 10.1126/science.1162493 - DOI - PubMed
    1. Power RM, Huisken J. A guide to light-sheet fluorescence microscopy for multiscale imaging. Nat Methods. 2017. April;14(4):360–73. 10.1038/nmeth.4224 - DOI - PubMed
    1. Keller PJ, Ahrens MB, Freeman J. Light-sheet imaging for systems neuroscience [Internet]. Nature Methods. 2014. [cited 2018 Mar 22]. Available from: https://www.nature.com/articles/nmeth.3214 - PubMed
    1. Huisken J. Slicing embryos gently with laser light sheets. BioEssays [Internet]. 2012. [cited 2018 Mar 22];34 Available from: https://www.readcube.com/articles/10.1002/bies.201100120 - DOI - PubMed
    1. Santi PA. Light Sheet Fluorescence Microscopy. J Histochem Cytochem. 2011. February 1;59(2):129–38. 10.1369/0022155410394857 - DOI - PMC - PubMed

Publication types